24.03_1 “Traffic Graphs” does not keep its configuration
-
Hmm, I haven't see that. What do you do to unhide them? They are all marked as unchecked in the widget config after rebooting?
-
 S stephenw10 moved this topic from Problems Installing or Upgrading pfSense Software on
-
I haven't checked all the interfaces, only four in my configuration.
Yes, after reboot all are unchecked. All I have to do is check my four again and everything returns to the way it was before.
This is a new phenomenon, as it doesn't occur on other versions of “Pfsense plus”.
-
Hmm, yeah I can't replicate that.
Check the config file, you will see the traffic graphs settings like:
		<traffic_graphs>
			<refreshinterval>1</refreshinterval>
			<invert>true</invert>
			<backgroundupdate>true</backgroundupdate>
			<smoothfactor>0</smoothfactor>
			<size>1</size>
			<filter>opt3,opt4</filter>
		</traffic_graphs>
Interfaces in the 'filter' tags are hidden.
Is your config being updated correctly?
-
How do I check this file? Sorry, I have a little skill, but not yours.
I went from 23.09.1 to 24.03 and then to 24.03_1 (with an error message) but everything seems to be installed correctly.
-
You can open it directly in /cf/conf/confg.xml. Or you can download the config from Diag > Backup/Restore.
It's just an xml file you can open it in any text editor.
-
Sorry for my question and thank you for answering.
After rebooting and putting the right checkmarks back in “Graffic Graphs”, I saved the .xml configuration file and here's what I have now
<traffic_graphs> <refreshinterval>1</refreshinterval> <invert>true</invert> <backgroundupdate>true</backgroundupdate> <smoothfactor>0</smoothfactor> <size>1</size> <filter>opt1,opt2</filter> </traffic_graphs> -
Ok, and that's the expected config? So WAN and LAN and shown and opt1 and opt2 are hidden?
So what does the config file show after rebooting when all the graphs are hidden?
-
I've just done an interesting test
- Restarted my Pfsense
- On connection, I can visually see the graphs displayed normally.
- Then I click on the green “verify” button (displayed towards the top of the page)
- The graphs have disappeared
- Here's what I have in my XML BEFORE I put the ticks back
<traffic_graphs> <refreshinterval>1</refreshinterval> <invert>true</invert> <backgroundupdate>true</backgroundupdate> <smoothfactor>0</smoothfactor> <size>1</size> <filter>wan,lan,opt1,opt2,opt3,opt5</filter> </traffic_graphs> -
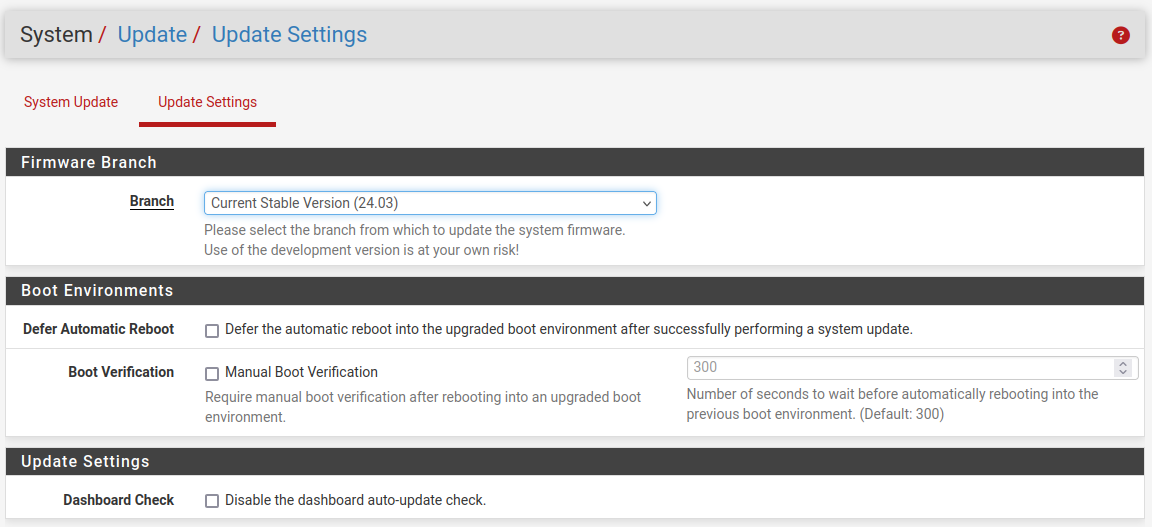
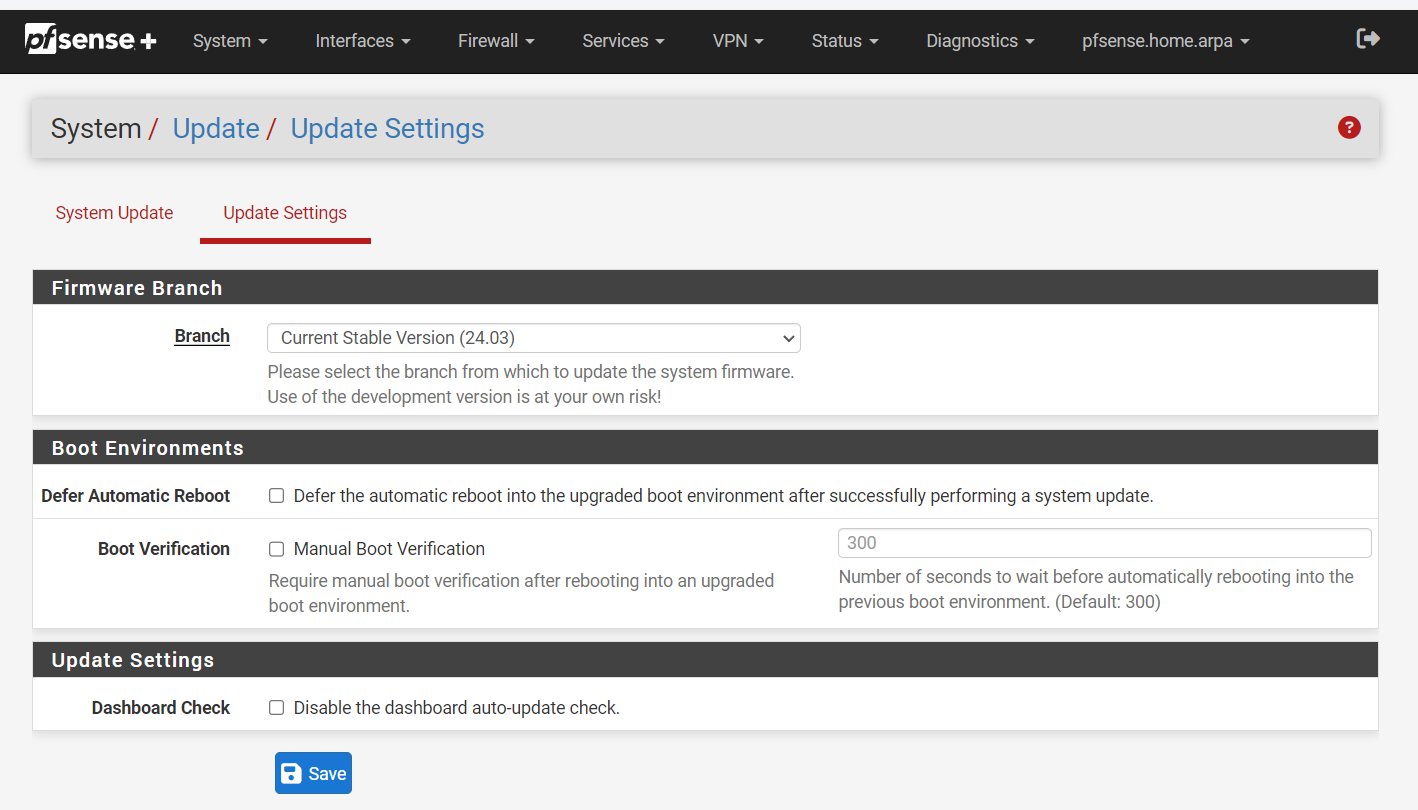
Ah, you have manual BE boot verification enabled?
Does any config change survive a reboot?
It sounds like it might be rolling back the BE.
-
I haven't manually activated this option (I don't know where it is).
I haven't noticed any settings that haven't been saved, but I haven't done any specific tests in this sense
-
It's in the update settings:

What exactly are you clicking on after rebooting?
-
Here is my current configuration
For security reasons during an update, should I set the ‘Boot Verification’ option instead?

-
No that's fine. Can you get a screenshot of the green button you are clicking after reboot?
-
One more piece of information ... and before reading your last message (because no more network))
I rebooted my Pfsense, and just after the boot (I connect it quickly) I have this message:

If I do nothing (i.e. I do NOT touch the green button), the graphics are there and remain!
In short, I'm going too fast to connect ... sorry to have taken your time for a problem that is not a problem
-
This post is deleted! -
Yup the
-1there in the countdown seconds means it hasn't yet triggered the countdown because bootup is still running. You see that if you login immediately.However I wouldn't expect the config to be changed...
-
Perhaps a ‘tiny bug’?
Thanks again for all your help and friendly replies, it's always nice to be taken seriously (even when you're not a ‘pro’ in Pfsense) and to get help!
-
@stephenw10 FWIW, I've experienced this a couple of times. Following reboot, getting a message saying that I need to verify the boot, even though I do not have manual boot verification enabled. When this happens I also see all the interfaces in the traffic graphs widget unchecked. Unfortunately I haven't had time to explore it.
-
Hmm, when you click verify or just whenever it appears?
-
Just tried a few times.
If I go into the UI very quickly following reboot, I find this:

If I leave it alone, all is good. However, if I click on the Verify button, I get this:
@@ -5877,7 +5867,7 @@
 			<invert>false</invert>
 			<size>8</size>
 			<backgroundupdate>true</backgroundupdate>
-			<filter>opt4,enc0</filter>
+			<filter>wan,lan,opt2,opt3,opt4,enc0</filter>
 			<smoothfactor>0</smoothfactor>
 		</traffic_graphs>
 		<gateways-0>

