Recent unexplained power consumption and temperature increases


-
@madbrain said in Recent unexplained poiwer consumption and temperature increases:
As far as the CPU temperature, I already enabled PowerD in system / advanced / misc. Is that the driver you are talking about ?
No it's the
Thermal Sensorssetting and it should be set to the AMD driver in your case.Temperatures are logged in Status > Monitoring:
I would not trust that SSD at that age after it disappeared like that whatever SMART reports.
On a passively cooled system running in the BIOS setup can make a big difference.
-
@stephenw10
Thanks. !"thermal sensor" was already set to the AMD driver. It must have been done automatically.
I tried to get the same graph you did. Here is what it looks like :
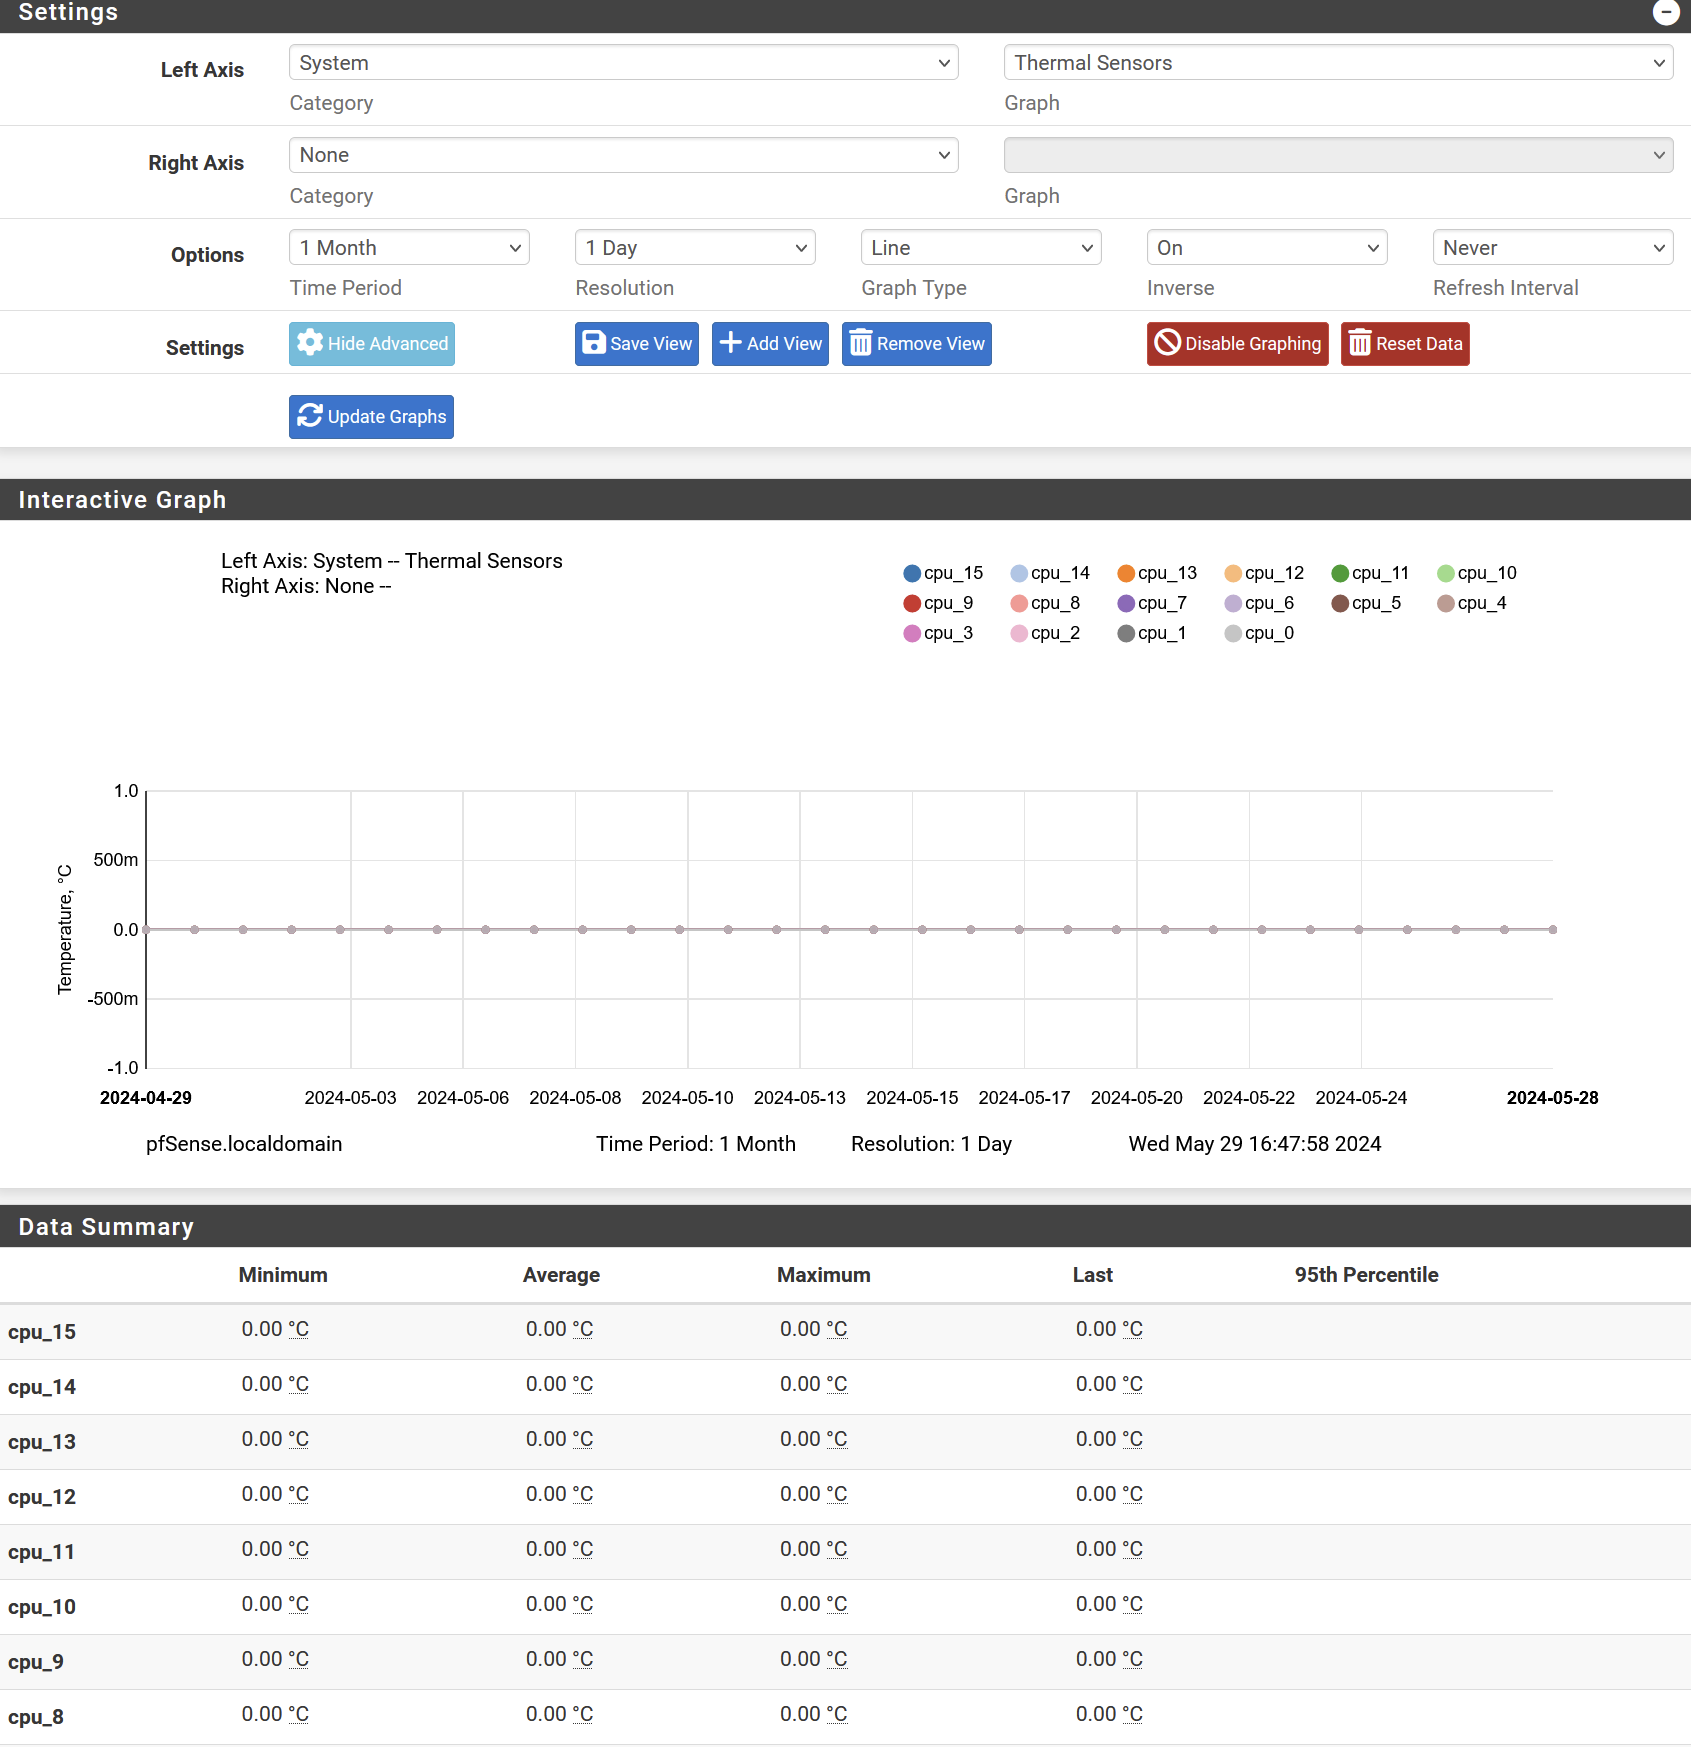
Unfortunately, the CPU temperature is getting logged as zero for all cores/threads. A,nd there is no separate tz0 sensor like the one you have.
This is pretty strange since the System information on the dashboard does show the temperature, currently at 42C.
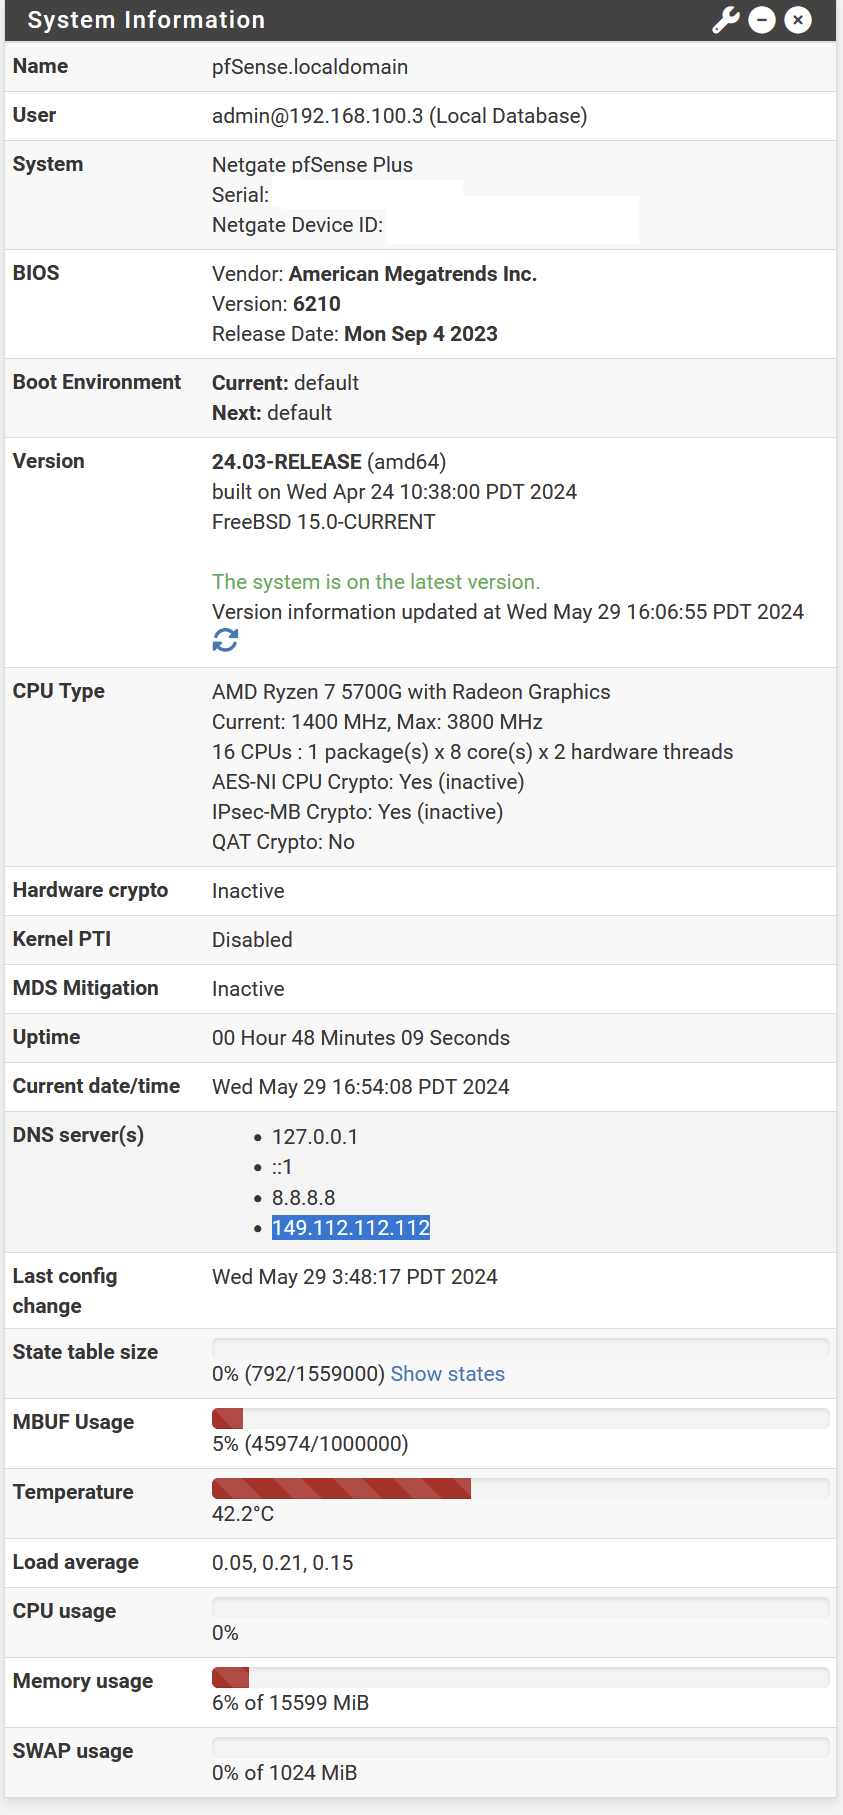
The system log does show the following :
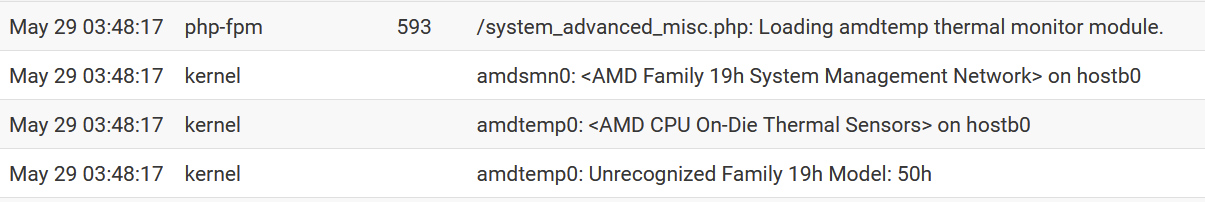
So, perhaps that explains why pfSense cannot fetch per-core/thread temperature. It does have access to the overall CPU package temperature, but does not seem to be logging it, unless again, I missed it.
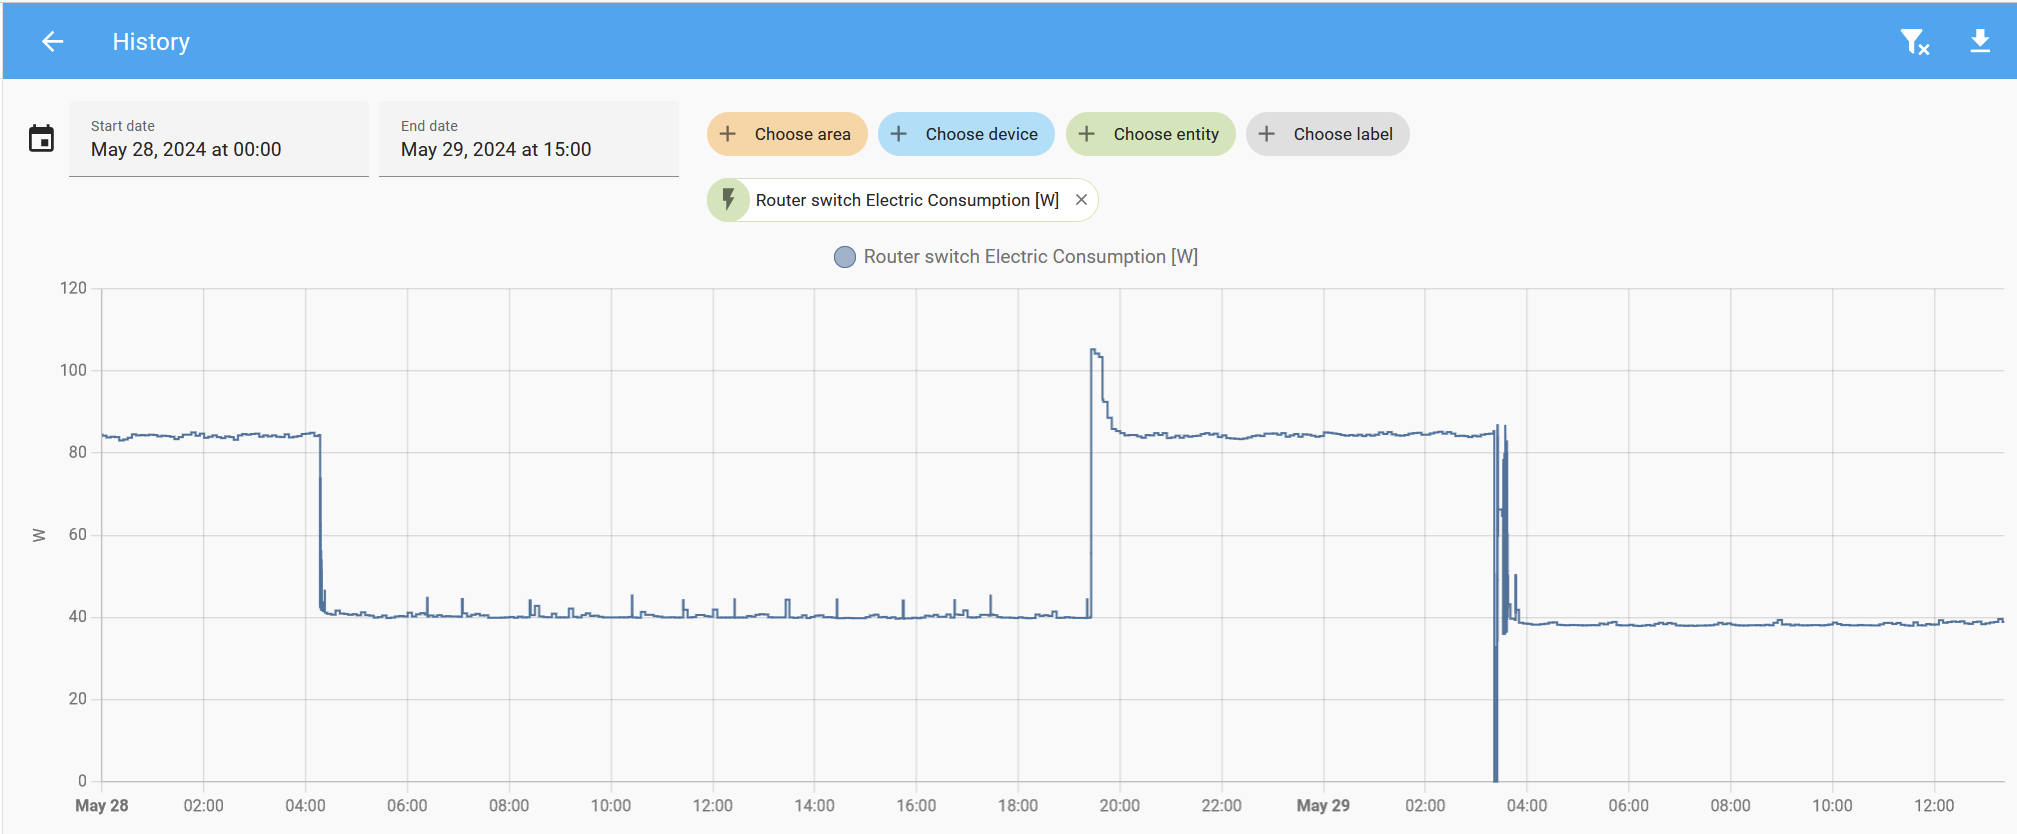
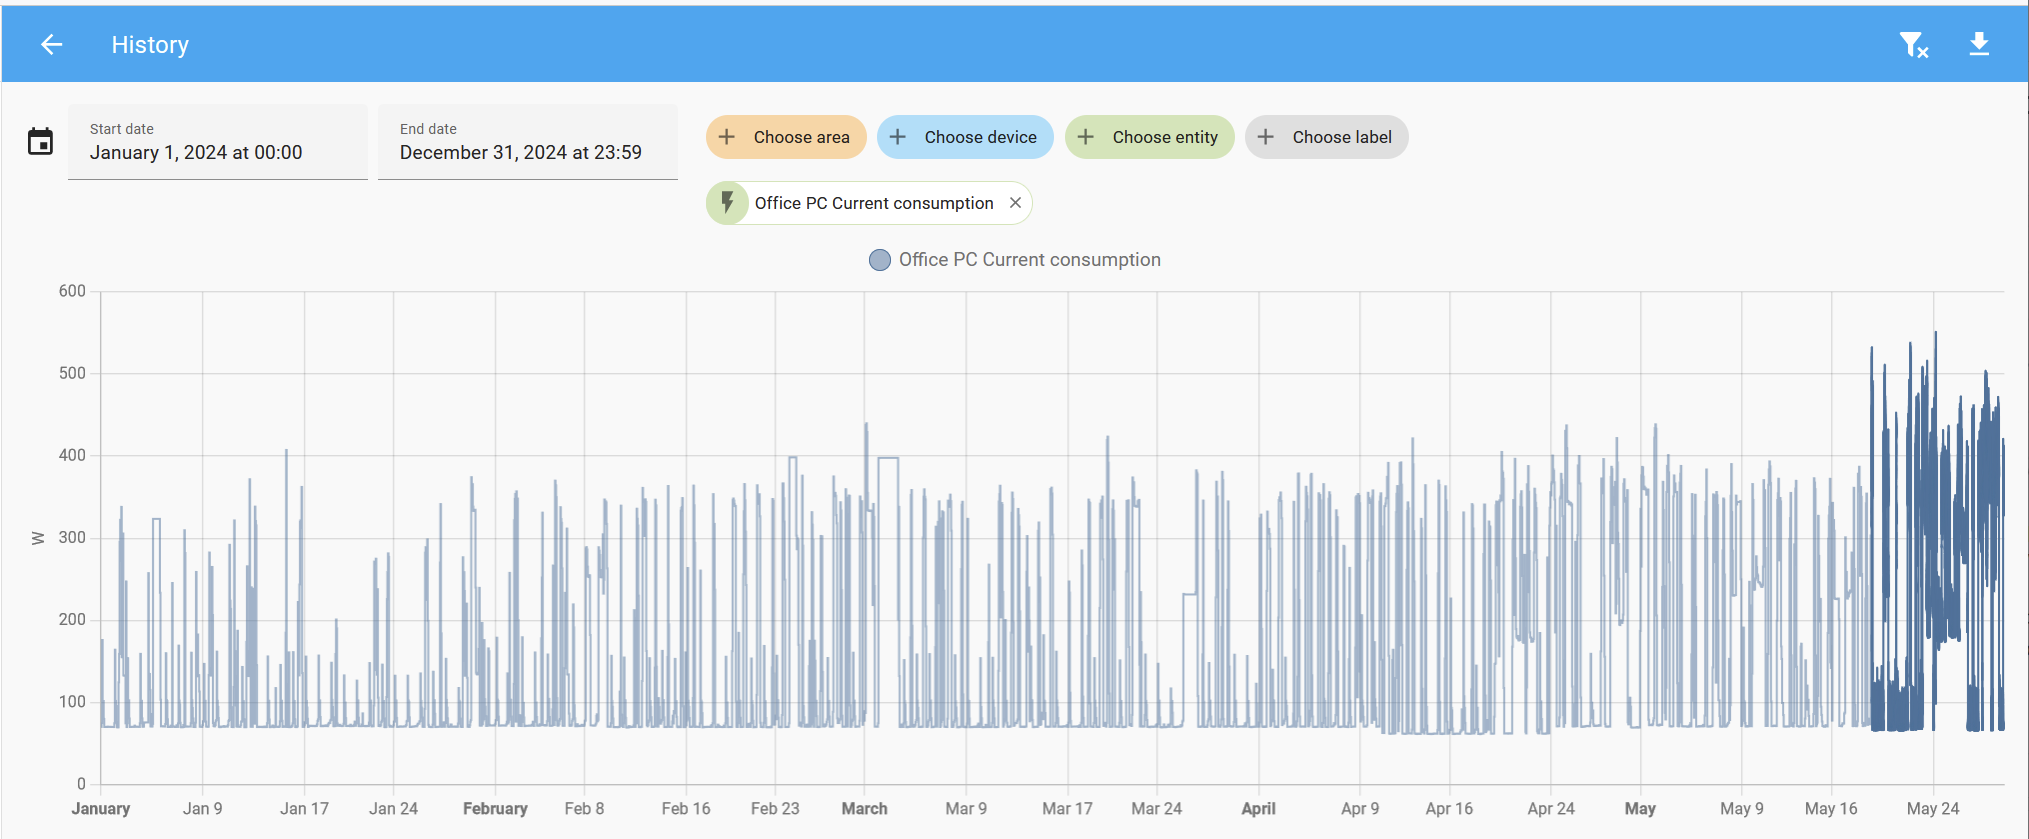
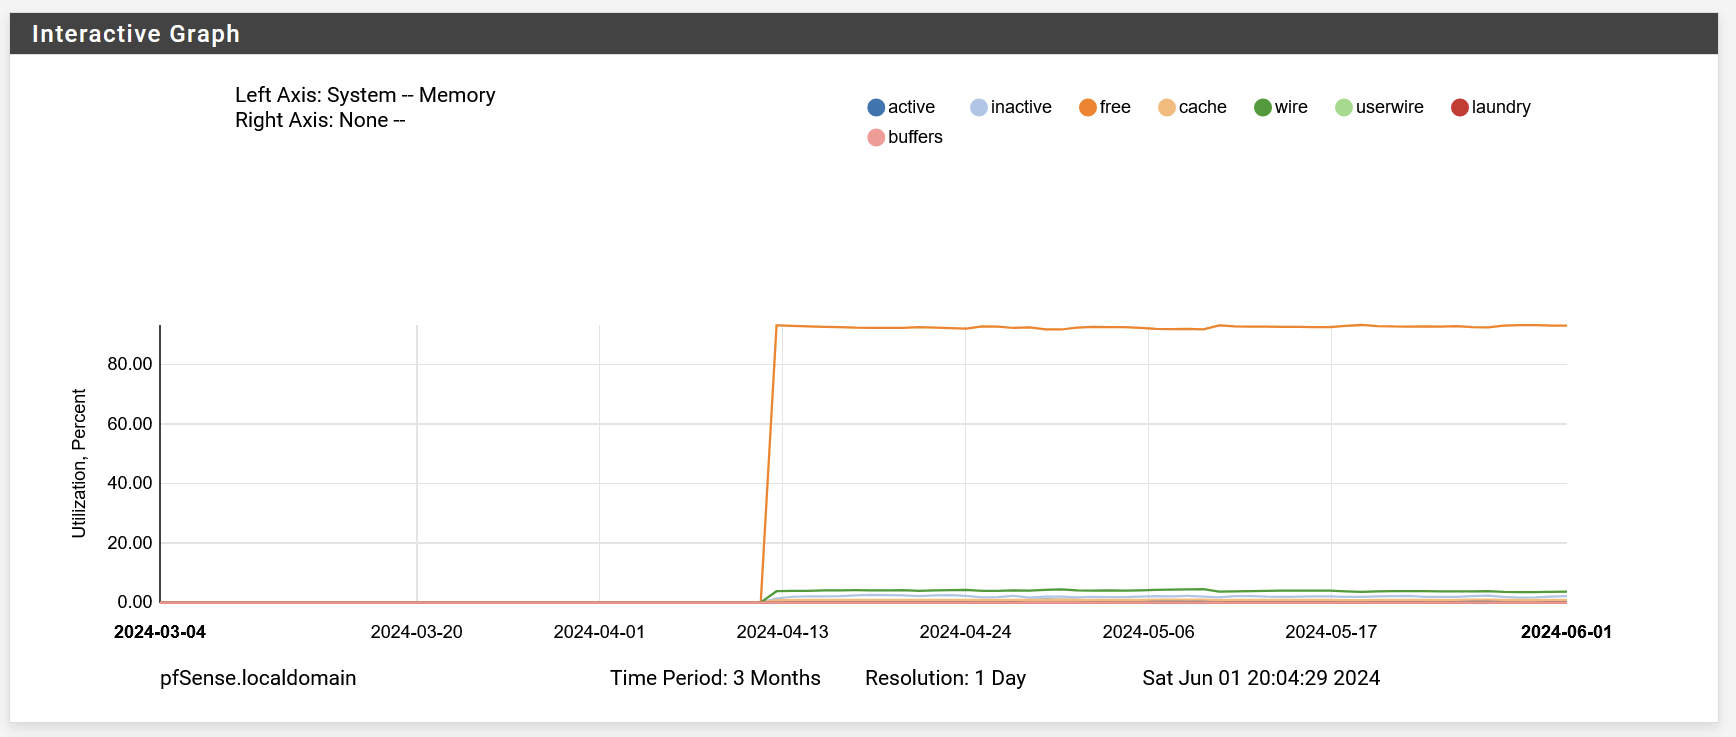
I wandered on the monitoring page looking at more data over the last month.
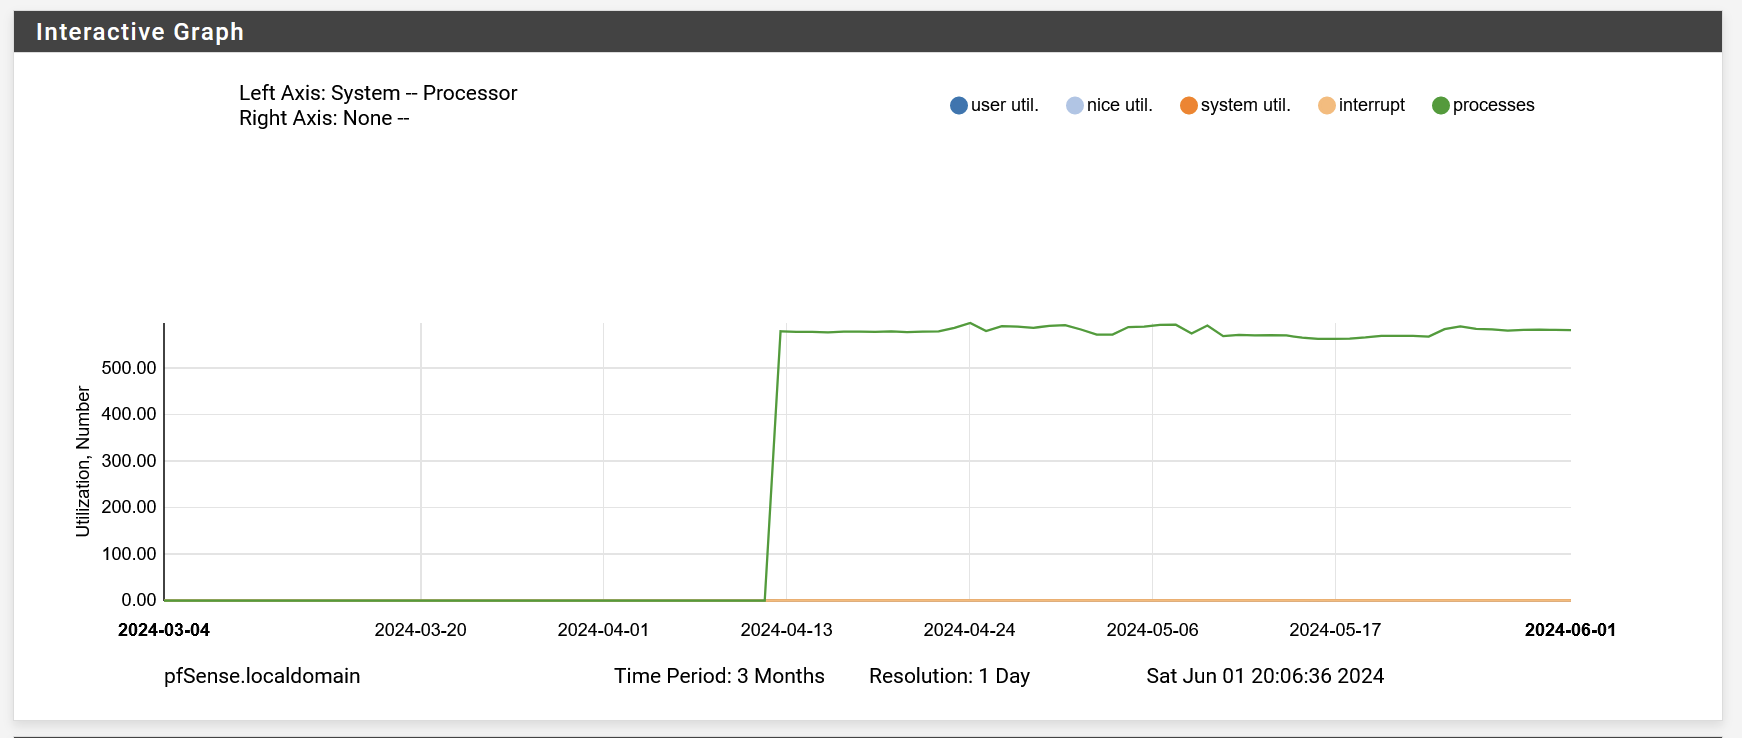
Processor is near zero - a fraction of one percent the whole time. It never spikes.
Memory is over 90% free for the entire period.
States fluctuates a bit, but does not correlate with elevated power consumption.
LAN traffic has spikes last week related to updating the EXIF data for 1TB's worth of pictures. Nothing that correlates to last night's event though.
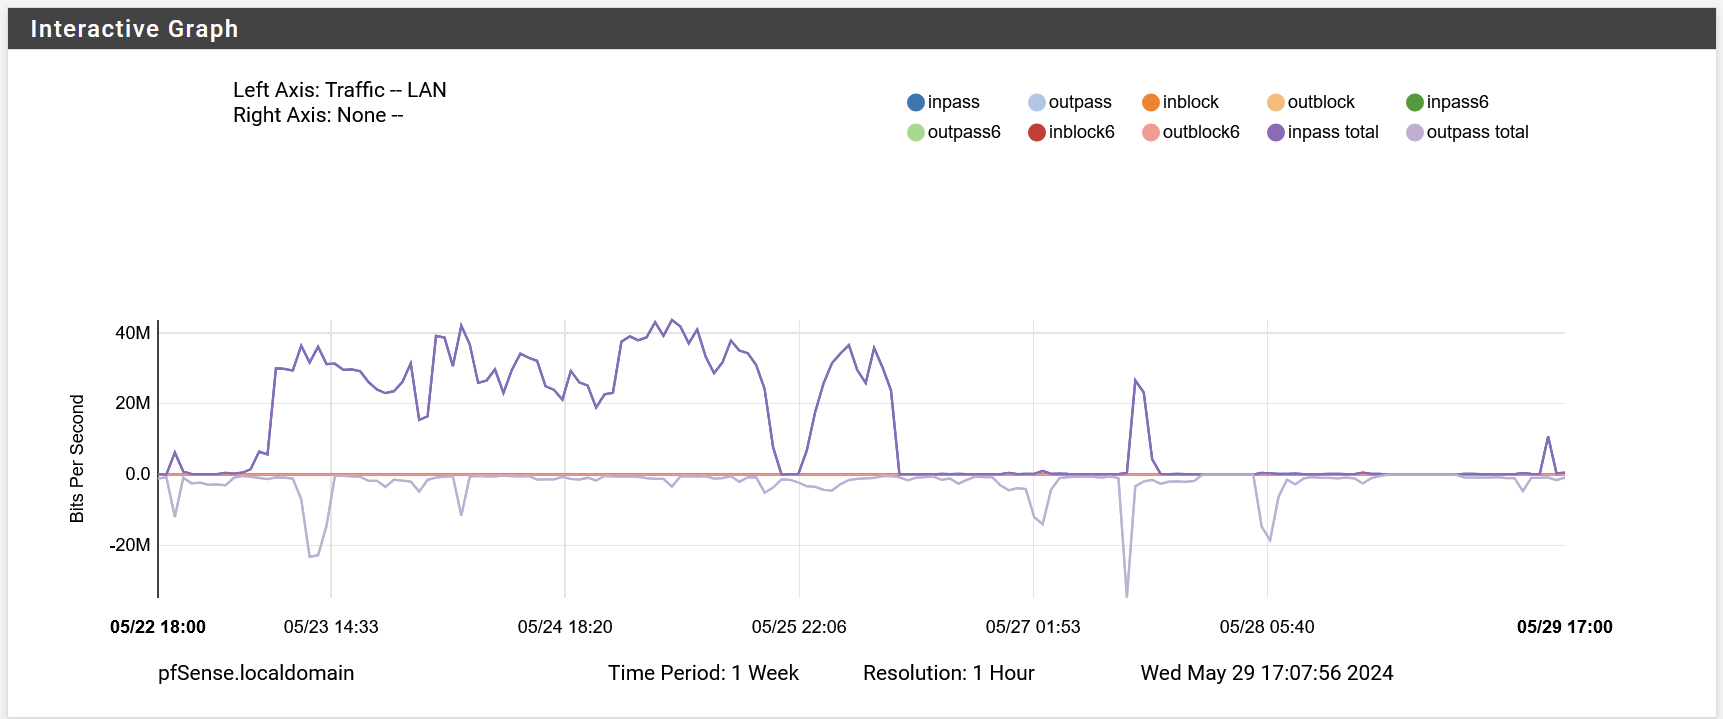
Traffic on SAIL (WAN) is basically the opposite of LAN, not correlated.
I went through all the possible categories and subcategories. I couldn't find anything that correlated with the increased power consumption in the last week, or the tangible increase in heat I experienced last night.
The fact that there is not constant traffic means if there is an attacker/virus, it's not affecting the traffic enough to be noticeable.
The 2 other machines that are also experiencing this problem are both Windows machines and as far as I know, there is no logging.of CPU temperature or usage.
The other thing these 3 devices have in common is that they are all on 10 Gbps ethernet, on TP-Link TL-SX105. It's actually a pair of these switches. Maybe they are failing in subtle ways, and causing clients to overheat ? One of them uses an Intel X550-T2, same as the pfSense box. And the other uses an Aquantia AQC-107. If I could reproduce the problem on-demand, I would move all 3 machines to a 1gig switch and see what happens. Unfortunately, it is intermittent.
You may be right that the old SSD can't be trusted, but I don't think there is strong evidence of that.. A SATA device cannot consume an extra 40 -60W, which is the increase I saw. IMO, that increased in wattage was caused by something else. Especially since multiple machines seem to be affected. That increase power consumption caused increased heat. I believe this is what's caused the motherboard SATA port to fail, and not the old SSD. Unfortunately, there is no history of temperature available to review. But I did notice by physically putting my hand on that case last night that it was abnormally hot, and CPU temp was 85C in BIOS whereas it is currently 42C under pfSense.
-
One more thing - pfSense refers to the thermal sensors module for AMD as being for K8, K10 and K11 . As far as I can tell, the K11 does not exist.
I ran CPUID on my other box based on the AMD 5700G APU, and it listed a family "F" and extended family "19h". Safe to say it's not supported by this driver.
I'm going to switch to None/ACPI and reboot per the instructions, and see if anything starts getting logged.
-
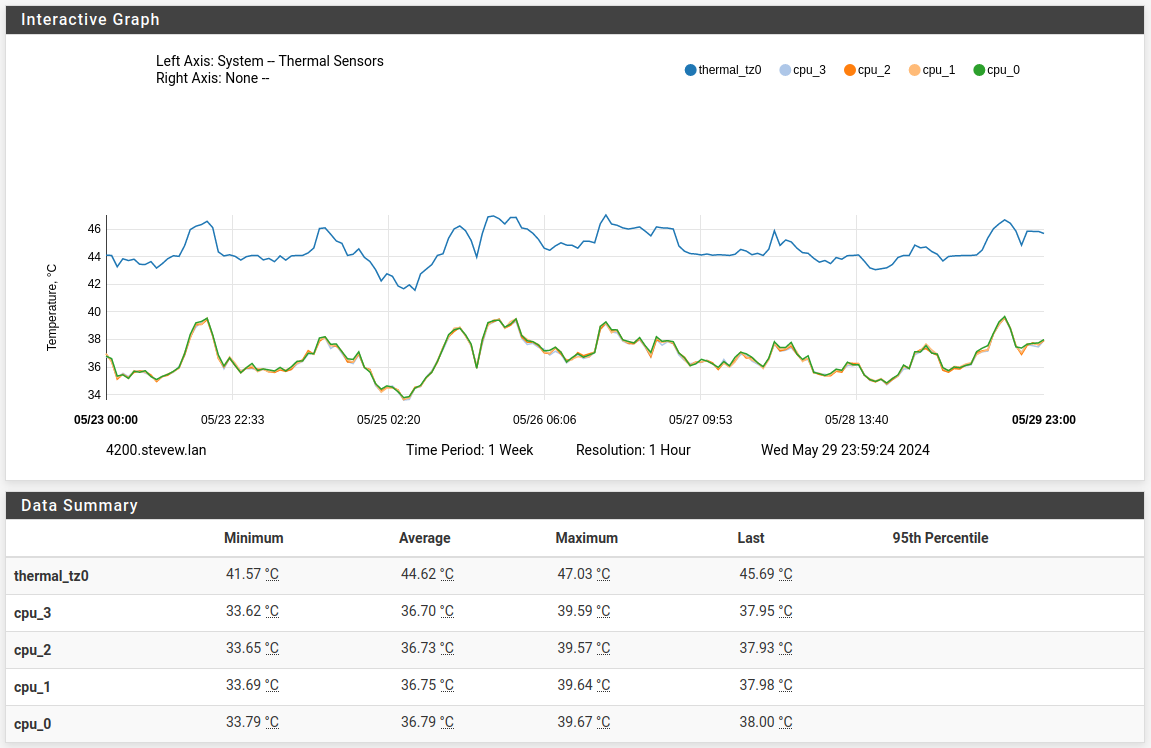
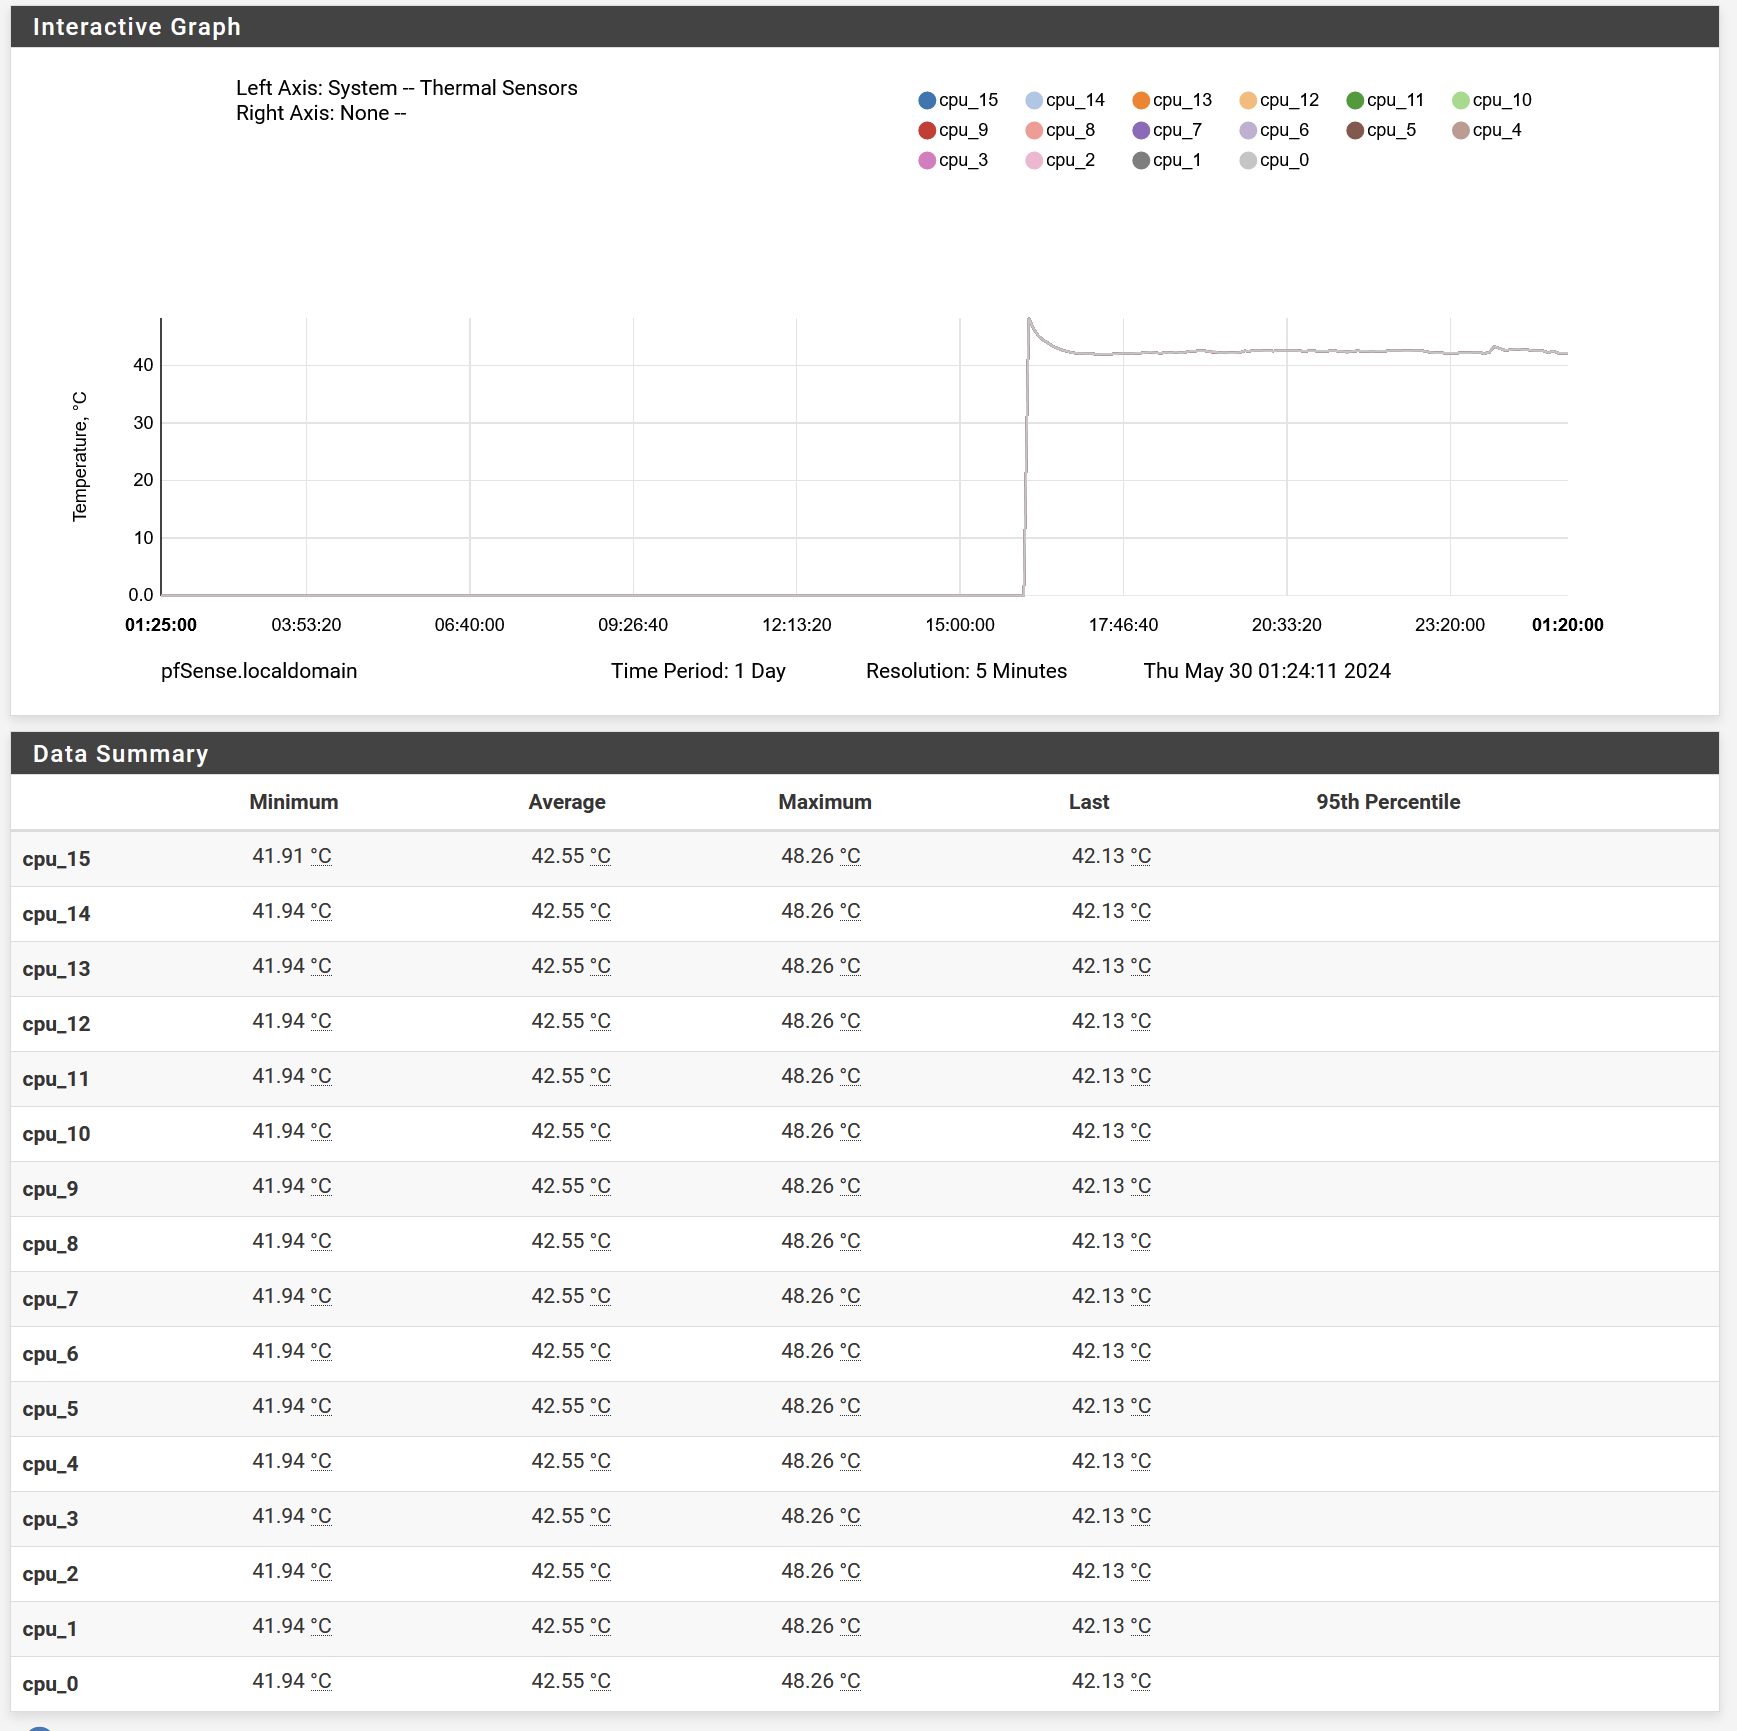
Good news, the "none" setting caused pfSense to finally start logging some temperature data. I should know next time when upcoming power consumption / heat spikes happens. But not sure what I'll be able to conclude.
-
Hmm, interesting. If you set it back to amdtemp after boot does it still show nothing logged?
Does the Thermal Sensors widget on the dashboard also show zeros?
I wouldn't expect to see values for each core when relying on ACPI temperature readings.
-
@stephenw10 said in Recent unexplained poiwer consumption and temperature increases:
Hmm, interesting. If you set it back to amdtemp after boot does it still show nothing logged?
I would assume so - that is the setting I was using before. I don't want to reboot pfSense unless absolutely required. I have one really ill-behaved device that goes down, and stays down, when the router is rebooted. Have tried to get the manufacturer to fix it, to no avail. I just put a smartplug on it to avoid wearing down the power connector. It's still a manual intervention to power cycle it. Maybe I can come up with some Home Assistant automation to deal with it ... sigh.
Bad things happen to the wireless APs when the gateway goes down also, because they are meshed. The topology takes a while to reconstitute itself with the right mesh priorities. And that means some of the 91 Wifi devices might not connect, or connect to the wrong AP. Or connect to the right one, and have really poor performance if it's meshed with the wrong uplink. Wish I could put Ethernet throughout the house, but it's an impossibility.
Does the Thermal Sensors widget on the dashboard also show zeros?
I wasn't aware of that widget. It shows the per-core temperature, and those were showing as all zeroes in the status/monitoring screen when using amdtemp. Now they are all the same value as the temperature under "System operation".
I wouldn't expect to see values for each core when relying on ACPI temperature readings.
There are values - just all identical.
-
Could it be that your pfSense is downloading several data such as;
- snort or suricata rule sets
- clamav virus database
- SquidGuard Blacklists
- pfBlockerNG feeds
- CrowdSec lists
This could be also increesing the RAM usage and by site also a higher
CPU and SSD (temp) usage. -
@Dobby_
Thanks for your reply.I have not heard of most of these. I'm not using them.
As far as RAM usage, it hasn't budged :
Neither has the CPU .
As I said in an earlier post, I looked at everything under monitoring that pfSense records, and there was nothing correlated with the increase in power consumption. The temperature is the one thing I would have expected to increase, but it wasn't previously recorded due to the problem with amdtemp. So far, I have not had a spike in temperature since I switched to ACPI. And no spike in power consumption as recorded in Home Assistant by my smartplug. It's only been a couple days since pfSense can record temp.
-
Hmm, surprising that CPU isn't supported. It's not that new.
-
@stephenw10 yeah. It's a FreeBSD issue. Amdtemp only supports families up to 17h. The 5700G is 19h.