Recent unexplained power consumption and temperature increases
-
Sorry for the long post. The TLDR is that my pfSense box has been overheating in the last week, and I can't figure out why.
I have been running into a few reliability issues this week with my custom, fanless box. pfSense stopped doing its job. I think the UI failed to work. I believe it was still routing packets, but the DNS went down. I used my KVM switch to see the console output. There were reports about my ZFS pool corrupting. It happened twice this week. The first time, a simple reboot fixed it. The second time, it did not. The BIOS on the Asus Prime X470 Pro motherboard did not even detect the SATA SSD. This was a very old SSD, a Kingston 96GB of 2011 vintage.
I had a spare SSD, a Crucial M4 128GB of the same vintage, which I flashed with pfSense CE 2.7.2 from my Windows host. Put it in the SATA hotswap bay of my pfSense box. And, lo and behold, the BIOS did not detect that SSD either ! My SATA hotswap bay happens to have two 2.5 slots. I put the Crucial M4 in the second slot, and it was detected by the BIOS. I then put the original Kingston SSD in that slot, and it was detected as well.
However, while looking at things in the BIOS, I noticed the following in red letters near the top "CPU temperature : 85°C". It was very surprising to see such a high temp at 3am. Obviously, this was not good. The top of the case was also quite hot. I set the BIOS settings back to defaults in order to lower things like DRAM voltage. I then booted pfSense on the original Kingston SSD.
I enabled PowerD and set AC/Battery/Unknown power to Minimum. I did not write it down at the time, but the reported temperature in the system info widget was much lower than 85C. The top of the case was still very hot when I finally went to sleep at 4am. When I woke up today, pfSense was still running fine, and the top of the case had considerably cooled down. pfSense reports a temperature of 40.6C . I don't believe this is accurate. At least, it is not likely to be the CPU temperature, as it's far too low. It is an AMD 5700G APU, using a Noctua NH-D15 cooler, and no fan on it, or anywhere in the case.
I have another nearly identical box - same APU and cooler - but with far more drives (5 x 4TB NVMe SSDs), running Windows 10, as NAS and media server. It has never experienced any cooling issues, unlike my pfSense box. The case is different, though. It has top exhaust, instead of rear exhaust.
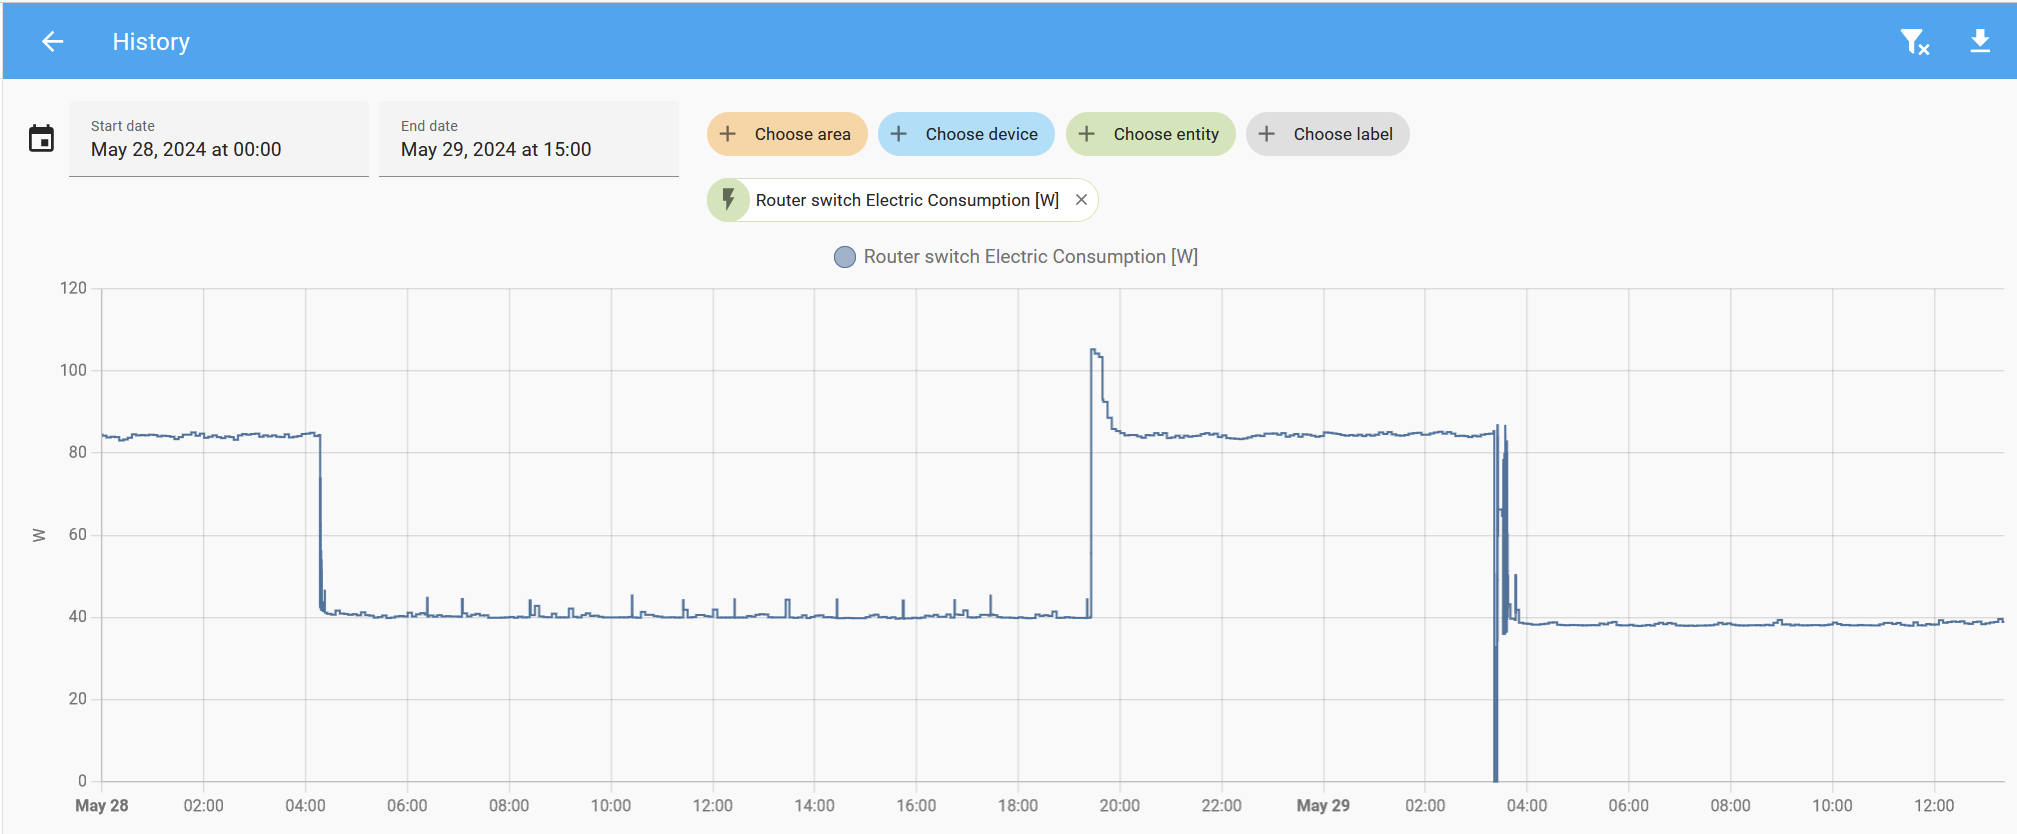
I happen to have my router plugged in to a Z-Wave smartplug. It also monitors power consumption. Home assistant - running on the Windows box - collects this data. I just looked at the wattage curve for the pfSense box for the last 24 hours.

It normally stays around 39-40 watts when idle. That is what I measured when I first built the machine. However, I see spikes at much higher wattages. First at midnight to 4am of about 84W. And then spiking shortly at 7:25pm at 105W. Dropping to 0W at 3:23am when I had to power the box down. Then back to 38W until now. I can't really explain why the wattage is going up so much for long periods of time, rather than spiking occasionally when there is increased traffic. I do use the network quite a bit. The drop at 4am would normally explained by me going to sleep. However, I completely skipped sleep that night. I was up the whole time. until the second 4am data point.
The increase from 7:30pm to 3:23am is also very strange. I have no idea of the significance of either of those two times. The drop at the second 4am point is correlated with me finally going to sleep. But I don't think it's adequately explained, still.I reviewed the wattage curve for the pfSense box for the entire year of 2024 so far :
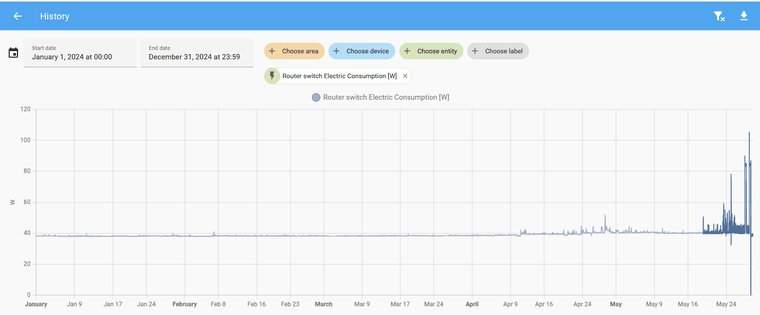
It turns out the wattage had been very stable around 40W without any spikes from Jan 1 until April 10. And these were fairly small - the highest wattage was 52W on April 28. There were more and more spikes in May. On may 25, there was a peak at 76W. Then 91W on may 27. And finally 105W on may 28.
I would expect most people have built systems that have fans in them, and are therefore not experiencing cooling issues. I'm very sensitive to noise, which is why I built these 2 boxes (ppfSense + NAS) fanless. It had been working trouble-free until this week. With about 40W it did fine with passive cooling. At 80-100W, it clearly does not.
Edit: I'm also monitoring the consumption of the very similar "flash" box which is running Windows. Same AMD 5700G CPU, but has 5 x 4TB NVMe instead of 1 x 96GB SATA. I was extremely surprised to see this :
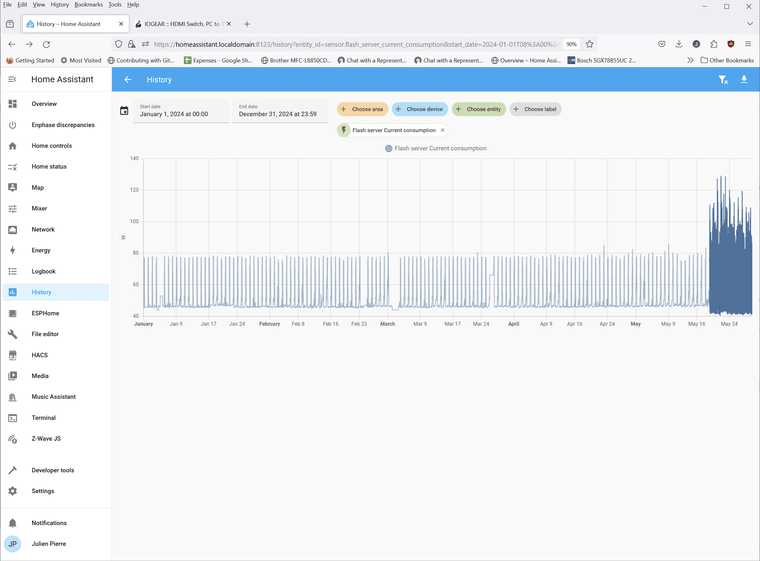
It looks like that box also experienced a very significant spike in wattage ! I also can't explain it. The issue with both machines are probably correlated. I would guess there is some sort of network traffic affecting both.
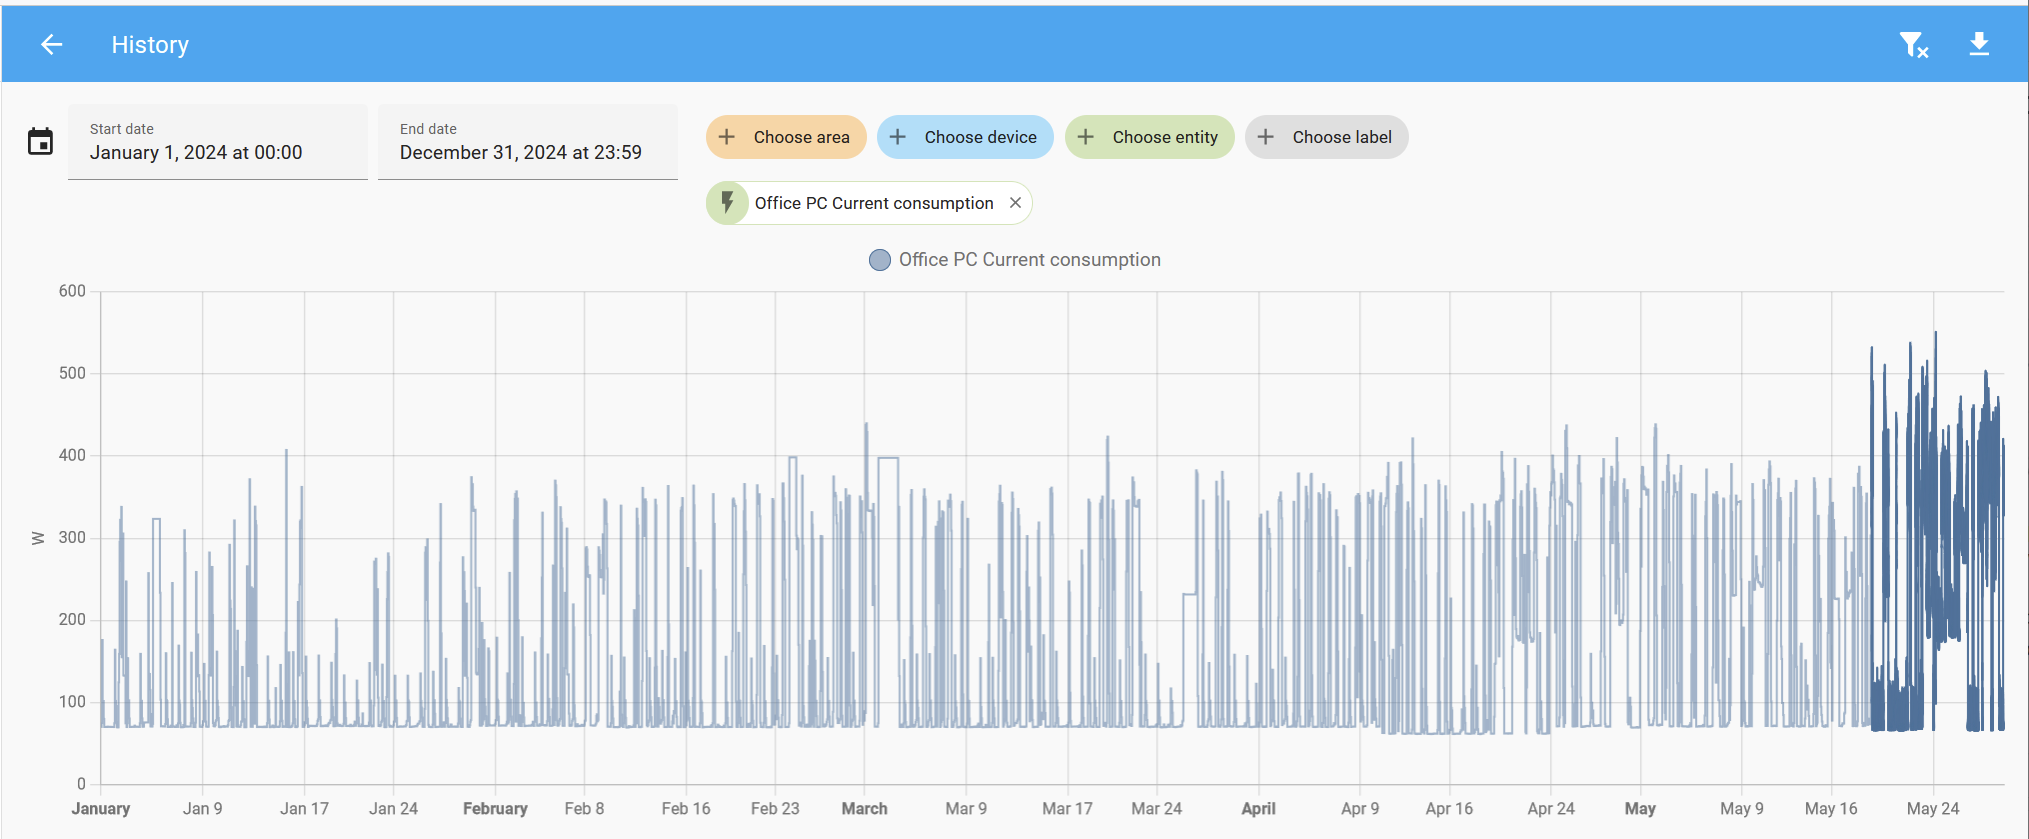
I got even more curious. I also have a smartplug monitoring my very powerful desktop PC + 3 monitors. There is probably something else connected to the smartplug also, since the amount never seems to go below 80W. It should be closer to 0W since the desktop is not on 24/7 (I use sleep mode) and the 3 monitors use DPMS.
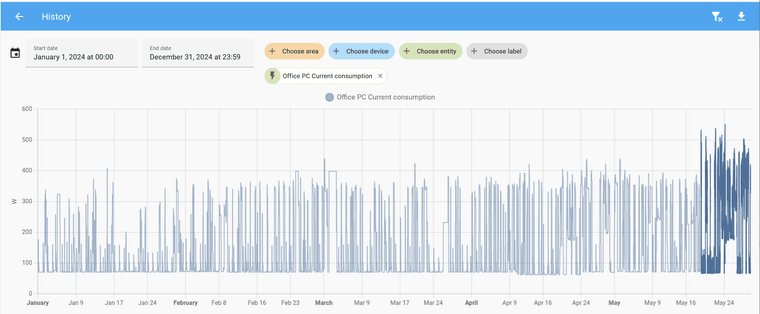
Things start looking bad on May 19. There is a peak at 551W on May 24. Wattage never reached 500W until May 19.
Questions :
-
what could account for such drastic increases in wattage for such long periods of time ? I really can't understand why the wattage is more than doubling for so many hours at a time- 8 hours out of that 24 hour period.
-
is there anything to search in the logs that might help identify any process taking an inordinate amount of CPU ?
-
does pfSense support ECC RAM ? The motherboard supports it. This would help detect overheating problems, and hopefully abort before ZFS pool corruption happens, and also before a SATA port on the motherboard gets fried as a result of overheating.
-
is there any improvement that could be done to the temperature monitoring feature ? PCs typically have many sensors, for various parts of the motherboard, and also the CPU. Even GPUs and other boards have them. I think it would be very valuable to display the CPU temperature in addition to the existing temperature display - wherever that's coming from.
-
Could these temperature values also be logged ? That would help a lot to correlate with other logs (processes, top, etc)
-
-
That is probably a failed SDD. Often they will 're-appear' after a power cycle but will always fail again.
When you're in the BIOS setup the CPU usually uses far more power than after booting an OS. That's because you get none of the CPU halt/idle features the OS provides. The CPU just runs at the default frequency on all cores with no idling. So if you were sat at the setup screen for some time the system would run much hotter.
pfSense will log CPU core temps as long as you have the driver loaded in Sys > Adv > Misc.
Steve
-
Steve,
Both SSDs are fine, actually, when hooked up to another machine. I looked at the SMART information and the were both healty.
pfSense is currently booted off the same SSD I have been using it on for over a year, the Kington 96GB. However, it's on a different SATA port than before. I believe one SATA port on the motherboard died. Or the motherboard was still too hot. I have not checked again now that it has cooled down.I agree with you that the CPU uses more than normal on the BIOS screen. However, IMO, 85C is not explained by just the BIOS screen - it is because the CPU was already hot for hours before being manually rebooted, due to encountering the ZFS failure.
As far as the CPU temperature, I already enabled PowerD in system / advanced / misc. Is that the driver you are talking about ? If so, where is the temperature logged ? I'd like to see a curve of the temperature over time, ideally. As far as I know, the temperate is only displayed on the dashboard under "System information". I could not find any log that contained the temperature. Did I miss it ?
-
-
re: SATA SSDs.
I confirmed after the reboot that at least one of the 6 SATA ports on the motherboard is fried. Only the bottom slot of my passive 2.5in SATA hotswap drive bay works. I tried multiple known good SSDs in both slots. The top slot no longer works. I can't remember the last time I saw a SATA port fail on a motherboard. My guess is that this failure was caused by excess heat, correlated with the high wattage in the last week. A motherboard replacement is probably in order. Not sure if the CPU needs replacement as well. -
the temperature being logged in pfSense really is the CPU temp. In the BIOS, I was seeing 62C. After booting to pfSense, it was at 61C, and dropping. It is now at 45C. I still would like to see a history of these values over time so I can correlate with power consumption and/or network traffic.
-
network traffic
The fact that multiple machines are affected by the elevated power consumption makes me wonder if there isn't some sort of network virus/attack at play that uses the CPU and/or bandwidth during certain times. Seems a bit unlikely that both FreeBSD systems and Windows systems would be affected by the same virus, but I don't have any other idea at the moment.
Is there any way for pfSense to show the traffic stats on every client over time? This would let me see if any is correlated with the elevated power consumption.
Every device I have uses DHCP reservations. But there are tons of them - 136 reservations right now, though not all the devices are powered on at all times. Without traffic logs per client, or even MAC address (since attacker may use custom ones), it won't be possible to figure it out.ChatGPT tells me pfSense doesn't log stats for each client, unfortunately. It lists several packages that do - ntopng, bandwidthd, , darkstat. Is any of these recommended over others ? The option of remote syslog analysis is also mentioned, but I don't see any of the relevant information in the system log.
-
-
@madbrain said in Recent unexplained poiwer consumption and temperature increases:
As far as the CPU temperature, I already enabled PowerD in system / advanced / misc. Is that the driver you are talking about ?
No it's the
Thermal Sensorssetting and it should be set to the AMD driver in your case.Temperatures are logged in Status > Monitoring:
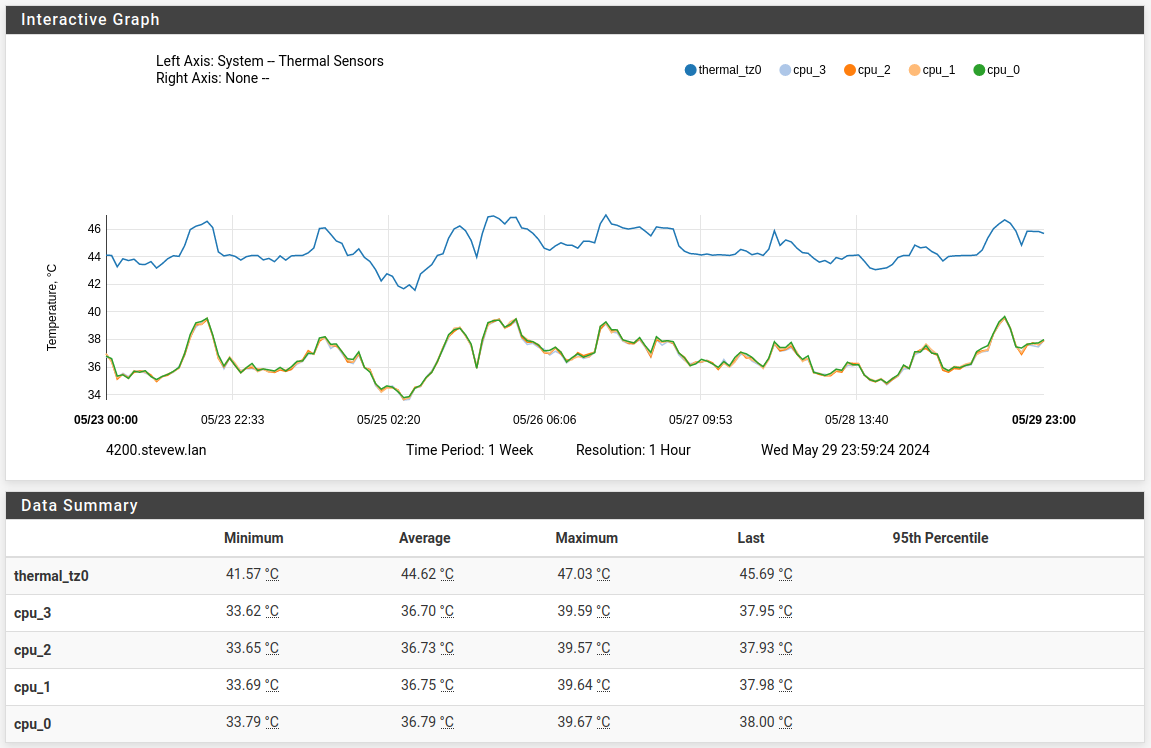
I would not trust that SSD at that age after it disappeared like that whatever SMART reports.
On a passively cooled system running in the BIOS setup can make a big difference.
-
@stephenw10
Thanks. !"thermal sensor" was already set to the AMD driver. It must have been done automatically.
I tried to get the same graph you did. Here is what it looks like :
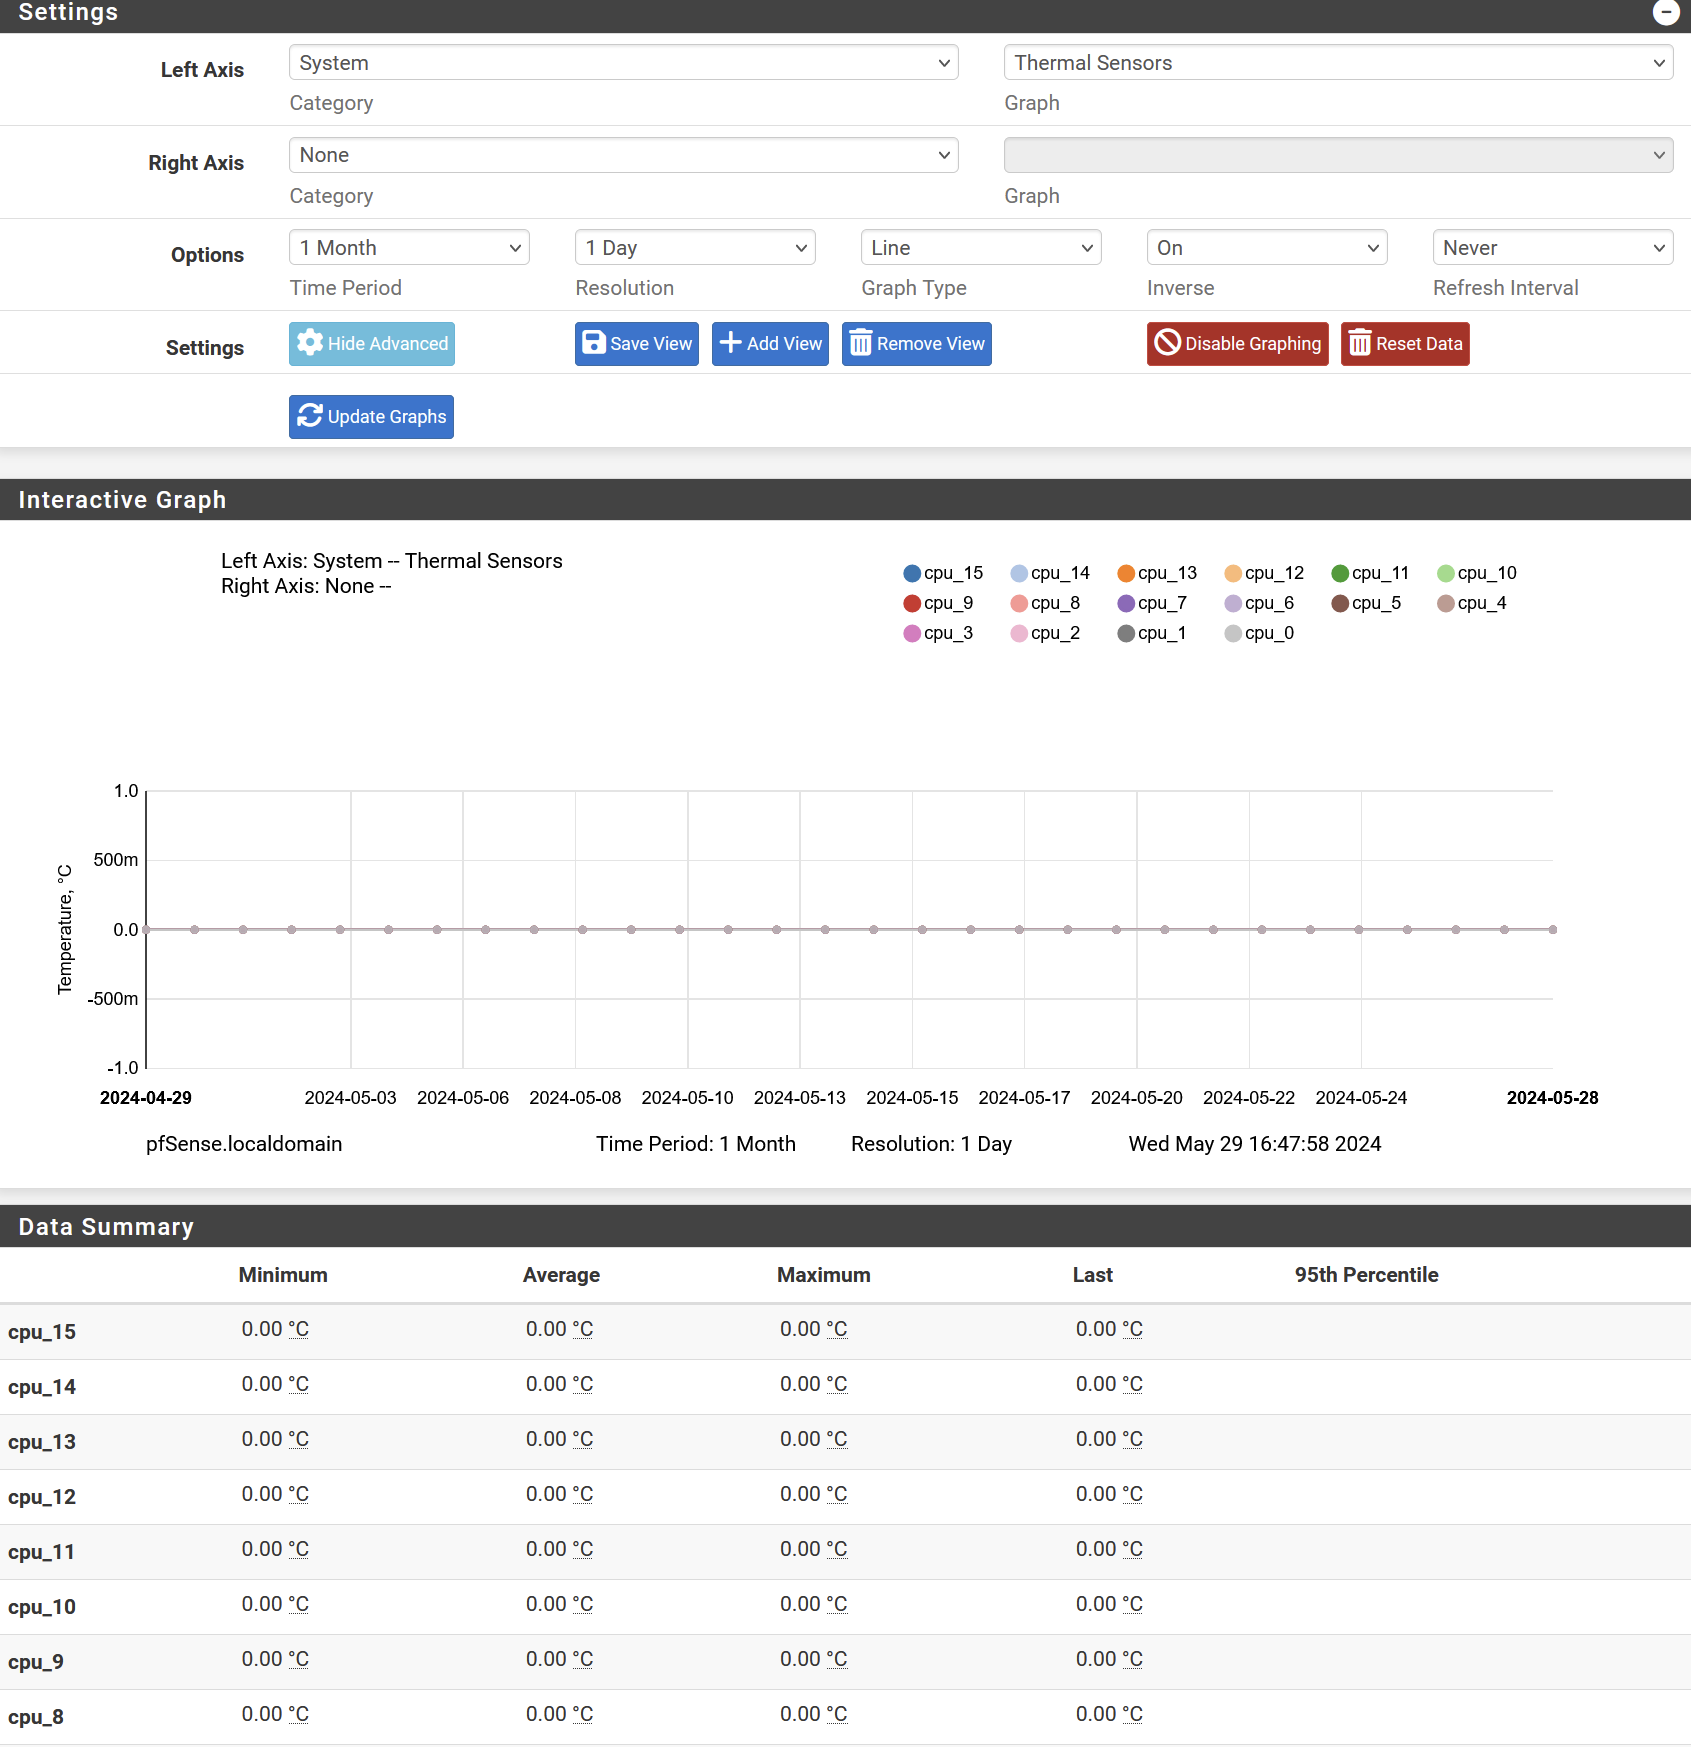
Unfortunately, the CPU temperature is getting logged as zero for all cores/threads. A,nd there is no separate tz0 sensor like the one you have.
This is pretty strange since the System information on the dashboard does show the temperature, currently at 42C.
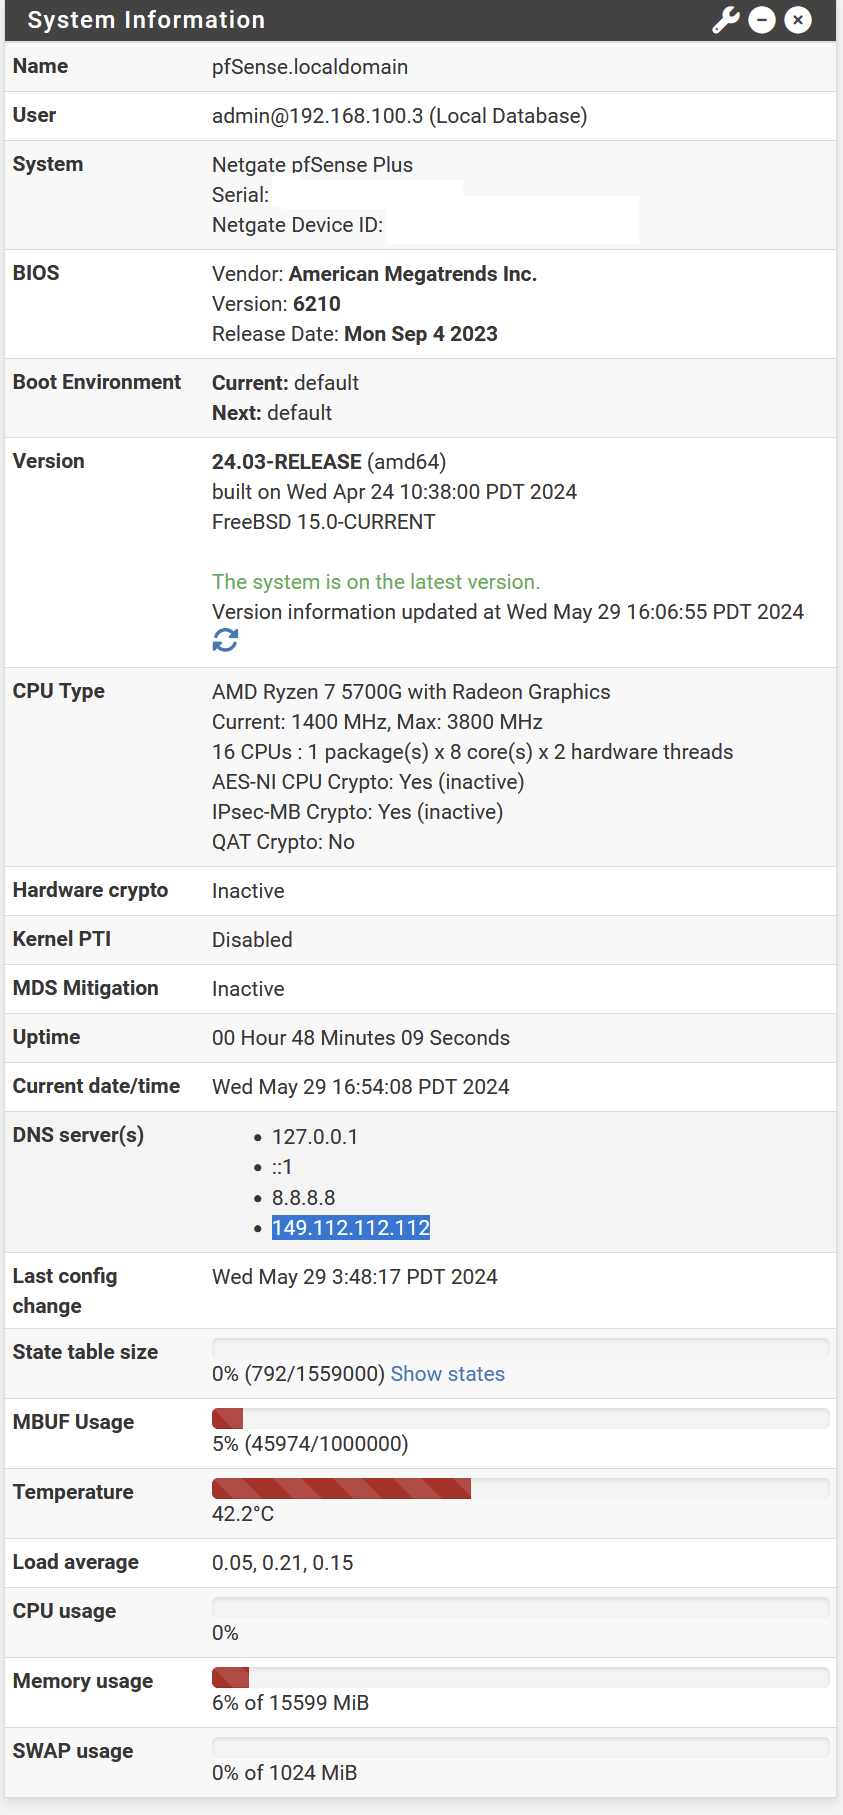
The system log does show the following :

So, perhaps that explains why pfSense cannot fetch per-core/thread temperature. It does have access to the overall CPU package temperature, but does not seem to be logging it, unless again, I missed it.
I wandered on the monitoring page looking at more data over the last month.
Processor is near zero - a fraction of one percent the whole time. It never spikes.
Memory is over 90% free for the entire period.
States fluctuates a bit, but does not correlate with elevated power consumption.
LAN traffic has spikes last week related to updating the EXIF data for 1TB's worth of pictures. Nothing that correlates to last night's event though.
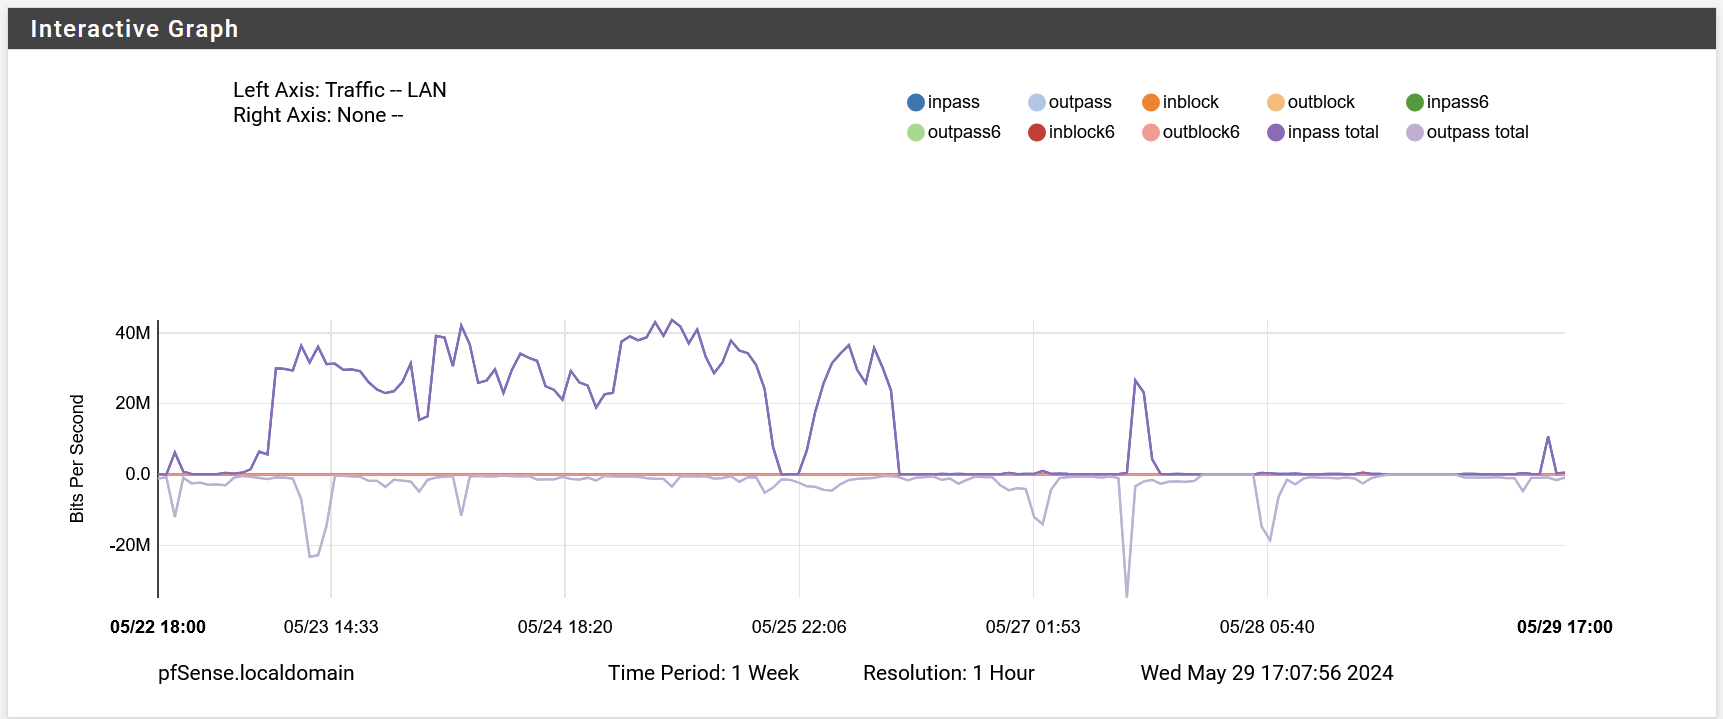
Traffic on SAIL (WAN) is basically the opposite of LAN, not correlated.
I went through all the possible categories and subcategories. I couldn't find anything that correlated with the increased power consumption in the last week, or the tangible increase in heat I experienced last night.
The fact that there is not constant traffic means if there is an attacker/virus, it's not affecting the traffic enough to be noticeable.
The 2 other machines that are also experiencing this problem are both Windows machines and as far as I know, there is no logging.of CPU temperature or usage.
The other thing these 3 devices have in common is that they are all on 10 Gbps ethernet, on TP-Link TL-SX105. It's actually a pair of these switches. Maybe they are failing in subtle ways, and causing clients to overheat ? One of them uses an Intel X550-T2, same as the pfSense box. And the other uses an Aquantia AQC-107. If I could reproduce the problem on-demand, I would move all 3 machines to a 1gig switch and see what happens. Unfortunately, it is intermittent.
You may be right that the old SSD can't be trusted, but I don't think there is strong evidence of that.. A SATA device cannot consume an extra 40 -60W, which is the increase I saw. IMO, that increased in wattage was caused by something else. Especially since multiple machines seem to be affected. That increase power consumption caused increased heat. I believe this is what's caused the motherboard SATA port to fail, and not the old SSD. Unfortunately, there is no history of temperature available to review. But I did notice by physically putting my hand on that case last night that it was abnormally hot, and CPU temp was 85C in BIOS whereas it is currently 42C under pfSense.
-
One more thing - pfSense refers to the thermal sensors module for AMD as being for K8, K10 and K11 . As far as I can tell, the K11 does not exist.
I ran CPUID on my other box based on the AMD 5700G APU, and it listed a family "F" and extended family "19h". Safe to say it's not supported by this driver.
I'm going to switch to None/ACPI and reboot per the instructions, and see if anything starts getting logged.
-
Good news, the "none" setting caused pfSense to finally start logging some temperature data. I should know next time when upcoming power consumption / heat spikes happens. But not sure what I'll be able to conclude.
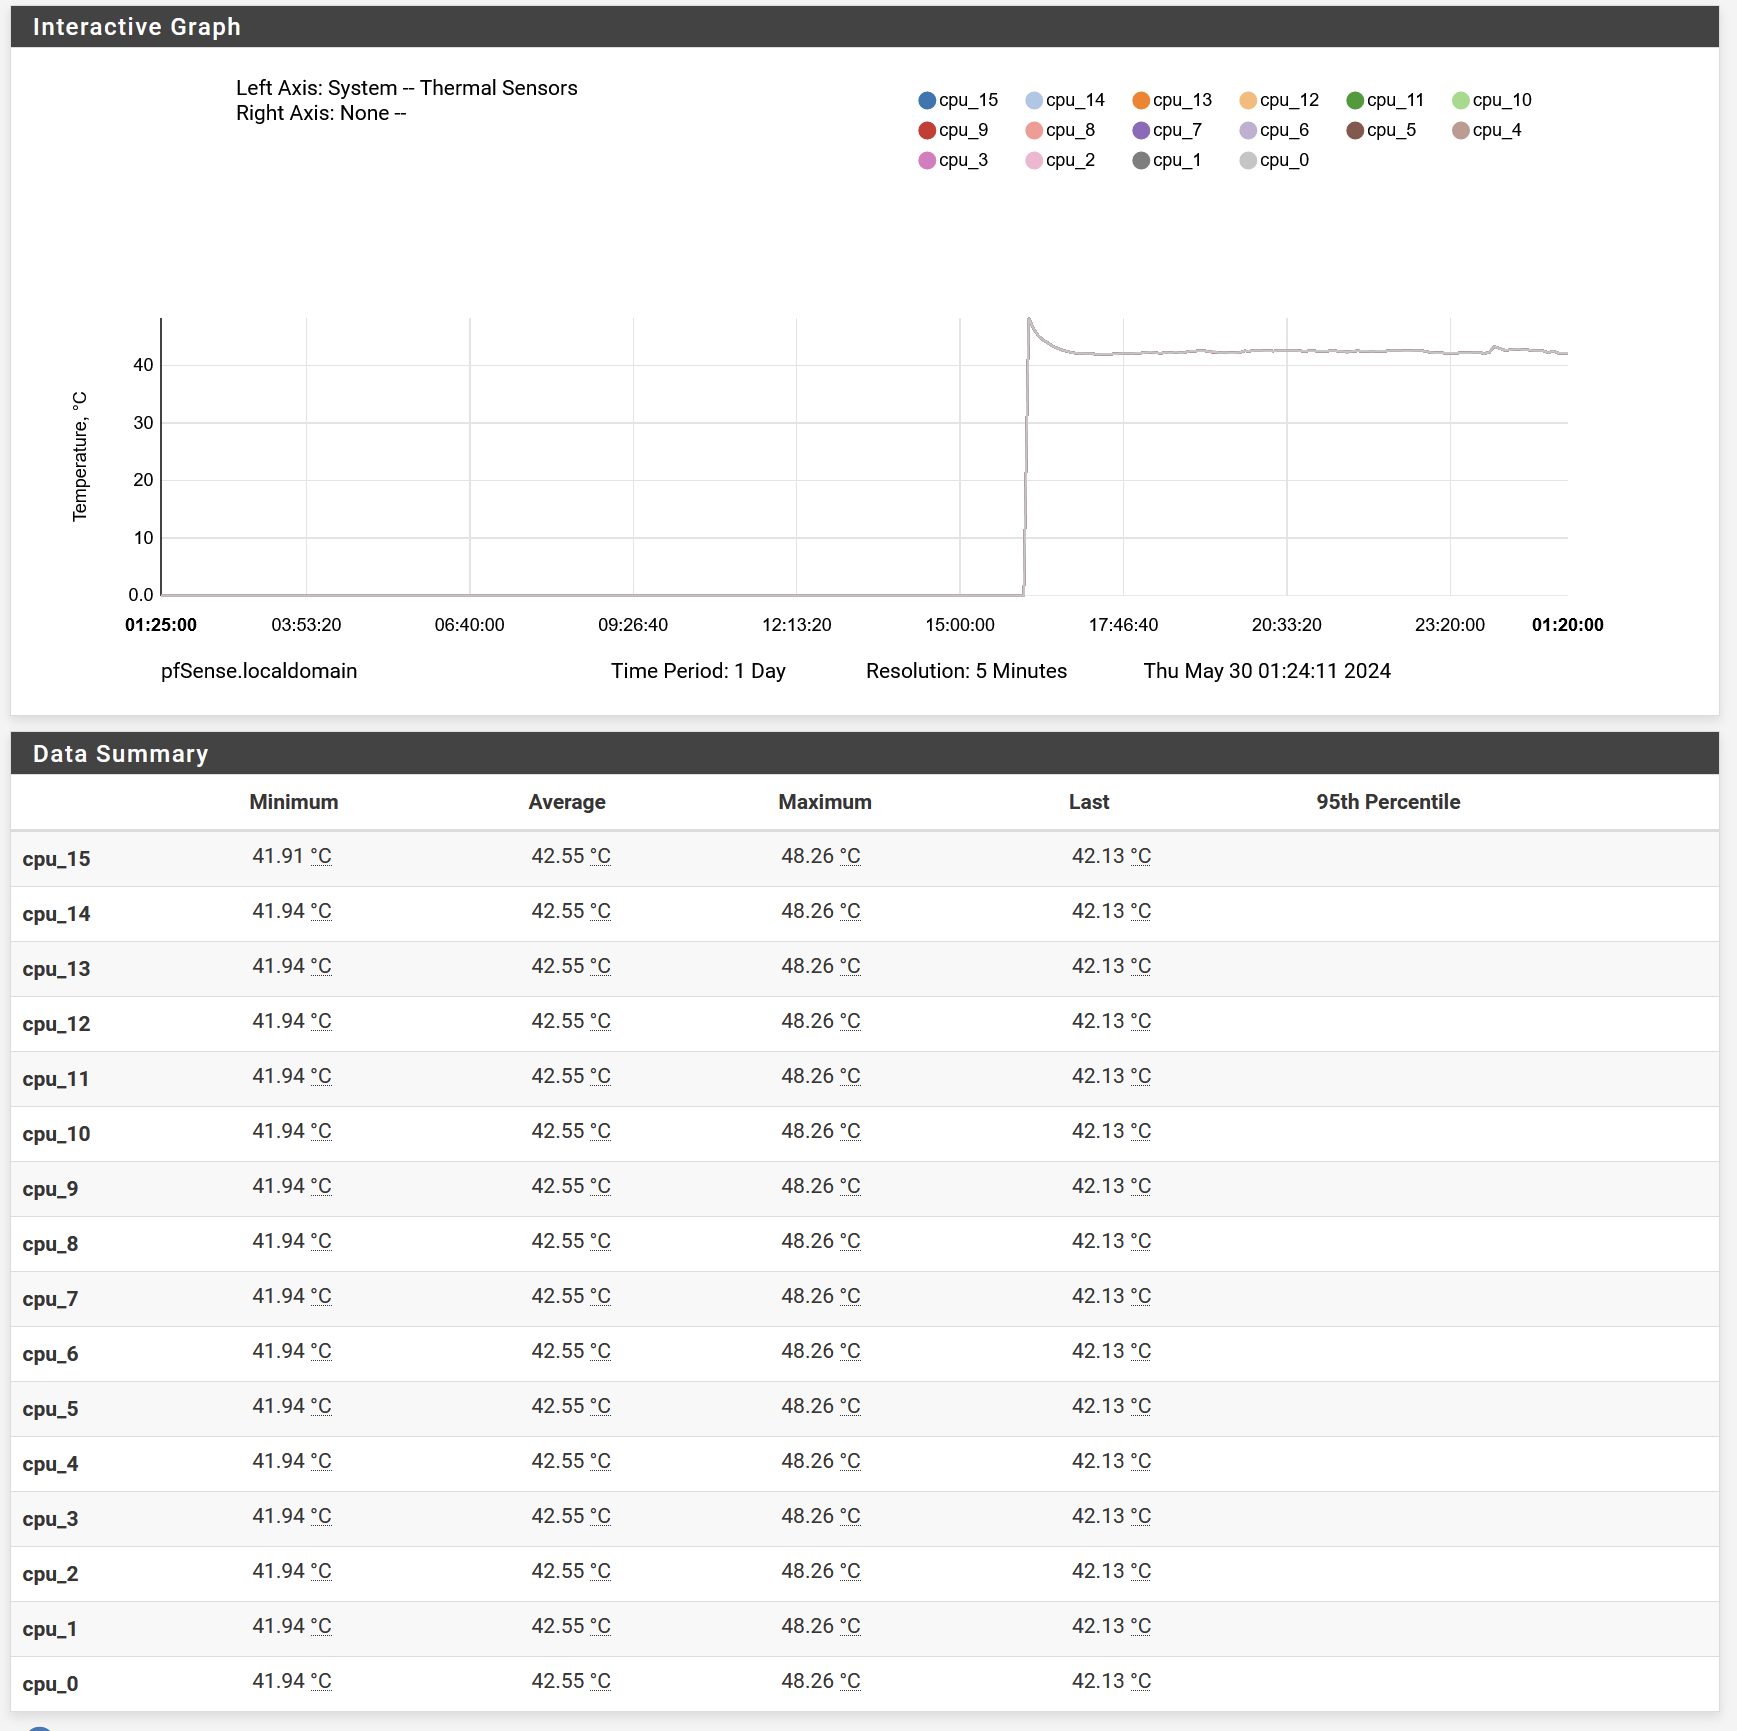
-
Hmm, interesting. If you set it back to amdtemp after boot does it still show nothing logged?
Does the Thermal Sensors widget on the dashboard also show zeros?
I wouldn't expect to see values for each core when relying on ACPI temperature readings.
-
@stephenw10 said in Recent unexplained poiwer consumption and temperature increases:
Hmm, interesting. If you set it back to amdtemp after boot does it still show nothing logged?
I would assume so - that is the setting I was using before. I don't want to reboot pfSense unless absolutely required. I have one really ill-behaved device that goes down, and stays down, when the router is rebooted. Have tried to get the manufacturer to fix it, to no avail. I just put a smartplug on it to avoid wearing down the power connector. It's still a manual intervention to power cycle it. Maybe I can come up with some Home Assistant automation to deal with it ... sigh.
Bad things happen to the wireless APs when the gateway goes down also, because they are meshed. The topology takes a while to reconstitute itself with the right mesh priorities. And that means some of the 91 Wifi devices might not connect, or connect to the wrong AP. Or connect to the right one, and have really poor performance if it's meshed with the wrong uplink. Wish I could put Ethernet throughout the house, but it's an impossibility.
Does the Thermal Sensors widget on the dashboard also show zeros?
I wasn't aware of that widget. It shows the per-core temperature, and those were showing as all zeroes in the status/monitoring screen when using amdtemp. Now they are all the same value as the temperature under "System operation".
I wouldn't expect to see values for each core when relying on ACPI temperature readings.
There are values - just all identical.
-
Could it be that your pfSense is downloading several data such as;
- snort or suricata rule sets
- clamav virus database
- SquidGuard Blacklists
- pfBlockerNG feeds
- CrowdSec lists
This could be also increesing the RAM usage and by site also a higher
CPU and SSD (temp) usage. -
@Dobby_
Thanks for your reply.I have not heard of most of these. I'm not using them.
As far as RAM usage, it hasn't budged :
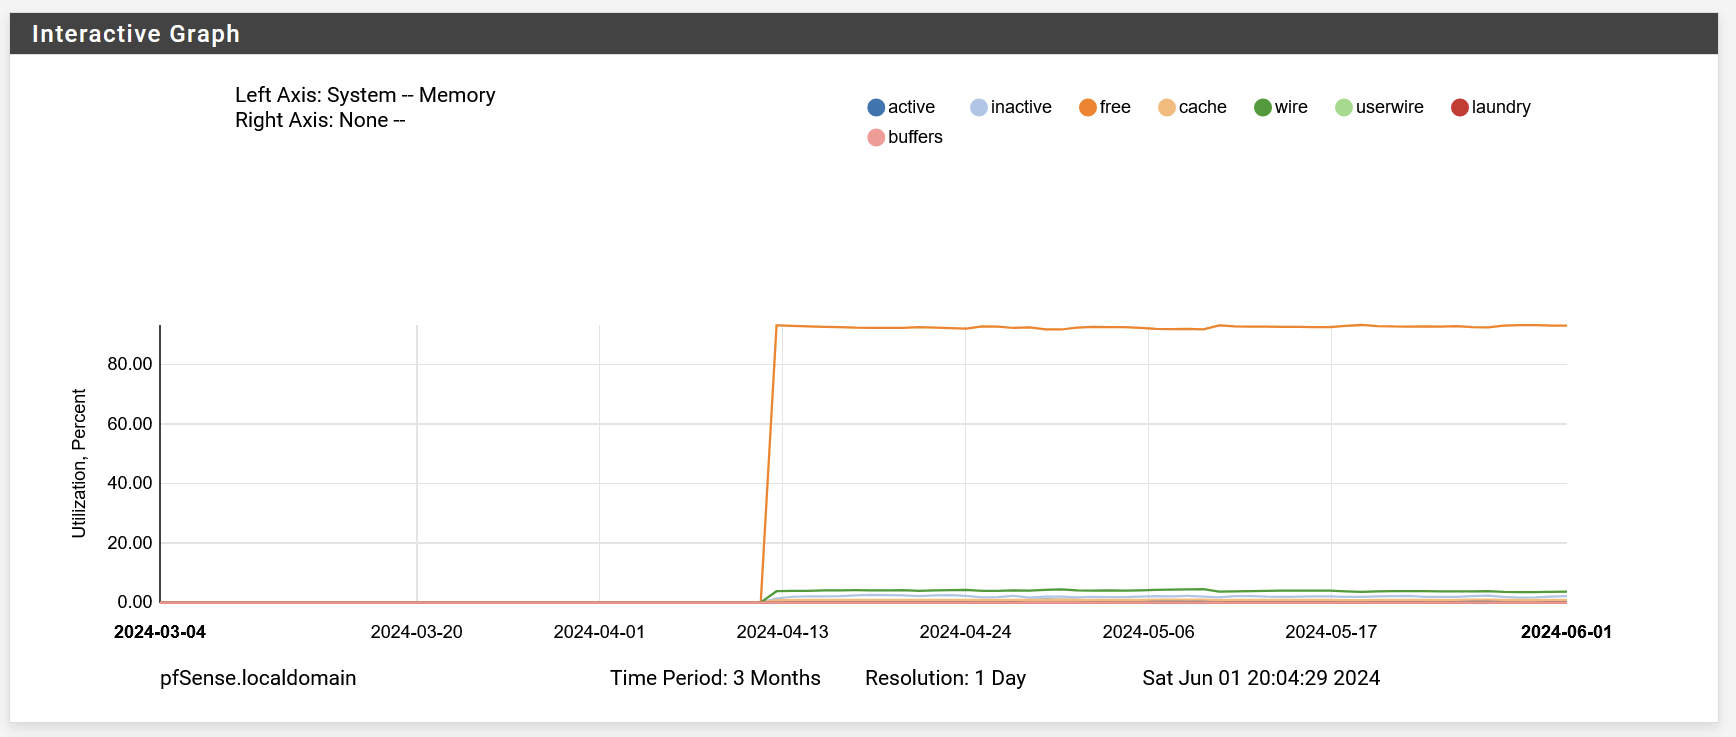
Neither has the CPU .
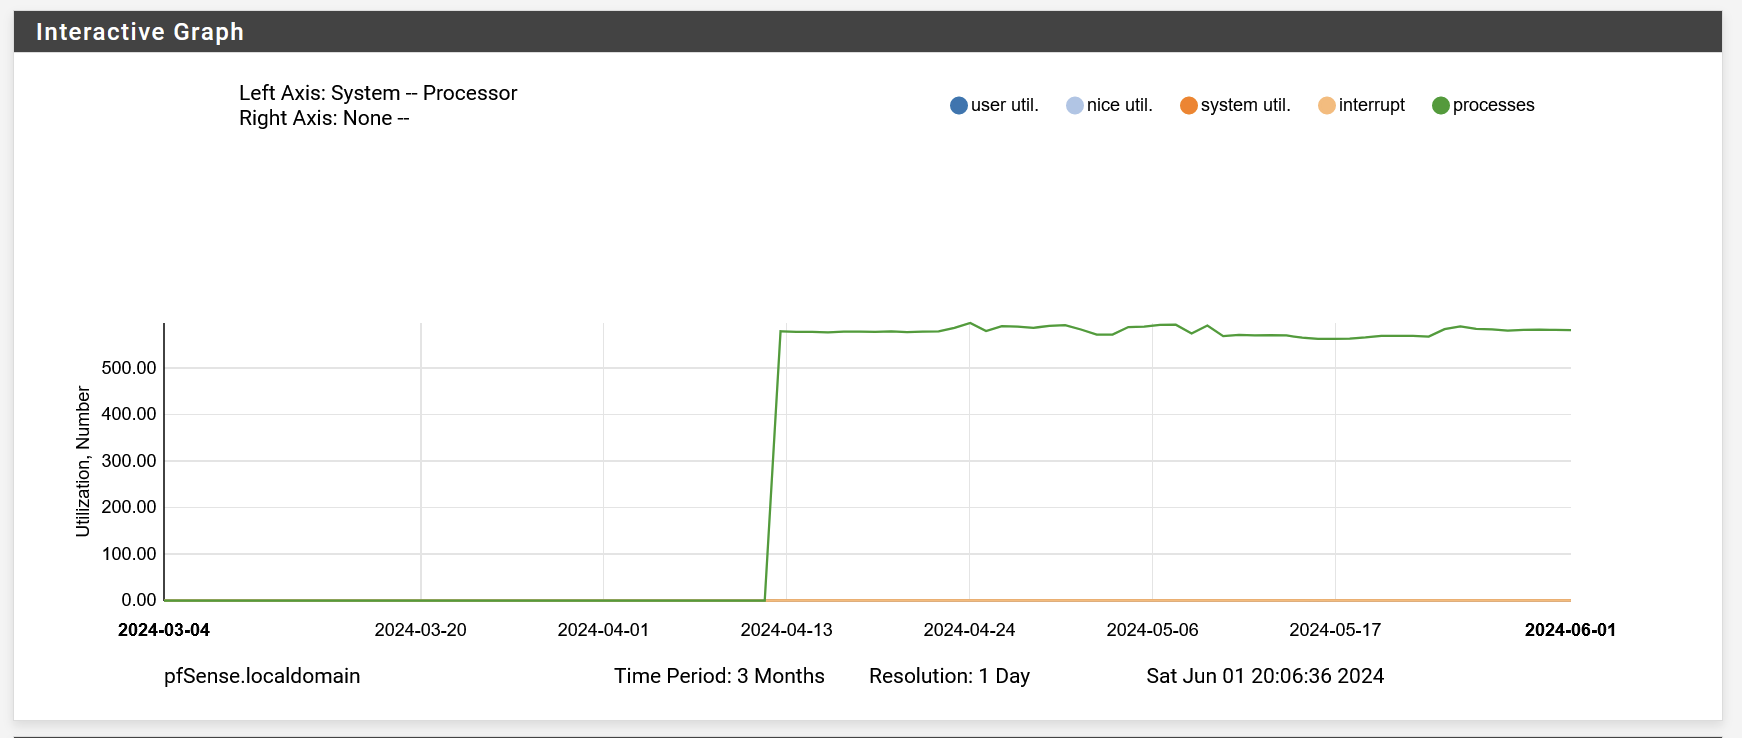
As I said in an earlier post, I looked at everything under monitoring that pfSense records, and there was nothing correlated with the increase in power consumption. The temperature is the one thing I would have expected to increase, but it wasn't previously recorded due to the problem with amdtemp. So far, I have not had a spike in temperature since I switched to ACPI. And no spike in power consumption as recorded in Home Assistant by my smartplug. It's only been a couple days since pfSense can record temp.
-
Hmm, surprising that CPU isn't supported. It's not that new.
-
@stephenw10 yeah. It's a FreeBSD issue. Amdtemp only supports families up to 17h. The 5700G is 19h.
