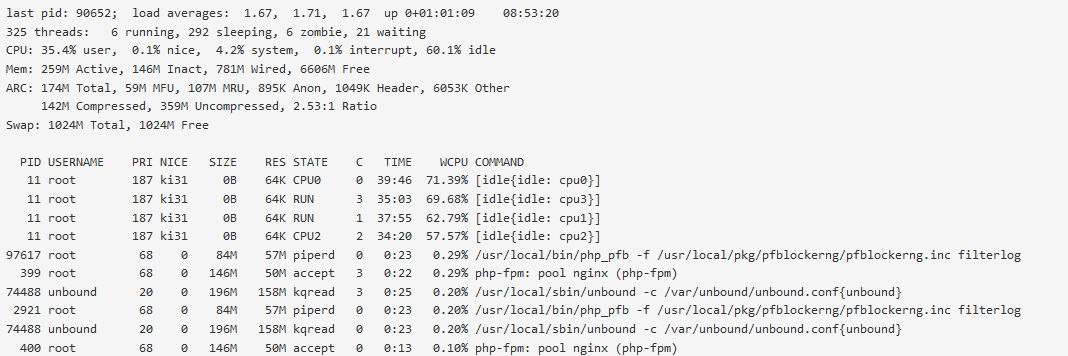
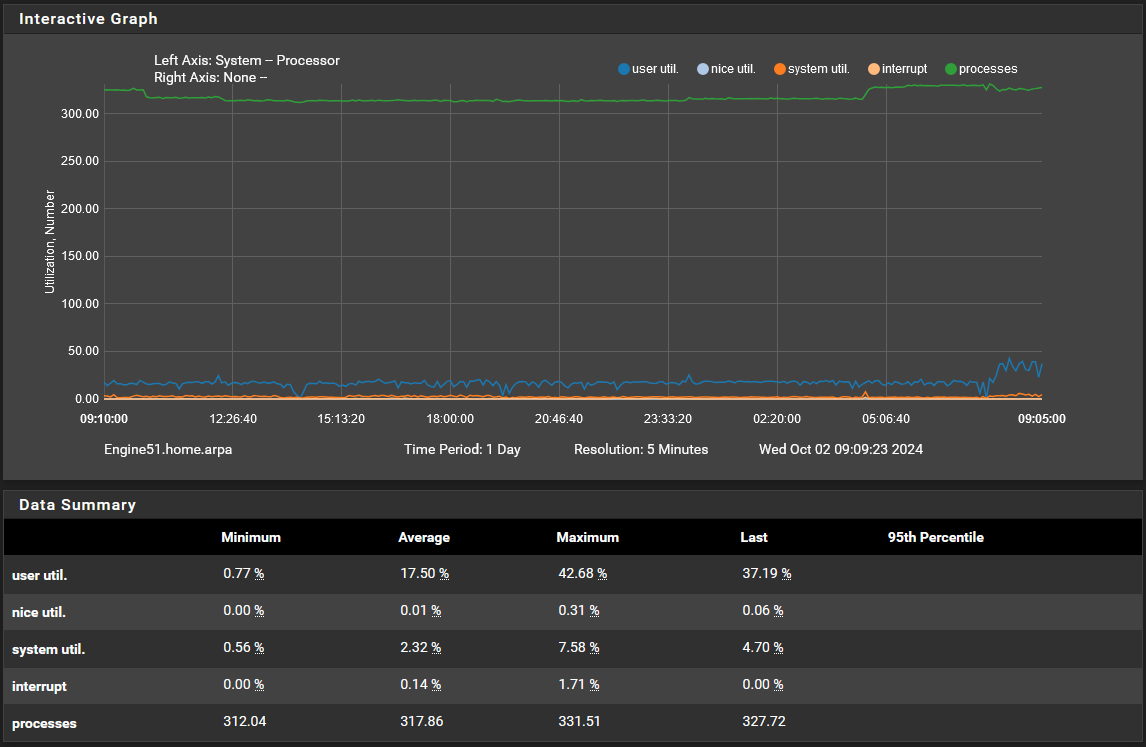
Puzzling CPU Usage
-
@jrey Understood, so if I understand you, having all within the list blocked is not a good idea but blocking some may be of value. How do you determine which would be good for blocking/rejecting, etc? Do you suggest I disable it and see what happens or would that not be a good idea as some would be wise to block?
-
@stephenw10 Yes I have the free version, dont think I would exceed the 50k lookups in a month but not sure yet how this actually works but I can see the details in my ipinfo dashboard. I setup the cache for the ASN entries for 12 hours which seems reasonable. Is there anything in PFS that shows what is being blocked/filtered by IPinfo? I also have maxmind setup and not sure what effect that is having on filtered/blocked requests. I havent logged into that in a while and will see if it has any stats on that.
-
@LPD7 said in Puzzling CPU Usage:
missing messages are gone
The ASN missing messages are gone - good.
that's part of the issue.
and now after the latest update in the latest pfblockerng.log file what do the pfSense Table Stats values look like?
What are you doing with the GeoIP list NAmerica ? (part 2 since I see you just asked more)
Correct changing the match (which is doing nothing) nothing to blocking and/or allowing is likely not needed in your case, but ..All inbound traffic to devices inside is blocked by default. So unless you are running a service (server) that you need the outside to have access to - that match rule is currently providing no value. Unless you have created a specific rule allowing access, just remove NAmerica from your selection. The others are fine because the have both inbound and outbound rules blocking rules associated. (you are blocking your users from going to addresses in those Geo locations)
@LPD7 said in Puzzling CPU Usage:
How do you determine which would be good for blocking/rejecting, etc?
Do you run any servers/services (a web server/mail server etc) inside that require access from the outside? if not then nothing. The inbound traffic is blocked by default.
if you are talking about outbound traffic that you want to block then, dnsbl, specific ASN (or individual address - in an Alias and block them that way.. define (or tell us more specifically what you are trying to block)
Don't confuse the GeoIP with the ASN blocks the rules(lists) are normally different.
-
@LPD7 said in Puzzling CPU Usage:
I setup the cache for the ASN entries for 12 hours which seems reasonable.
one hour is all that is required in order to allow the downloads to work. Nothing else changes.
This is a change where that selection should actually be just Enabled or Disable with the newest pfb version.Under previous version of pfb the ASN data would download whenever your cron job ran, even if this "ASN Reporting" was disabled.
Now the ASN data only downloads once per day (on its own scheduled time, that is not related to your specific cron settings for updating lists/alias) . . Asking for specific ASN data isn't going to change anything with regards to what is on the list/alias (rule). Any list that contains ASN feeds really only needs to run once per day. More often is just a waste of time/resources (but it is all local to the device) so the impact is minimal. So if you have cron set to hourly only 1 in 24 hours will actually/potentially have new data.
@LPD7 said in Puzzling CPU Usage:
Is there anything in PFS that shows what is being blocked/filtered by IPinfo?
What list/alias and associated rules do you have that are using ASN feed data?
This is an ASN exclusive list that I run and regardless of what the cron settings are (how often the process runs (default is one hour), this list only updates once per day. the other 23 hours it is just ignored.

-
@jrey Hi Jrey the stats from the last update are:
pfSense Table Stats
table-entries hard limit 900000
Table Usage Count 602700UPDATE PROCESS ENDED [ 10/17/24 00:02:09 ]**
As for the GeoIP N America I have no clue yet what I am going to do still trying to absorb the details. Looking at Firewall>pfBlockerNG>IP>GeoIP>North America I see that I have most of the IPv4 countries selected and no IPv6. Am I recalling correctly that you suggest that I disable N America and will not see any difference in ads, etc and that HW resources will go down? Yes if Match Both does nothing other than logging then disabling seems appropriate.
I do not have any servers running that require exposure to the net. If I want to access my network and its resources I do so form the VPN.
I need to know more about GeoIP and ASN differences. Most if not all of what I have setup is by default except for the feeds I added. I recall ASN from my networking days so have an understanding about autonomous networks but how they operate within PFS is still a mystery. I am trying to hunt down the actual lists/feeds that use ASNs.
I disabled N America to see what happens.
-
@LPD7 said in Puzzling CPU Usage:
stats from the last update are:
was that update from before or after you disabled NAmerica ?
I do not have any servers running that require exposure to the net.
okay. So then you are primarily concerned with blockout what you users get to visit.
(GeoIP, DNSBL, and perhaps custom stuff (likely blocking access to specific organization)If I want to access my network and its resources I do so form the VPN.
This is where a rule / ASN may narrow the number of bogus connection attempts ..
If you know for example that when you are connecting from the same block of IP's all the time. (then you could rule it to only allow connections to the VPN from that set)
This works for me because of known external connection sources. (ie they are always from the same group of source addresses.) so that ASN is the only group of addresses that can even get to the port.need to know more about GeoIP and ASN differences.
Basically the GeoIP data (maxmind in your case) is tied to the specific rules (blocking both inbound and outbound traffic for those locations)
The ASN and other lists (alias) work the same way but allow you to focus in on a specific block of IP addresses specifically for an organization.
You can also create your own list (alias) of just IP addresses.Rules order
Floating rules, then the interface rules (WAN / LAN) depending on which interface the traffic is entering.
one each tab rules always process in the order (top -> bottom)If you really want get creative with your rules, you will find the using "Alias" definitions gives you far more control
without saying exactly what mine are (the top one is the PRI1 collection) it will always float to the top of rules so it is the only one that is a "Deny" not an "Alias"
(with an Alias list you have to build your own rule, but then you can also place them in the order you want on the rules interface) and you will notice that in my case some are specifically Permit types.
(from the IP tab)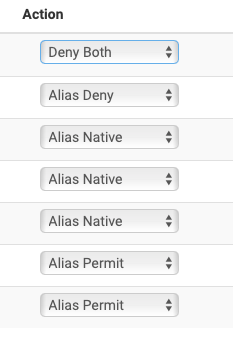
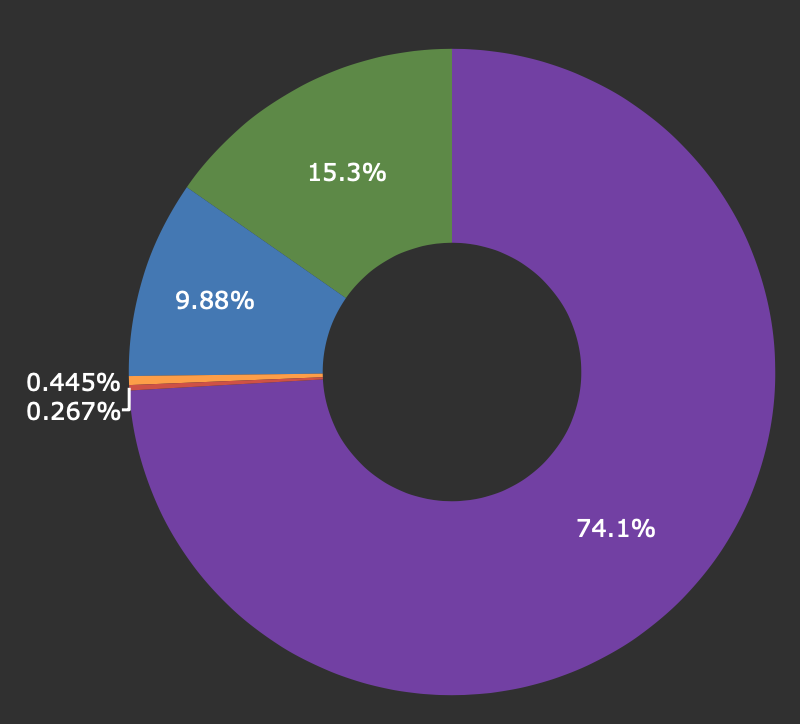
DNSBL is different this is your black hole for DNS lookup
start with this one StevenBlack_ADsin my case that gets me 74% of what I want to block.
-
@jrey I dont think the stats were after disabling N America, I did that while I was responding to your comment in the thread. This is what the status looks like now, seems greatly reduced.
pfSense Table Stats
table-entries hard limit 900000
Table Usage Count 371165
UPDATE PROCESS ENDED [ 10/18/24 12:02:11 ]Yes since I do not have any servers pointing externally I am mainly concerned with blocking unwanted content (ads, malware, etc) from getting into the network. As far as blocking sites where users can visit or even limiting the times of access that has been a desire of mine and was something I was working on some time ago but "stephenw10" who was helping pretty much said that its a lost cause with the advent of encrypted URLs and the new SSL and TLS protocols.
I could do a man in the middle scenario using Squid but it is cumbersome and risky and would require a lot of attention so I have abandoned the idea for now and may reconsider using a 3rd party service but have made no plans.
While on the subject, sort of, I have been spending time setting up rules, aliases and schedules to limit time my kids could access the internet and have had a heck of a time getting it to work despite using Netgate documentation. It seems I have it setup correctly but why its not shutting down internet at the scheduled times is baffling but that will be another topic for discussion.
Funny you mention rules and aliases and IP lists. As noted above I am trying to use these to schedule internet access for the kids and as far as IP lists I created my own to block TikTok and did a search for all TikTok associated IPs and built lists but yet access was not impacted. I wonder if ASNs would be a better option for TikTiok and other sites I want to ban or limit?
So do rules and how they are applied follow the same premise as ACLs? Meaning that when there is a match that no further lookup is done or that the order in which the rule is listed impacts other rules?
This has been an area where I didnt get really involved since if I broke something I had to fix it. I know I can do a backup of a working config and use that as a restore point but as fastidious as I am I do tend to take shortcuts and not do backups as often as I should.
I looked for an add on for PFS that would do auto backups and I saw one in package manager but I went to the link to see if it had details about how it worked to see if it would be a fit but it had no user manual or info so I moved on.
Yes I have to get more in tune with all the rules, aliases, order, etc. I dive in now and again to get familiar but soon get lost and forget what the heck I went in for. Eventually it will sink in, I may spin up my backup box and use it as a lab device so if I do break something its not an issue.
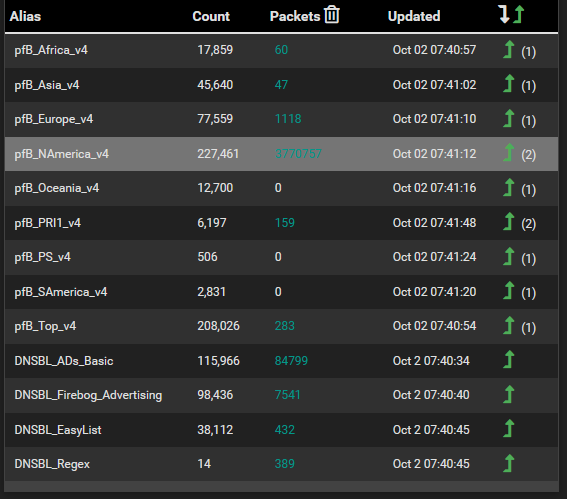
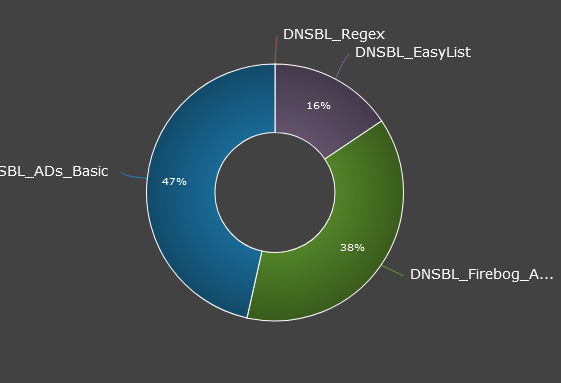
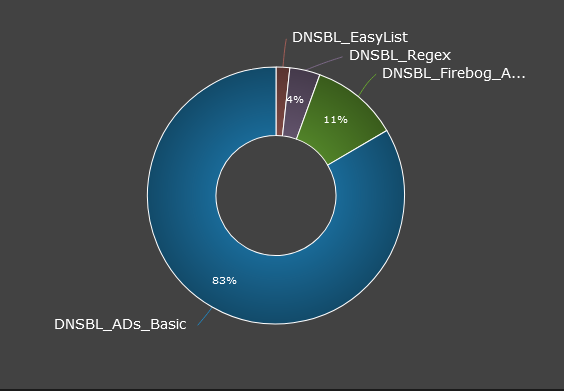
I use StevenBlack_ADs feed, and I like the graph you posted, I dont use this but can see the value as it shows what lists/feeds are doing the most work and catching the bad stuff. I am not sure which would be a good source to review in my case so I have included a couple below just to give an idea what I have going on here.
Seems like if I am reading this correctly that StevensBlack_ADs feed is doing the bulk of the work.
Top Group Count:
Top Blocked Group:
Top Feed:
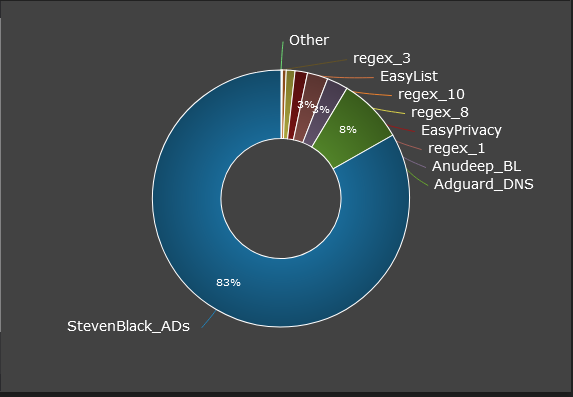
Man as I go through this the more questions pop up, I have had this installed for 2+ years and still feel like I am in a foreign land. I love PFS but it really makes you stretch those neurons.
Thanks for taking the time to educate me.
-
@LPD7 said in Puzzling CPU Usage:
Table Usage Count 371165
Better -- so how is the CPU usage now? any improvement? (perhaps especially after a reboot how long does it stay spiked now?)
From the 601095 down to 371165 is a huge amount of extra work off the table, plus as I mentioned before the bottom number works best if it is less than half of the top number. 601095 was not / 371165 is
Second, with the NAmerica Match rule out of the mix, the system is no longer trying to "Match" every IP in and out against that "doing nothing" list, before moving to something that may or may not block based on subsequent rules.
rules then follow in order they are listed (for the interface) until a match is found.
Before we go on to some of the other topics you raise, operational pause while we now try to address the original issue of "CPU issue"
would be helpful to know at this point where we are, and;
on the pfBlockerNG / IP tab
what settings do you have for
De-Deplication
CIDR Aggregation
Suppressionon the pfBlockerNG / DNSBL tab
what settings do you have for
DNSBL mode
Wildcard TLD
..
(if you want just a screen capture of each of these setting areas would be helpful) -
@jrey CPU usage is nominal as of right now it is at 3% it spikes to 15% +/- occasionally but doesnt last long. Mem is at 28% and I thought that would have gone down after removing N America.
The stats are:
pfSense Table Stats
table-entries hard limit 900000
Table Usage Count 370772
UPDATE PROCESS ENDED [ 10/19/24 12:01:32 ]They seem stable.
As for pfBlockerNG / DNSBL tab:


On the pfBlockerNG / IP tab:


-
@LPD7 said in Puzzling CPU Usage:
CPU usage is nominal as of right now it is at 3% it spikes to 15% +/- occasionally but doesnt last long
So then it seems like the elevated CPU usage originally observed is gone --
the spikes as observed on the dashboard are normal. Remember it is only a snapshot of that point in time when the dashboard refreshes the display -- I wouldn't be concerned with these levels of CPU usage (especially what it should when the dashboard first loads)Memory usage is a completely different issue, and can/will depend on so many variables. Here I wouldn't worry to much about that sitting (averaging) around 28% - utilizing memory for cache/buffers and such isn't really a bad thing.
-
@jrey Thanks for your input. Yes the unusually high CPU usage is now gone thankfully. I see pfb has an update XX_19, do you recommend it? Since last time when I had an issue with an update I am not jumping on the bandwagon right away.
-
@LPD7 said in Puzzling CPU Usage:
see pfb has an update XX_19
you mean _20 right ?
point is - this is -devel version and things are changing
should be no harm going from 18 -> 20 or whatever it is showing for you - if you are really concerned about jumping in too soon, then don't install -devel at all.
I still want to cycle back and address some of your other questions from a previous post but haven't time the past couple of days.
-
@jrey No problem, I appreciate your help, if you can provide some insight into my rules issue when you have the time that would be most welcome. As for -devel, I was considering moving over to the standard version but had questions about how that would impact current config. If "keep settings" is checked will those be added once the standard version is installed? I just did a config backup lest I forget before making the leap.
-
just stay on -devel for now --- but go ahead and do the update to _20
I was making that previous "warning" simply about being at a safe / stable place rather than on the rapidly changing leading edge when trying to troubleshoot a issue.
-
Just FYI - I've been pre-testing many of the releases on my test system for a while now.
But this morning I said _20 is stable enough that I would trust it on my production box and so installed it. This is something I had not noticed on the development box because it does slightly different things and has a slightly different footprint with regards to memory etc, and but has really leading edge code on it (often ahead of the repo)
However in going from _10 to _20 and no other settings changed, I do not notice see any significant change in CPU usage, but I do notice that more memory is being allocated to cache, thus reducing the "free") I am certainly would not be concerned about this.
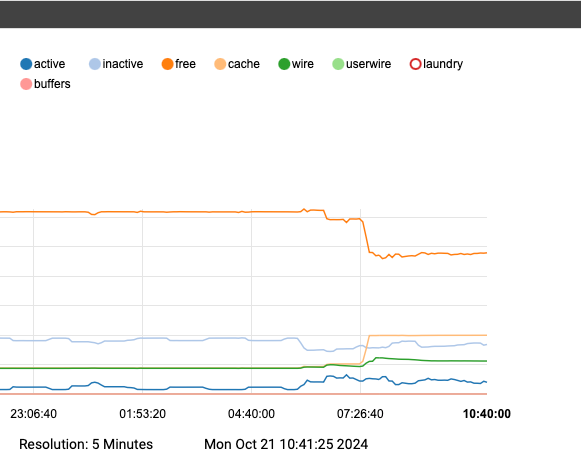
Operationally everything is exactly as expected, so I expect that these levels will be "flat" and form the new baseline going forward
so what was perviously flat lined at 62% free now appears to be around 47%
with cache has gong from 9% to about 20%There is a reason and is documented on other threads and other notes.(effectively that cache sizes have been increased). So this is likely also all and why you are seeing "more memory usage" -- Certainly no concern here.
-
@jrey Yes v_20, I will do that. Thx.
-
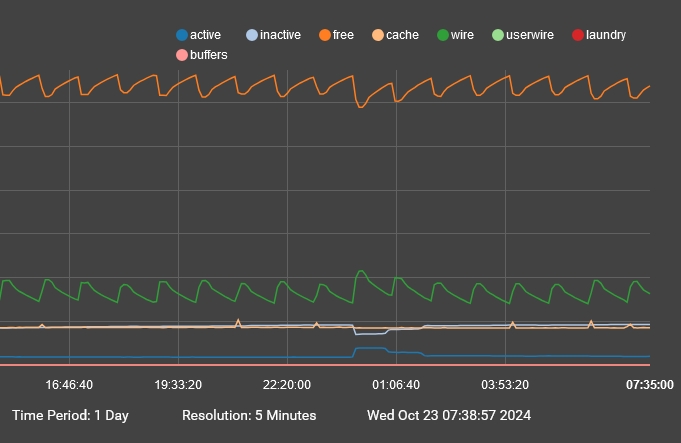
@jrey Thanks for bringing this up, I was just monitoring the dashboard and not looking at the system monitor. I have never seen this saw tooth pattern before not sure what it means am trying to connect the dots as I expand my knowledge. I will maintain business as usual and keep an eye on it. Let me know if you have any concerns. I need to think about spinning up my other box for testing.
-
Interesting -- that's a little different than what I am chasing and as I recall you don't use TLD (wildcard blocking) it was not enabled in a previous screen capture.
You haven't changed that setting have you? (and not suggesting you do at this point)Can you run a graph with custom time frame for a 1 day period and same resolution from before you updated from what ever prior version you had to _20 ?
(edit) and what you are seeing there might not be related to pfb at all..
Thanks
-
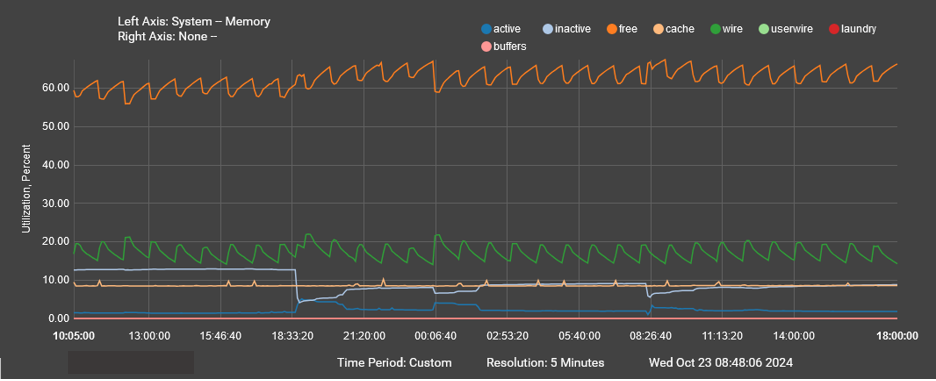
@jrey I looked at the logs as I dont know the exact time I did the update, best guess based on the inactive state it was at/around the 18:40 mark. If reading correctly seems like that saw tooth pattern was existing prior. I did a custom date just to make sure I caught the info, its a 2.5 day time frame.
-
@jrey I have been diving into the graph which has been interesting. One thing I noticed is that "wire" in green is defined as "Memory allocated by the kernel, including the kernel itself, which cannot be paged/swapped and cannot be freed until explicitly released." Given the continuous high and low states on the wire would this manifest in increased memory utilization?
