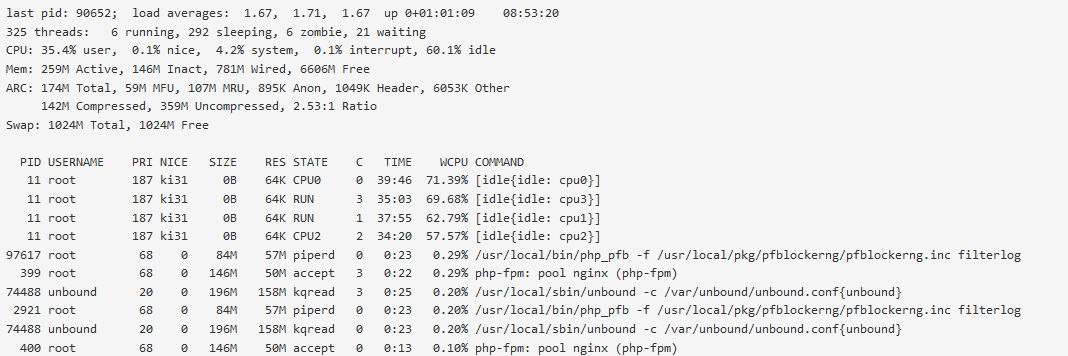
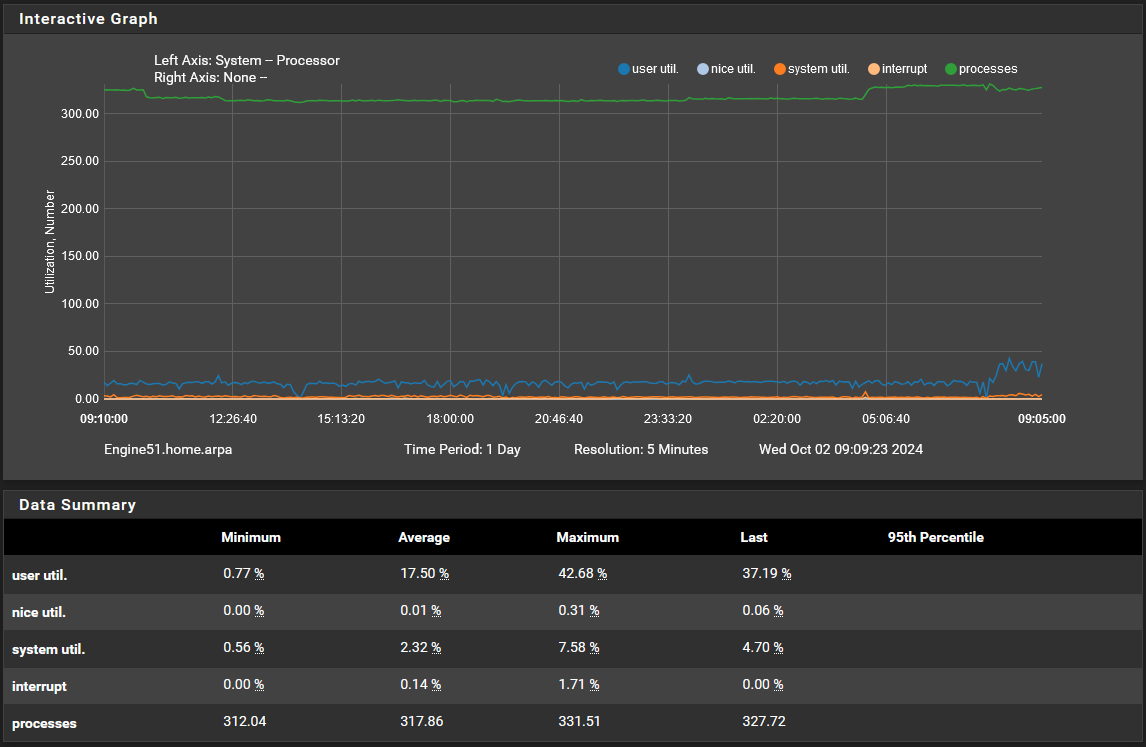
Puzzling CPU Usage
-
@jrey Thanks for your input. Yes the unusually high CPU usage is now gone thankfully. I see pfb has an update XX_19, do you recommend it? Since last time when I had an issue with an update I am not jumping on the bandwagon right away.
-
@LPD7 said in Puzzling CPU Usage:
see pfb has an update XX_19
you mean _20 right ?
point is - this is -devel version and things are changing
should be no harm going from 18 -> 20 or whatever it is showing for you - if you are really concerned about jumping in too soon, then don't install -devel at all.
I still want to cycle back and address some of your other questions from a previous post but haven't time the past couple of days.
-
@jrey No problem, I appreciate your help, if you can provide some insight into my rules issue when you have the time that would be most welcome. As for -devel, I was considering moving over to the standard version but had questions about how that would impact current config. If "keep settings" is checked will those be added once the standard version is installed? I just did a config backup lest I forget before making the leap.
-
just stay on -devel for now --- but go ahead and do the update to _20
I was making that previous "warning" simply about being at a safe / stable place rather than on the rapidly changing leading edge when trying to troubleshoot a issue.
-
Just FYI - I've been pre-testing many of the releases on my test system for a while now.
But this morning I said _20 is stable enough that I would trust it on my production box and so installed it. This is something I had not noticed on the development box because it does slightly different things and has a slightly different footprint with regards to memory etc, and but has really leading edge code on it (often ahead of the repo)
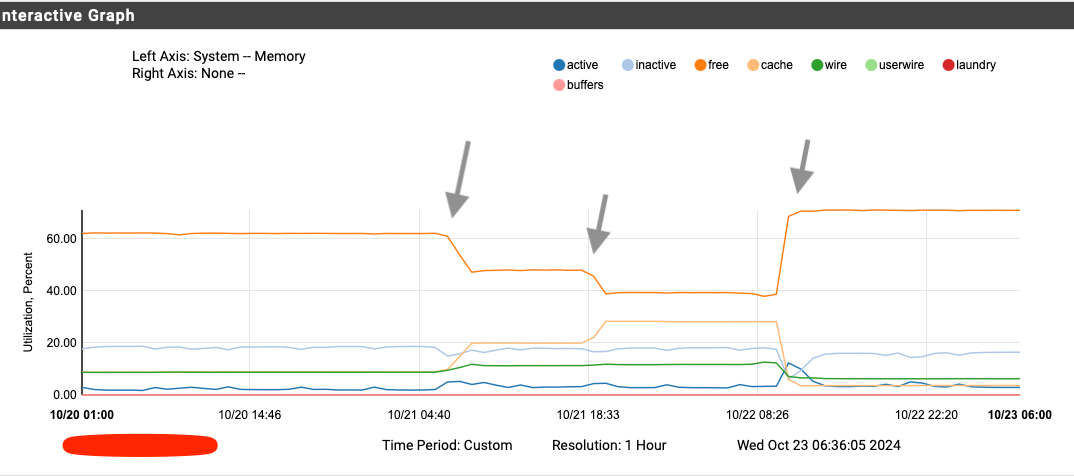
However in going from _10 to _20 and no other settings changed, I do not notice see any significant change in CPU usage, but I do notice that more memory is being allocated to cache, thus reducing the "free") I am certainly would not be concerned about this.
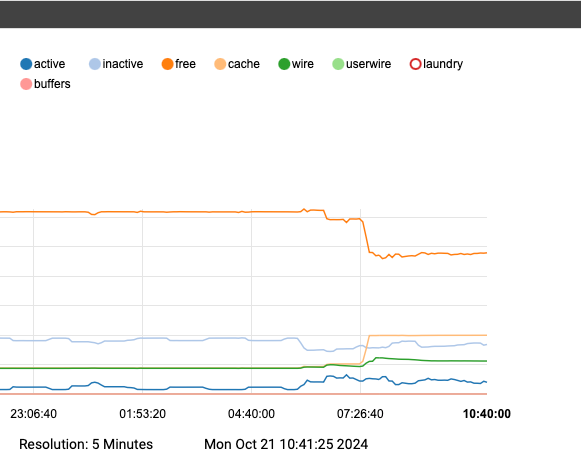
Operationally everything is exactly as expected, so I expect that these levels will be "flat" and form the new baseline going forward
so what was perviously flat lined at 62% free now appears to be around 47%
with cache has gong from 9% to about 20%There is a reason and is documented on other threads and other notes.(effectively that cache sizes have been increased). So this is likely also all and why you are seeing "more memory usage" -- Certainly no concern here.
-
@jrey Yes v_20, I will do that. Thx.
-
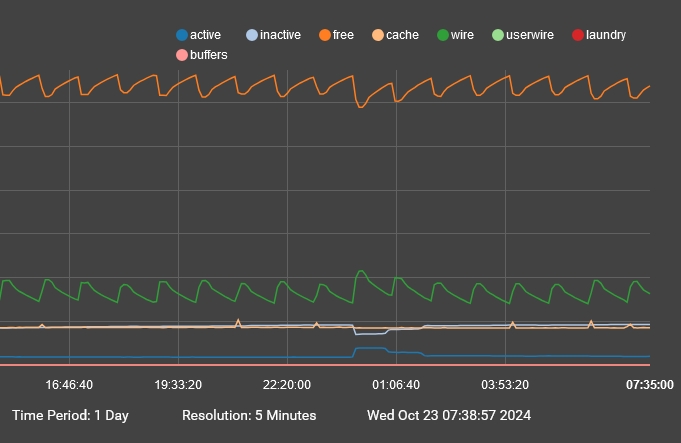
@jrey Thanks for bringing this up, I was just monitoring the dashboard and not looking at the system monitor. I have never seen this saw tooth pattern before not sure what it means am trying to connect the dots as I expand my knowledge. I will maintain business as usual and keep an eye on it. Let me know if you have any concerns. I need to think about spinning up my other box for testing.
-
Interesting -- that's a little different than what I am chasing and as I recall you don't use TLD (wildcard blocking) it was not enabled in a previous screen capture.
You haven't changed that setting have you? (and not suggesting you do at this point)Can you run a graph with custom time frame for a 1 day period and same resolution from before you updated from what ever prior version you had to _20 ?
(edit) and what you are seeing there might not be related to pfb at all..
Thanks
-
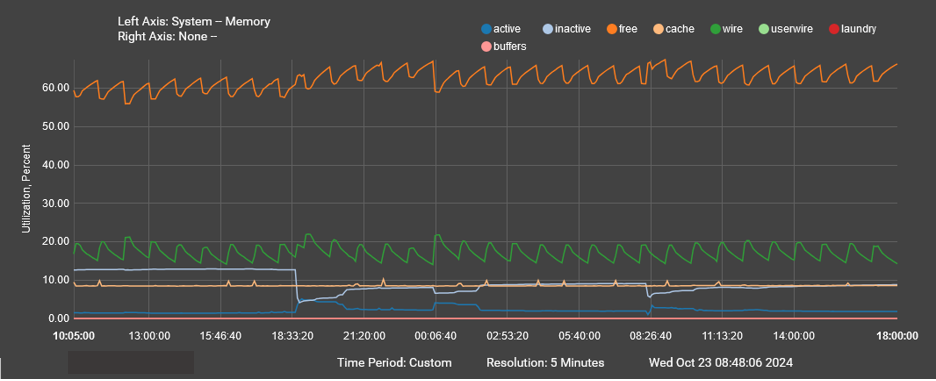
@jrey I looked at the logs as I dont know the exact time I did the update, best guess based on the inactive state it was at/around the 18:40 mark. If reading correctly seems like that saw tooth pattern was existing prior. I did a custom date just to make sure I caught the info, its a 2.5 day time frame.
-
@jrey I have been diving into the graph which has been interesting. One thing I noticed is that "wire" in green is defined as "Memory allocated by the kernel, including the kernel itself, which cannot be paged/swapped and cannot be freed until explicitly released." Given the continuous high and low states on the wire would this manifest in increased memory utilization?
-
@LPD7 said in Puzzling CPU Usage:
Given the continuous high and low states on the wire would this manifest in increased memory utilization?
Look at the top line (orange) at the same time (that's free) same zigzag here but overall it is a flat line around 60% Free for you
Depending on how long the system has been around, you might be able to look over a much longer time frame (3 months or 1 year for example, they are presets)
I typically run average 67% free (check the table under the graph) but every system will be different depending on configuration and applications --
Memory is always doing "stuff" but there is nothing here that should be overly concerning
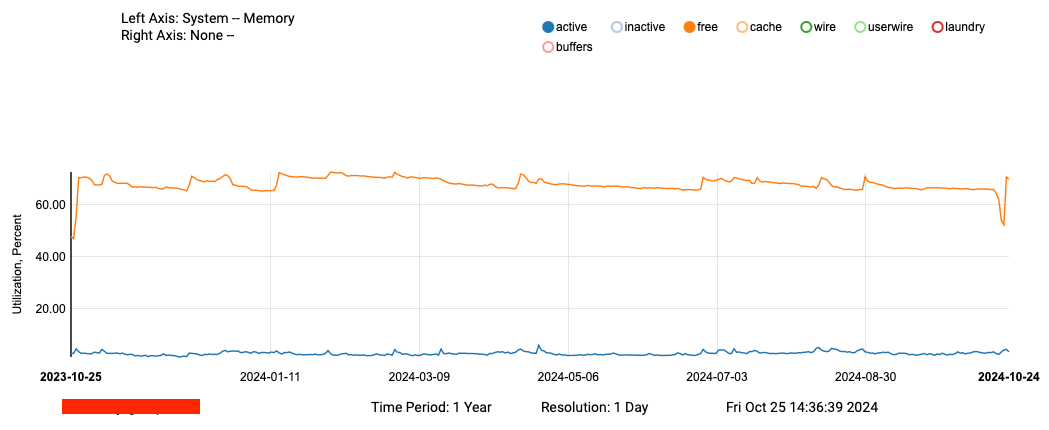
You see that little down blip on the right - that actually looks like this zoomed in ..
Nothing really to see here -
-
@jrey Thanks so much for your help and input it is very useful info to have to be able to put this into perspective. Sorry delay in getting back to you, was also working on a rules issue which seems to now be resolved. I appreciate your time and patience on this. I hope all that we covered will be of use to others in the future. Thanks again and have a great week.
