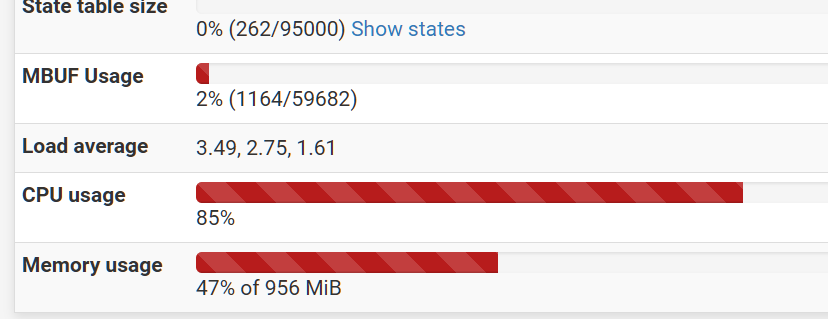
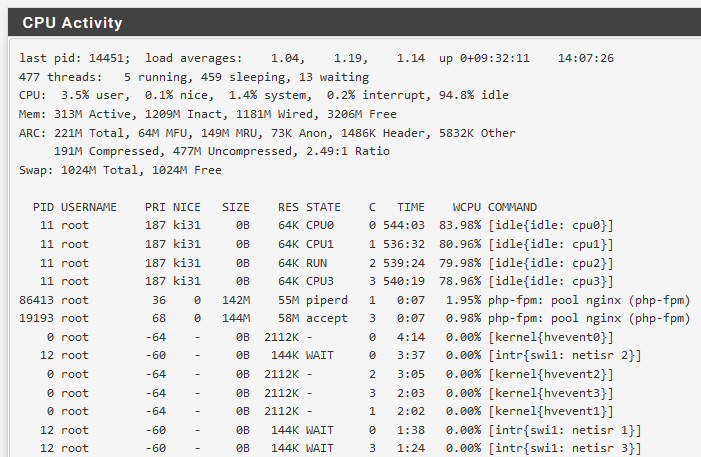
CPU load on 1100
-
There's no Wireguard widget on my 1100's dashboard, yet:

Dashboard has these widgets:
- Netgate Services And Support
- Service Status
- Disks
- ZDS
- System Information
- Gateways
- Interfaces
- UPS Summary
- pfBlockerNG
- Firewal Logs
-
@pfsjap It's possible other widgets are affecting it too. Remove all of them and re-add them one at a time to narrow down which one is doing it (if any).
-
R rpotter28 referenced this topic on
-
I also see a higher CPU-Load (25% all the time) on my Hyper-V-VM. Doesn't seem to be related to the widgets much.

I run WireGuard a lot.
-
Hmm, odd. That shows only ~5% use. But also a 1.04 load average....
Are you able to catch anything else running and using CPU cycles?
-
24.11-RC now: still high load in dashboard. Looks the same to me in terms of this issue.
I will see if things change, the upgrade was only 15 minutes ago.EDIT: CPU load goes down now (in dashboard). I "minimized" all widgets, didn't have another idea ... load around 2.3 right now
-
The interval can be increased in the widget config. If you don't want the increased usage while on the dashboard, set them to refresh each e.g. 10s or remove them.
-
If you just run
top -HaSPat the CLI without the webgui open are you still seeing increased CPU usage? -
No, the load is at 0.2 - 0.4 when I do that. The top-command shows no high php-fpm activity now, sure, when no webgui is used.
Didn't play with the widget intervals yet ... I'd prefer that these values come with a working default ;-) / sure, can test that laterEDIT: load went down while I typed this. now 0.04 for example: nice
EDIT 2: disabled all widgets except "System Information". CPU load now showing ~22%. load in top around 1.0
-
@sgw What would you consider to be a working default and for which widgets? Would the defaults be different when additional widgets are added (i.e. when there's increased processing requirements)? Would that be considered the same for all hardware?
-
@marcosm I didn't want to offend anybody. Thanks for your work ...
-
@sgw No worries. They are valid concerns and questions :)
-
@marcosm ok, great.
I don't know if I can tell which defaults to use etc / I can try to enable some of the widgets and see what happens, then try to adjust things.
I assume I had too many widgets enabled für the netgate 1100 ... maybe the base load increased over time and with newer releases? Would it help to configure php-fpm somehow (more memory, more threads or something)?
Do the widgets get refreshed also when they are minimized?
-
@sgw Part of the issue before was that the refresh interval would increase along with the number of widgets. Hence the interval would essentially never be accurate - it'd be much higher which results in the decreased CPU load.
Since the resource usage is very hardware-dependent, it seems best to leave it up to the user to determine what's best in their situation. I think the current default behavior is acceptable with the default number of widgets. The firewall isn't really meant to be something you'd stay logged into indefinitely anyway; there are likely plenty of other situations where some GUI action results in a noticeable increase in resource usage.
-
@sgw Note if one leaves the dashboard open, that will also generate a continuous stream of log entries/disk writes because pfSense logs web server requests and each widget update is one.
-
If you want to try the previous widget refresh behavior, which was also problematic but in different ways, you can install the System Patches package and then create an entry for
ee615d9d982e94fdb9f5a88207f53990e6e86c1dand try reverting that change. Be sure to refresh the dashboard after (Ctrl+F5 or shift+reload ideally). -
@SteveITS Good to know, I have to tell this to a specific admin at a customer. He has the dashboard open for longer periods of time sometimes ...
-
M marcosm referenced this topic on
-
M marcosm referenced this topic on
-
T tman222 referenced this topic on
-
S SteveITS referenced this topic on
-
T tve referenced this topic on
-
T terryzb referenced this topic on
-
M MacUsers referenced this topic on
-
S SteveITS referenced this topic on
-
S SteveITS referenced this topic on
-
S SteveITS referenced this topic on