24.03 -> 24.11 concerns
-
device 2100:
I guess the update was successful by all logging it would seem soThe concern is the dashboard. Painfully slow, and pegs the CPU at 100% (top 4 or 5 items in a "top" on the console. (and other pages after you eventually get enough response to navigate there and they go away)
Trying to narrow down if a specific widget is to blame. It's painful slow even removing widgets.second concern is actually the firewall logs widget (which I have set for 10 pass events only on the WAN)
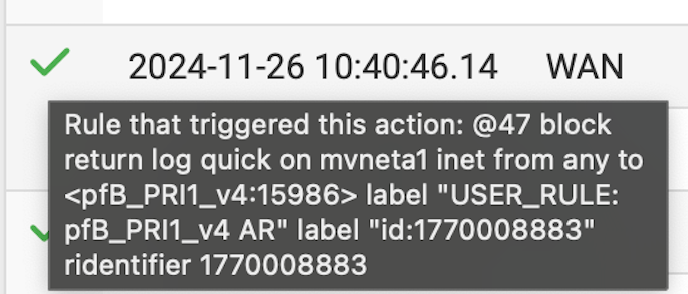
and the concern is this "block" and it is a block, showed up as a pass on the widget. It's not the only one there were a bunch of them showing up immediately following the update. am I concerned ? gosh I hope not.I waited a good 15-20 minutes to see if things would setting down, rebooted.. The incorrect display of the rules seems to have stopped but the CPU usages didn't (again according to top running on console)
There are only 7 widgets (nothing really interesting. I removed them all 1 by 1 - eventually with no widgets loaded the dashboard sure is snappy - and of course everything on the "top" display regarding php-pfm (top 5 all consuming processes) went away.Now I'm trying to narrow down what widget might be to blame - the ones I am using certainly didn't cause this under 24.03 so wouldn't expect anything this wild after the update. the Load average doesn't seem to be that out line but the user and system percentages certainly are when viewing on the dashboard:
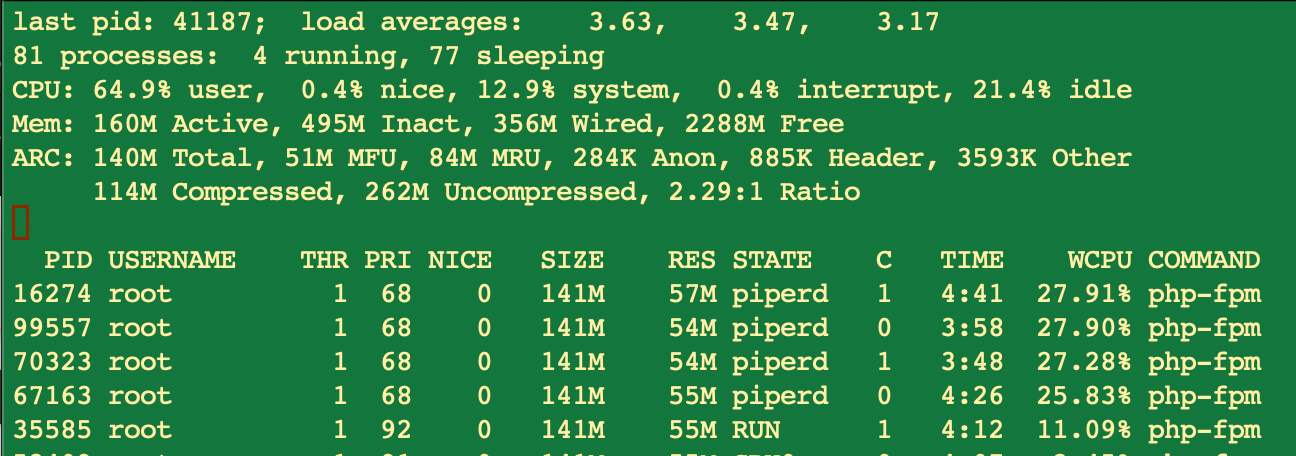
Navigate off the dashboard and doing that can take 30-40 seconds because the response time is so slow, and we see something more like this (or what I would call normal/typical under 24.03).
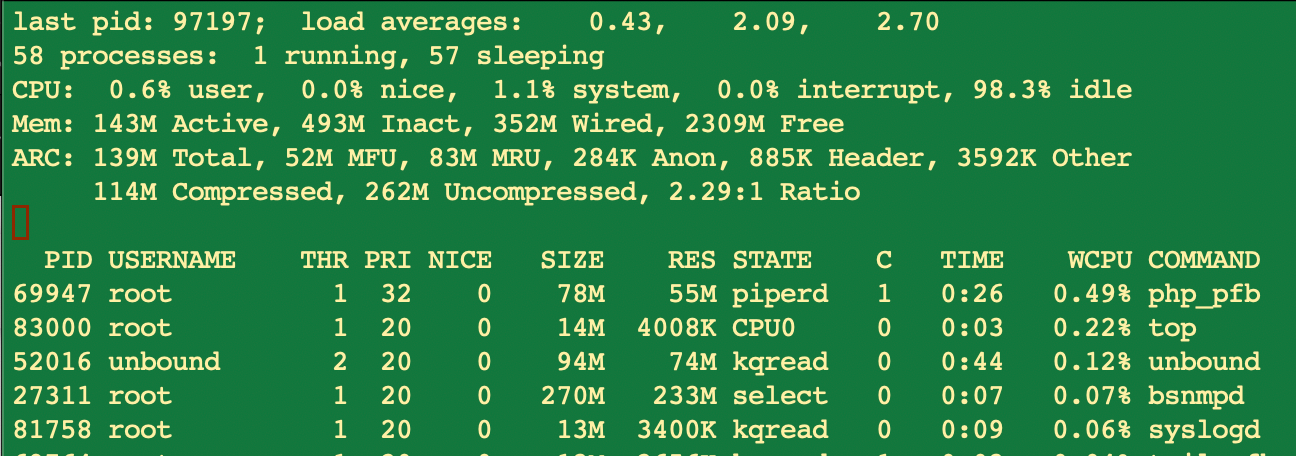
Other than that seems to be running fine. Just running the dashboard with no widgets on it really works good... I'll just go with that for now. nothing there I really stare at all day anyway just when we login and want to check stuff.
-
Try this: https://forum.netgate.com/post/1191398
-
So that cured the 4-5 high php-fpm items showing on the "top" while sitting on the dashboard and 100% CPU
The only new observation after adding the system information widget back and adding the CPU usage item (which I had removed as a test) and then refreshing the entire dashboard was that everything was responsive except the CPU usage line item. It took a good almost 2 minutes to "retrieve" the value. which is now only a couple of points off (higher) where it would normally be which is <20% (really hard to tell when widgets are actually in the process of updating their data)
Removing / adding and saving widgets is back to normal. back to 10-15 seconds instead of minutes+.Once it got past that initial retrieve of the CPU usage it seems to be updating in less time but hard to tell how long. I see no other dashboard issues, everything seems near "normal" php-fpm is no longer locked at the top of top and certainly not 4-5 copies of it. When it is running it is only on top briefly.
There is really nothing stuck on top anymore it varies as normal. user is bouncing between 1 and 20% system between 3 and 10%. which seems more "normal" on this systemThanks for all the work you guys have put into this.
-
J jrey referenced this topic on