24.11 Upgrade High CPU on 2100 not just the widget
-
Happy Post Thanksgiving all! So regarding the widely reported high CPU issues, I've gone through all of the related threads that I can find and looked at or tried just about everything except for Jimp's suggestion of reverting to the older Widget via System Patches. That said, others have also pointed out that the CPU has ramped up with 24.11, at least on some lower-end Netgate devices. So the issue I'm having aside from the System Widget showing (in my case steady 100% CPU usage) even though top- HaSP shows lower than 100%, navigating to other pages throughout **the GUI is so slow that one could easily believe that its actually pegged at 100%. It's NOT but moving through the GUI it definitely feels that way.**bolded text
I'm on 24.11 Release... Netgate 2100 ARM Cortex-A53 r0p4 2 CPUs :
last pid: 87858; load averages: 2.11, 2.12, 2.94 up 0+15:01:02 11:33:02
356 threads: 4 running, 329 sleeping, 23 waiting
CPU 0: 68.7% user, 4.1% nice, 16.6% system, 2.5% interrupt, 8.2% idle
CPU 1: 72.0% user, 4.3% nice, 15.2% system, 1.5% interrupt, 7.0% idle
Mem: 642M Active, 1100M Inact, 668M Wired, 890M Free
ARC: 321M Total, 149M MFU, 156M MRU, 1708K Anon, 2654K Header, 12M Other
269M Compressed, 1037M Uncompressed, 3.85:1 RatioHere's the before and after the upgrade...

Packages all up-to-date: arpwatch, pfBlockerNG, snort, System_Patches.
Threw in a post upgrade reboot, no change.
So my question is, do we think this will be addressed at some point or is the high(er) CPU the new normal for lower-end devices running 24.11? Don't see a ticket in Redmine yet so just asking. Thanks!
-
Are you seeing that only in the gui? Do you see expected usage using
top -aSHat the CLI without the gui open? -
Hey unfortunately I don't have a cable at this particular location to check out the CLI response
The CPU is still much higher than I'd expect, top -aSH shows:
last pid: 3004; load averages: 2.51, 2.38, 2.02 up 1+00:32:48 21:04:48
359 threads: 5 running, 331 sleeping, 23 waiting
CPU: 67.2% user, 4.2% nice, 15.4% system, 1.7% interrupt, 11.5% idle
Mem: 203M Active, 1430M Inact, 699M Wired, 968M Free
ARC: 343M Total, 166M MFU, 162M MRU, 900K Anon, 2810K Header, 12M Other
289M Compressed, 1095M Uncompressed, 3.78:1 RatioI'm happy for the upgrade but seems to have really slowed down any movement in the GUI so that's my main issue. Not overly concerned about what the widget (still pegged at 100) but really annoying to navigate around. Thanks.
-
You don't need to use the console directly you can SSH into it. The test is just to no have the webgui open at the time because that's where most of the changes are we have seen using CPU cycles.
-
@stephenw10 Hey Stephen, sorry for the delay, ready to go. In a Shell without the GUI running, top- aSH shows a low of 68.1% and a high of 80.2% over the course of a few minutes without doing anything else at this appliance location. Compared to the same cmd in the GUI which showed CPU: 67.6% user, 4.4% nice, 14.3% system, 1.7% interrupt, 12.0% at that moment.
Obviously regret that I didn't have an established baseline to compare to before/after the upgrade but if asked... based on how fast or slow the GUI previously performed I would have to say that it's much slower now.
Any other cmds to try out via SSH? Thanks!
-
That seems very high. What does it actually show? What's using the CPU cycles?
For example a test 2100 here shows:
last pid: 84602; load averages: 0.19, 0.27, 0.28 up 7+05:03:08 22:50:29 299 threads: 3 running, 273 sleeping, 23 waiting CPU: 0.2% user, 0.0% nice, 2.1% system, 0.4% interrupt, 97.4% idle Mem: 57M Active, 423M Inact, 529M Wired, 2290M Free ARC: 265M Total, 71M MFU, 179M MRU, 16K Anon, 2412K Header, 12M Other 216M Compressed, 526M Uncompressed, 2.43:1 Ratio PID USERNAME PRI NICE SIZE RES STATE C TIME WCPU COMMAND 11 root 187 ki31 0B 32K CPU0 0 150.8H 98.29% [idle{idle: cpu0}] 11 root 187 ki31 0B 32K RUN 1 150.7H 97.49% [idle{idle: cpu1}] 0 root -12 - 0B 992K - 1 28:54 1.52% [kernel{z_wr_iss}] 17 root -16 - 0B 16K mmcsd 0 11:53 0.46% [mmcsd0: mmc/sd card] 51563 root 20 0 14M 4592K CPU1 1 0:00 0.44% top -aSH 0 root -16 - 0B 992K - 0 10:18 0.38% [kernel{z_wr_int}] 7 root -16 - 0B 16K pftm 0 14:47 0.35% [pf purge] 2 root -60 - 0B 32K WAIT 0 27:23 0.16% [clock{clock (0)}] 6 root -8 - 0B 720K tx->tx 1 5:25 0.13% [zfskern{txg_thread_enter}] 10651 root 20 0 1299M 70M kqread 0 37:11 0.07% /usr/local/bin/pfnet-controller -conf /var/etc/pfnet-controller/pfnet-controller.conf{pfnet-controller} 12 root -64 - 0B 336K WAIT 1 1:40 0.06% [intr{gic0,s26:-ci_xenon0}] 12 root -64 - 0B 336K WAIT 0 7:02 0.05% [intr{gic0,s42: mvneta0}] 6 root -8 - 0B 720K - 0 1:53 0.05% [zfskern{dp_sync_taskq}] 14 root -8 - 0B 48K - 1 1:17 0.05% [geom{g_up}] -
@stephenw10 Yes, I agree and sure, will re-run and post the full output only now trying to SSH in over IPSec since I've left the location. Tried adding a rule like:
Protocol: tcp Source: [my SSH client's IP], Port : any Destination: [remote F/W IP], Port: 22, Interface: IPSec, Action: pass.
My tunnel is otherwise working fine but SSH failing. For destination also tried "this Firewall (self)", "Network" and the F/W's IP ... all a no go to remote SSH over VPN. Thought's on proper syntax for a workable rule for VPN but not over the WAN interface? Thank you.
-
If it's a tunnel mode IPSec VPN (policy based) you're probably hitting this:
https://docs.netgate.com/pfsense/en/latest/vpn/ipsec/access-firewall-over-ipsec.htmlYou are able to hit the webgui though? And not seeing blocked ssh traffic in the firewall log?
-
@stephenw10 Yep, the GUI is fully accessible over the tunnel and I didn't find a log entry for the remote SSH attempts getting blocked but without going too far into the weeds, I would just leave things as they are until next time I'm at the location. When I can I'll rerun the top cmd w/o a GUI running and post the full output here. Apart from the higher than expected CPU and laggy GUI navigation, everything else appears to be good. I've also upgraded a 6100 and a 4860 with no visible issues.
Also thanks for the documentation accessing F/W services over IPsec, interesting but going to pass on those possible workarounds for now.
-
I’m experiencing a potentially related issue on my SG-1100 after the upgrade. The dashboard shows constant 100% CPU usage, but it normalized after about 48 hours of continuous operation.
-
Is that with the modified widget behaviour? Did you have the dashboard open for all that time?
-
@stephenw10 Yes, these measurements are with the dashboard open the entire time. I had several widgets on the dashboard, including 'Traffic Graphs' set to refresh every 3 seconds. After about 48 hours, the CPU usage stabilized at 75–99%. (I also note that with the dashboard closed the CPU usage drops considerably.)
I’m also running high-demand services like Snort IDS and WireGuard VPN client, so that contributes to the load. However, I feel the new version has definitely increased CPU usage compared to the previous one—I’m using the same configuration, and the CPU usage was noticeably lower before the upgrade.
It seems the modified with more widget behavior combined with the dashboard being open all the time and the overall higher CPU usage in this version might be factors.
-
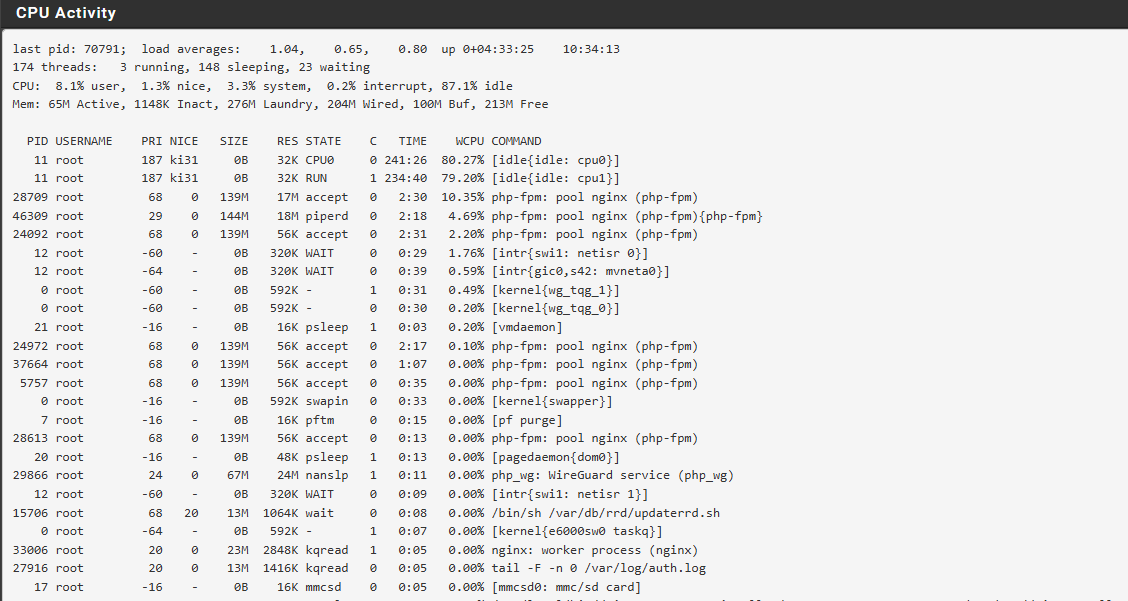
It doesn't look like it but do you have MIM enabled?
-
No, I do not have it activated. The image shows the CPU usage when the dashboard is not on screen. The high CPU usage is only when the dashboard is on screen.