RDD graph without zero in Y axis.
-
I use the RDD graph to show the course of air pressure.
The rise in air pressure from 1020 to 1024 is only a 0.4% increase.
On a y axis from 0 to 1024, that 0.4 % rise is barely noticeable.
Is it possible to set RDD so that the Y axis runs from, say, 940 to 1040?
Then an increase from, say, 1020 to 1024 would be more visible. -
--alt-autoscalelooks like it should do it. -
Re: RDD graph without zero in Y axis.
The option --alt-autoscale give me unfortunately not what I need.
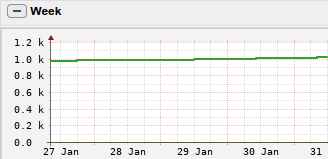
The first image is made without the option alt-autoscale.
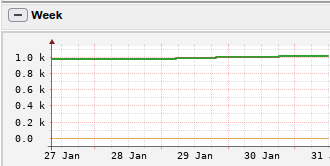
The second image is made with the option alt-autoscale.
The only difference is the position of 0 in the Y-axis.
Also the options alt-autoscale-min and alt-autoscale-max give me not what i need.
I want to see on the Y-axis only the part between 940 and 1040.

-
The option --alt-autoscale give me unfortunately not what I need.
The first image is made without the option alt-autoscale.
The second image is made with the option alt-autoscale.
The only difference is the position of 0 in the Y-axis.
Also the options alt-autoscale-min and alt-autoscale-max give me not what i need.
I want to see on the Y-axis only the part between 940 and 1040.