swap usage shows 100%
-
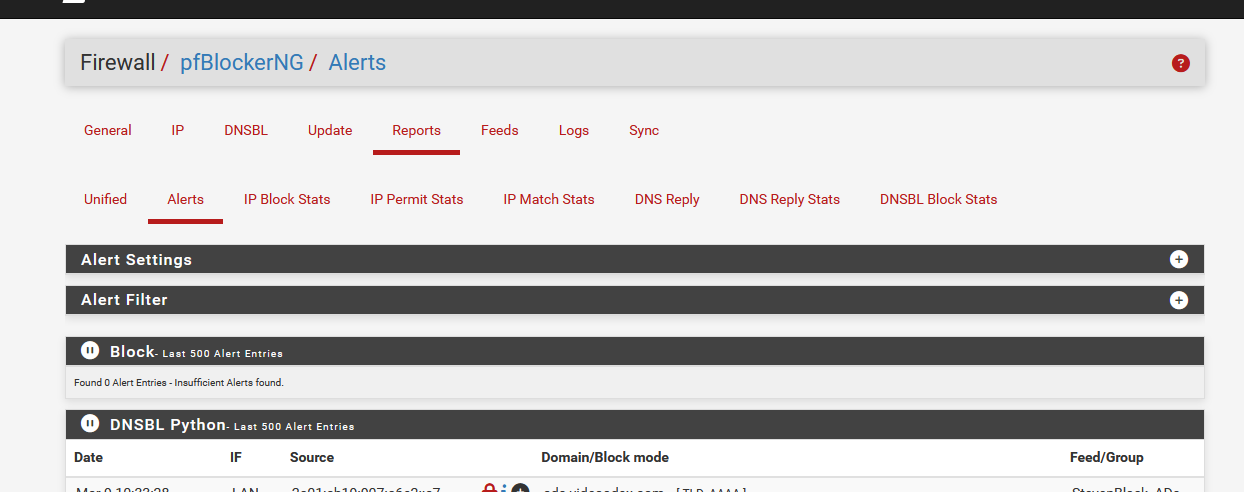
Configured pretty standard I would think. Certain rules are enabled. Alerting only. Updates are on a scheduled. So far since it’s been installed it’s been no fuss.
-
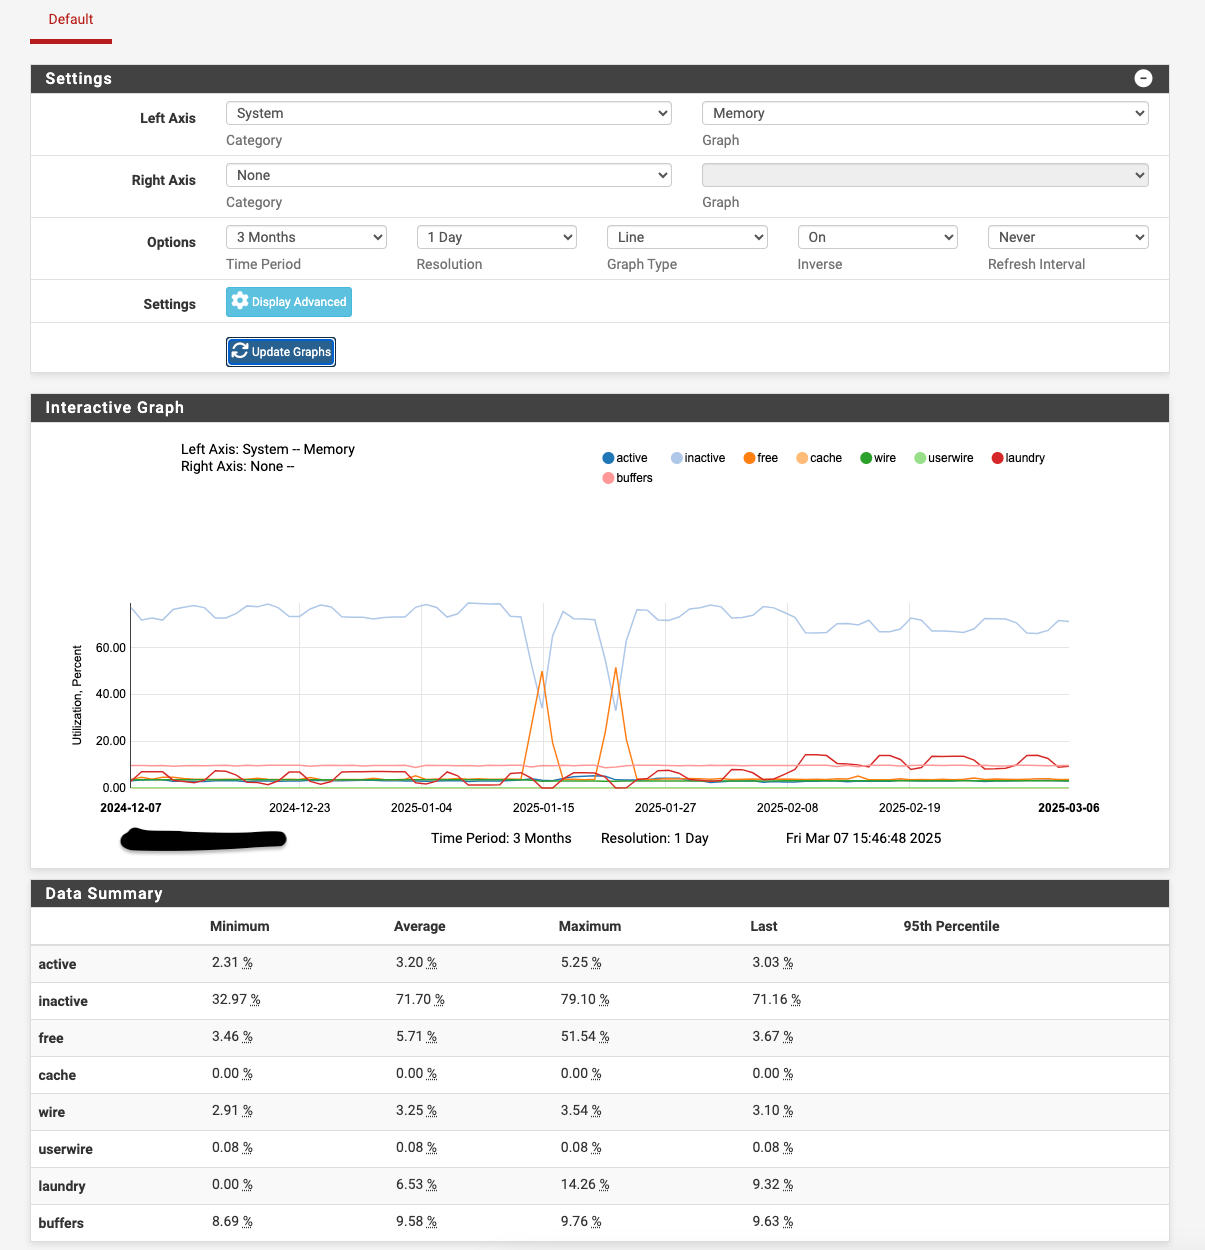
So what happened at that first spike in the graph, ~07:00? Did Suricata update?
-
@stephenw10 you mean the “Laundry” line?
Updates take place at 8am with an update interval of 4 days.Graph time doesn’t seem to correlate
-
@michmoor said in swap usage shows 100%:
Running into the same issue. The IPS packages take up swap for some reason.
Allocation of swap is an operating system decision. It is not under the control of the package. All the package binary would do is request an allocation of memory. The operating system (FreeBSD in this case) decides how to fulfill the request. If there is not enough physical RAM present, the OS may decide to move certain inactive processes out to swap and reallocate that RAM to the new request. Then, when the requesting process sleeps and it's time for the swapped out process to be awakened, the data is moved back to active RAM. This is why using swap is not desired as it slows things down considerably.
Memory usage for the IDS/IPS packages increases during rule updates. Ditto for a package such as pfBlockerNG. If both collide on an update, it is certainly possible to stress the system and cause swap to become necessary.
-
@posix said in swap usage shows 100%:
Updates Tab/Installed Rule sets:
Snort Subscriber Ruleset MD5_HAS removed Tuesday, 04-Mar-25 12:32:41 EST
Snort GPLv2 Community Rules Not Enabled Not Enabled
Emerging Threats Open Rules Not Enabled Not Enabled
Snort OpenAppID Detectors MD5_HAS removed Thursday, 28-Nov-24 19:42:42 EST
Snort AppID Open Text Rules MD5_HAS removed Thursday, 28-Nov-24 19:42:42 ESTWhy did you obfuscate the MD5 hashes of the rules archive? Those are public. It simply shows the calculated MD5 hash of the gzip archive you downloaded from the AWS CDN node. There is absolutely no private information disclosed in that hash.
-
@michmoor said in swap usage shows 100%:
The IPS packages take up ...
nothing when you install them.
Some memory when you activated them, if there are any 'default' (suggested) rules or conditions or lists.
Then the admin start to add a 'max' of other conditions, rules etc ....
At this precise moment, the admin has a new job : monitoring the system resources very frequently.
As IPS, also pfBlockerng, will take what it needs to do the job.
Suddenly, "4 Gbytes of RAM" becomes a very limited resource. 16 or 32 Gbytes of disk space is even worse.In your case, the packages took what RAM was avaible. real RAM ran out, the system starts to use the spare 'virtual' RAM : starts to use the extremely slow swap space, and when that's filled up also, it, the OS, will start to kill randomly (the biggest resource users first) processes.
Things will go downhill fast from this point.
Using swap on a desktop PC, phone, or any other end user deice is probably more ok, but not for routers and that kind of equipment.IPS tools are like toddlers : you keep an eye om them, even when they sleep.
So, choices to make :
Start doing some (more) serious resource management.
and/or
Use less 'IPS' (and other) functionalities.Btw : normally, it's not the RAM that goes low, but its the disk space filled up to 100 % as massive log files are created, and that will trigger a kernel panic for sure, with a chance that it can't reboot anymore.
-
This post is deleted! -
Hello @bmeeks
Edited message to show MD5 hash:Rule Set Name/Publisher MD5 Signature Hash MD5 Signature Date Snort Subscriber Ruleset dbc140f3f6c01f0cff5e53d63e462df7 Thursday, 06-Mar-25 12:32:47 EST Snort GPLv2 Community Rules Not Enabled Not Enabled Emerging Threats Open Rules Not Enabled Not Enabled Snort OpenAppID Detectors c726cf937d84c651a20f2ac7c528384e Thursday, 28-Nov-24 19:42:42 EST Snort AppID Open Text Rules 2c26cb4f6a3bc03ab9c8e02befcf6fe1 Thursday, 28-Nov-24 19:42:42 EST Feodo Tracker Botnet C2 IP Rules Not Enabled Not Enabled -
-
Don't know if this helps since it was mentioned about disk space:
/root: df -h Filesystem Size Used Avail Capacity Mounted on /dev/ufsid/61bf5ededf06b426 227G 70G 138G 34% / devfs 1.0K 0B 1.0K 0% /dev tmpfs 4.0M 204K 3.8M 5% /var/run /lib 227G 70G 138G 34% /var/unbound/lib devfs 1.0K 0B 1.0K 0% /var/unbound/dev /var/log/pfblockerng 227G 70G 138G 34% /var/unbound/var/log/pfblockerng /usr/local/share/GeoIP 227G 70G 138G 34% /var/unbound/usr/local/share/GeoIP /usr/local/bin 227G 70G 138G 34% /var/unbound/usr/local/bin /usr/local/lib 227G 70G 138G 34% /var/unbound/usr/local/lib devfs 1.0K 0B 1.0K 0% /var/dhcpd/dev -
Just checking :
@posix said in swap usage shows 100%:
/var/log/pfblockerng 227G 70G 138G 34% /var/unbound/var/log/pfblockerng
I use the default pfBlockerng log file 'size' setup :

and right now that about 110 Mbytes for me:
You : really 70 Gbytes ?
pfBlockerng use these files to generate these pages on demand :
If your files are that big, it would take ages to do that .... nginx/PHP will probably time out.
-
This post is deleted! -
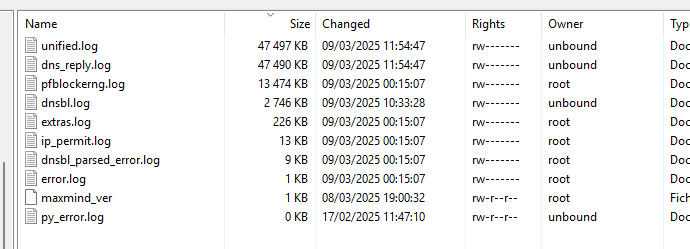
Edit I see the pfblockerlogs increasing:
Thanks for the response, the log size I have configured are the same

/var/log/pfblockerng: ls -l
total 20376
-rw-------  1 unbound unbound 2012634 Mar 10 16:16 dns_reply.log
-rw-------  1 unbound unbound 2474917 Mar 10 16:16 dnsbl.log
-rw-------  1 root    wheel   5258413 Mar 10 16:00 dnsbl_parsed_error.log
-rw-------  1 root    wheel    426448 Mar 10 16:00 error.log
-rw-------  1 root    wheel    274484 Mar 10 16:00 extras.log
-rw-------  1 root    wheel   3481641 Mar 10 16:11 ip_block.log
-rw-------  1 root    wheel   3649640 Mar 10 16:00 ip_permit.log
-rw-r--r--  1 root    unbound     120 Mar 10 12:00 maxmind_ver
-rw-------  1 root    wheel    624287 Mar 10 16:00 pfblockerng.log
-rw-r--r--  1 unbound unbound     229 Feb 21  2023 py_error.log
-rw-------  1 unbound unbound 2208509 Mar 10 16:16 unified.log
second capture:
-rw-------  1 unbound unbound 2054793 Mar 10 16:23 dns_reply.log
-rw-------  1 unbound unbound 2484058 Mar 10 16:22 dnsbl.log
-rw-------  1 root    wheel   5258413 Mar 10 16:00 dnsbl_parsed_error.log
-rw-------  1 root    wheel    426448 Mar 10 16:00 error.log
-rw-------  1 root    wheel    274484 Mar 10 16:00 extras.log
-rw-------  1 root    wheel   3483020 Mar 10 16:18 ip_block.log
-rw-------  1 root    wheel   3649640 Mar 10 16:00 ip_permit.log
-rw-r--r--  1 root    unbound     120 Mar 10 12:00 maxmind_ver
-rw-------  1 root    wheel    624287 Mar 10 16:00 pfblockerng.log
-rw-r--r--  1 unbound unbound     229 Feb 21  2023 py_error.log
-rw-------  1 unbound unbound 2260172 Mar 10 16:23 unified.log
right now up at 75G
/var/log/pfblockerng: df -h Filesystem Size Used Avail Capacity Mounted on /dev/ufsid/61bf5ededf06b426 227G 75G 133G 36% / devfs 1.0K 0B 1.0K 0% /dev tmpfs 4.0M 204K 3.8M 5% /var/run /lib 227G 75G 133G 36% /var/unbound/lib devfs 1.0K 0B 1.0K 0% /var/unbound/dev /var/log/pfblockerng 227G 75G 133G 36% /var/unbound/var/log/pfblockerng /usr/local/share/GeoIP 227G 75G 133G 36% /var/unbound/usr/local/share/GeoIP /usr/local/bin 227G 75G 133G 36% /var/unbound/usr/local/bin /usr/local/lib 227G 75G 133G 36% /var/unbound/usr/local/lib devfs 1.0K 0B 1.0K 0% /var/dhcpd/dev -
Hello, can anyone provide further guidance?
-
Sorry to blast, but looking for further guidance and next steps.
-
I assume it resets if you reboot?
How long does it take to refill?
-
I would not conflate disk space consumption with swap file usage. Having large files on the disk does not necessarily relate to swap being used. Maybe if you were trying to load and view huge files, but the PHP GUI would probably crash first before it forced the OS into using swap.
Something with the number of active processes you have running is consuming the swap. You have a number of Snort processes showing in one of your screen captures. Do you actually have that many physical interfaces configured, or are you running Snort instances on multiple VLANs? If the latter, consider running a single Snort instance on the physical interface.
You also have a couple of other packages that are likely to use RAM aggressively. Taken all together, it appears you have more "stuff" running than you have enough physical RAM to accomodate- thus the need for swap usage.
-
@posix The 70G/75G is total disk usage not pfBlocker usage. Though that’s at least 10x a typical pfSense installation.
Try “du -h —max-depth=2 /“ At a command line and see what’s using 70GB and apparently increasing since your earlier post. Then keep going into the largest subdirectories.
Edit: and yeah, disk usage is not equal to RAM usage.
-
Just an update. I removed SNORT package and swap usage went down to %7
@bmeeks as you pointed I was using SNORT on a few vlan interfaces and subscribed to paid rules. Since SNORT is not going to be moving to newer releases in PFSENSE anytime soon and I have no technical justification to use it in my home network (LOL - I know, "But I wanted to learn"). Other real world problems take priority.
Will open another thread about file useage, thank you all for the pointer hopefully others will benefit from this thread.