Slow Iperf3 Results
-
@stevencavanagh said in Slow Iperf3 Results:
To a PC on the same VLAN
and how would anything on pfsense have to do with client on network talking to another device on the same network.. Pfsense would have nothing to do with that conversation.. Unless devices were on opposite sides of bridge that is on pfsense.
-
Yes, cracking up slowly, bad day at work. It would just go the switch and back down. Think last time I did this the laptop was set up for the guest VLAN!
However, as both are on the same LAN and would connect to the same switch, can't understand why
-
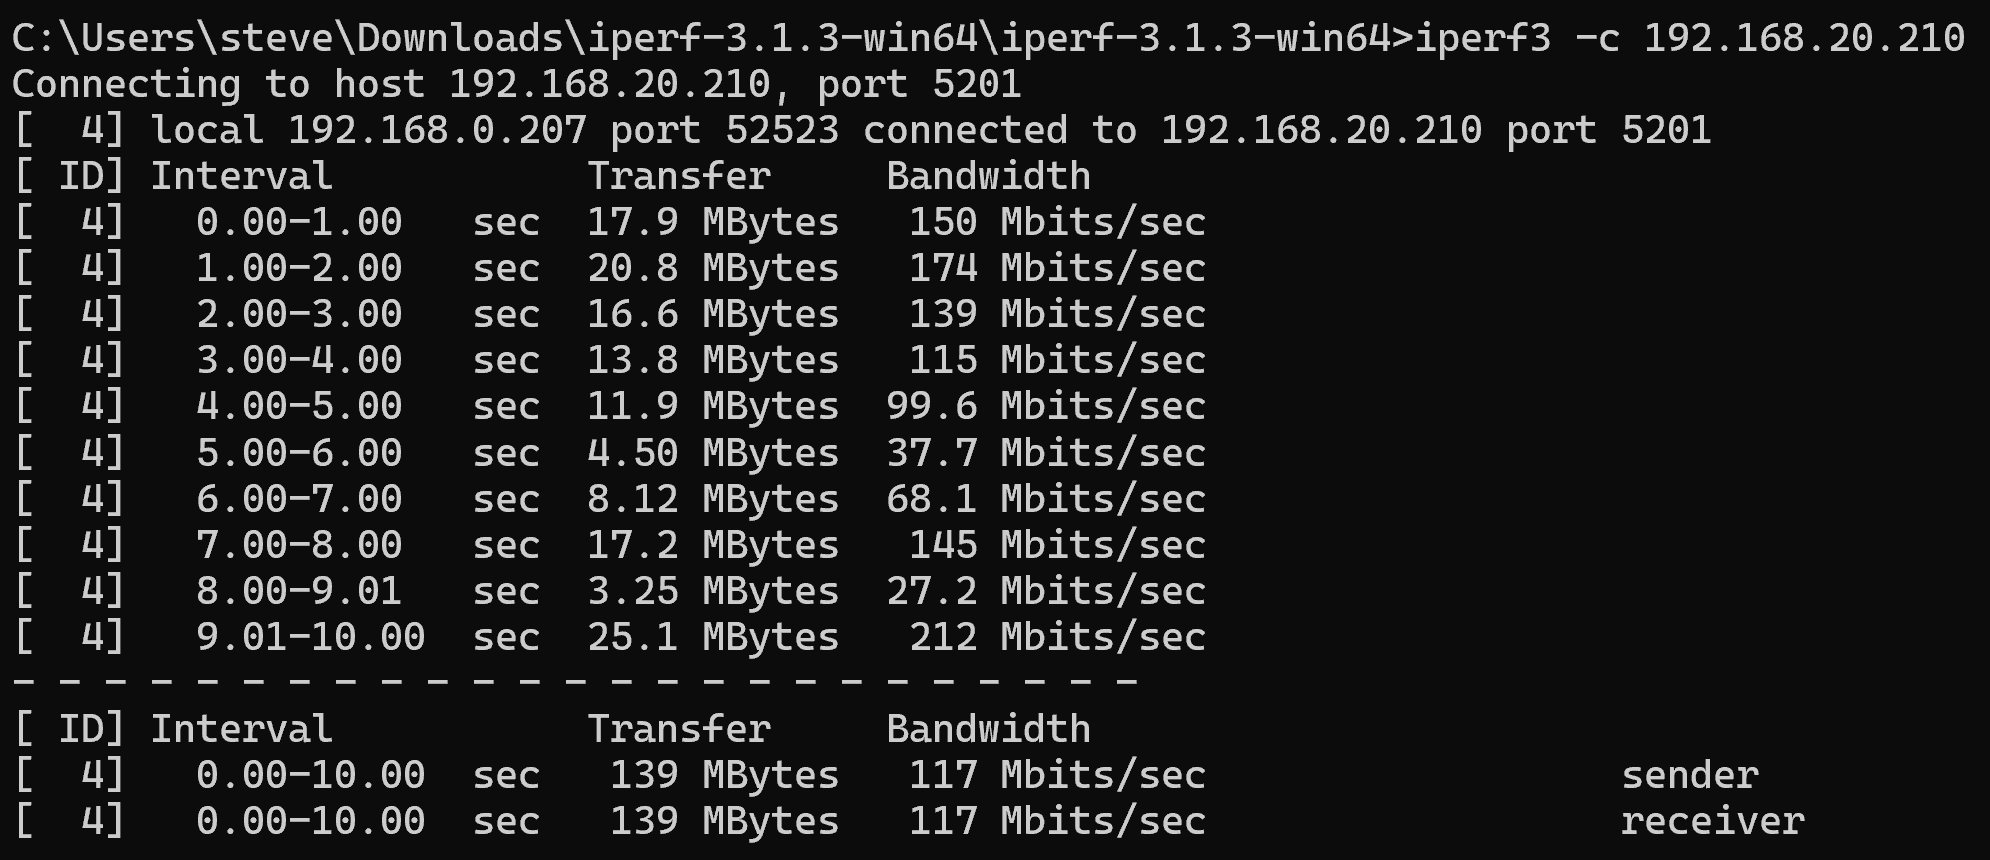
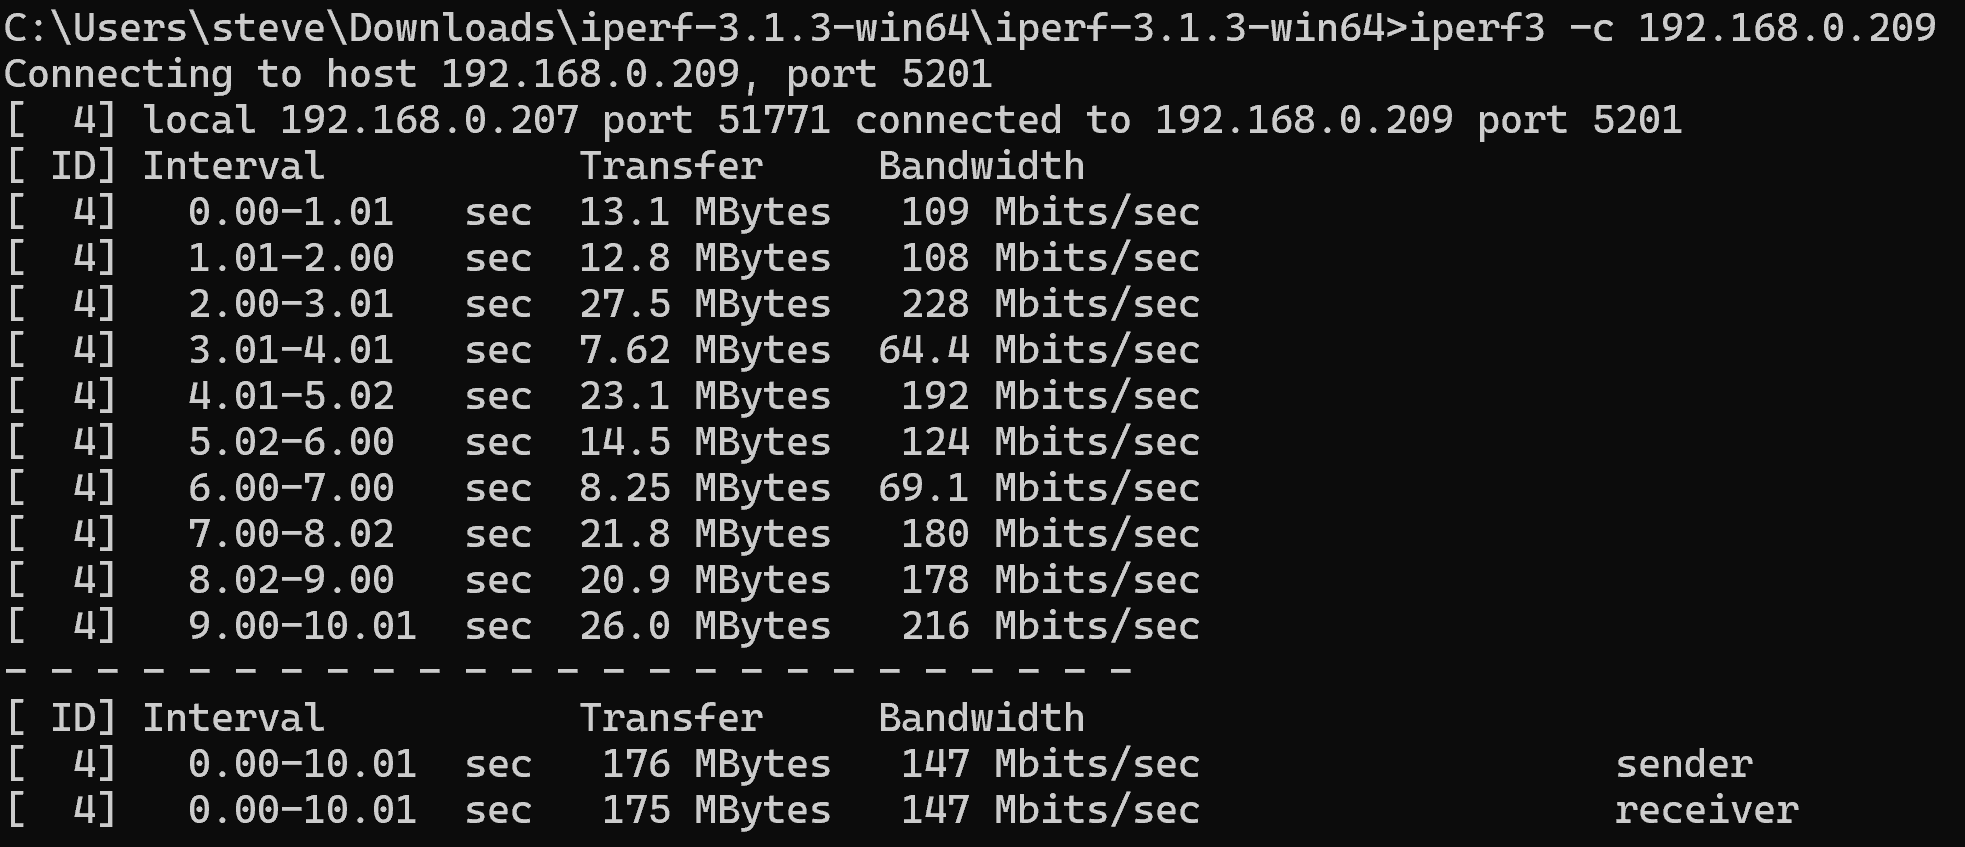
@stevencavanagh something is for sure not right there.. Those are horrible, even for wireless ;)
Wired gig should be low to mid 900s for sure - and pretty rock solid stable..
You might want to try with -R to see if better in other direction.
here is gig to my nas from my pc
$ iperf3.exe -c 192.168.9.10
Connecting to host 192.168.9.10, port 5201
[  5] local 192.168.9.100 port 32772 connected to 192.168.9.10 port 5201
[ ID] Interval           Transfer     Bitrate
[  5]   0.00-1.00   sec   115 MBytes   964 Mbits/sec
[  5]   1.00-2.00   sec   113 MBytes   949 Mbits/sec
[  5]   2.00-3.01   sec   114 MBytes   949 Mbits/sec
[  5]   3.01-4.00   sec   112 MBytes   948 Mbits/sec
[  5]   4.00-5.00   sec   114 MBytes   949 Mbits/sec
[  5]   5.00-6.01   sec   114 MBytes   949 Mbits/sec
[  5]   6.01-7.01   sec   112 MBytes   949 Mbits/sec
[  5]   7.01-8.00   sec   113 MBytes   950 Mbits/sec
[  5]   8.00-9.01   sec   114 MBytes   949 Mbits/sec
[  5]   9.01-10.02  sec   114 MBytes   949 Mbits/sec
- - - - - - - - - - - - - - - - - - - - - - - - -
[ ID] Interval           Transfer     Bitrate
[  5]   0.00-10.02  sec  1.11 GBytes   951 Mbits/sec                  sender
[  5]   0.00-10.03  sec  1.11 GBytes   949 Mbits/sec                  receiver

iperf Done.
Here is with -R
$ iperf3.exe -c 192.168.9.10 -R
Connecting to host 192.168.9.10, port 5201
Reverse mode, remote host 192.168.9.10 is sending
[  5] local 192.168.9.100 port 32792 connected to 192.168.9.10 port 5201
[ ID] Interval           Transfer     Bitrate
[  5]   0.00-1.01   sec   113 MBytes   936 Mbits/sec
[  5]   1.01-2.01   sec   113 MBytes   950 Mbits/sec
[  5]   2.01-3.01   sec   113 MBytes   949 Mbits/sec
[  5]   3.01-4.01   sec   114 MBytes   948 Mbits/sec
[  5]   4.01-5.01   sec   112 MBytes   949 Mbits/sec
[  5]   5.01-6.01   sec   112 MBytes   943 Mbits/sec
[  5]   6.01-7.01   sec   114 MBytes   950 Mbits/sec
[  5]   7.01-8.01   sec   112 MBytes   948 Mbits/sec
[  5]   8.01-9.00   sec   112 MBytes   944 Mbits/sec
[  5]   9.00-10.01  sec   114 MBytes   944 Mbits/sec
- - - - - - - - - - - - - - - - - - - - - - - - -
[ ID] Interval           Transfer     Bitrate         Retr
[  5]   0.00-10.01  sec  1.11 GBytes   948 Mbits/sec  164            sender
[  5]   0.00-10.01  sec  1.10 GBytes   946 Mbits/sec                  receiver

iperf Done.
On side note 3.1.3 is pretty old version 3.18 of iperf is current. I compile it myself and have it available for download if your interested.. Could post up a link, but here is also a good place to get windows versions
-
@johnpoz
I used to get similar results to yourself once I removed the limiter 6 months ago. I have tweaked how my edge switches are connected to the core switch since I have now got Pfsense connected to it via SFP+ but I have checked and the edge switches connect direct to the core and I cannot see any loops etc.All the network appears to work, just slowly but everything is uplinked on 10G so a bit confused!
If you have a link for the latest Iperf, that would be great.
PS. Did notice thatcwhen I was logged into the switch dashboard monitoring the traffic as Iperf was running, the switch kept losing connection and reconnecting hence I wondered if I had a network loop.
-
The server end would normally show the retransmit count. And on a connection like that I'd expect to see a large number of them!
But, yes, that must be something between the hosts and switch and not pfSense.
-
I will take a look at the server end and see what is going on
-
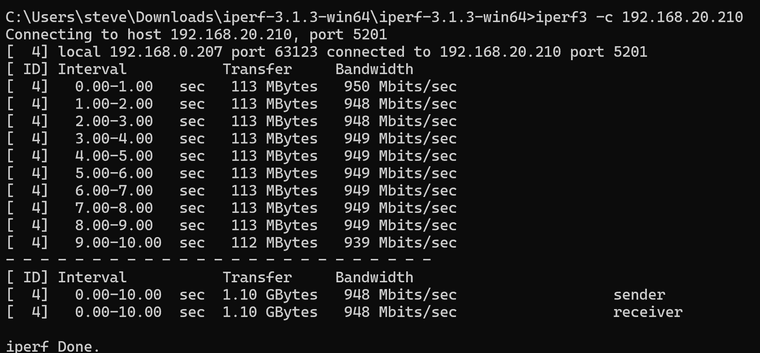
Now I am confused, went to have a look at the server end to see the number of retries and it is all zero! Running Iperf again and got the result below from one of the servers (across a VLAN).......

All other Iperf results I showed earlier show the same i.e. as it should be.
After I had this issue I went up to the network just to check for any obvious network loops and did not find any but did find that the 2 cat 6 cables (LAGG) from the spare Pfsense PC (switched off) was still connected to the switch in question even though the connection is now SFP+ 10G but can't imagine that would make a difference but I disconnected them anyway.
Would that have made a difference?
Also looked at Pfsense and it showed the WAN down with 100% packet loss but I still had internet!! Iperf results were good.
Rebooted Pfsense and WAN showing healthy and all Iperf results good. Only change is disconnecting the unused two cat 6 cables from the old LAGG connection from switch to the spare (powered off) Pfsense PC.
Steve
-
@stevencavanagh said in Slow Iperf3 Results:
If you have a link for the latest Iperf, that would be great.
You can get it here directly
https://github.com/ar51an/iperf3-win-builds/releases/download/3.18/iperf-3.18-win64.zip
-
Could have been some sort of loop then. Or maybe some asymmetry.
If it was a loop/flood you'd see it in the traffic graphs from the time. If it was going through pfSense at least.
-
@stephenw10 said in Slow Iperf3 Results:
Could have been some sort of loop then. Or maybe some asymmetry.
If it was a loop/flood you'd see it in the traffic graphs from the time. If it was going through pfSense at least.
Must have been a loop, just flooded the 1G connection and monitored on the switch and it didn't once loose connection and had to reconnect. Very strange.


