Netgate 4100 slower at 2.5gbe than 1gbe
-
I have a Netgate 4100 and an Xfinity modem (believe its an XB7) which is in bridge modem. My service is currently provisioned at 1300/40. When the network port (and I've tried both a "WAN" port and a "LAN" port) is set to auto select or 2500Base-T my speed testing results are very variable and range from 400-700 down. Up seems fine. If I force the port to 1000Base-T I get consistent results in the 900's down. I've gotten Xfinity to replace the modem with no change, temporarily went back to an owned Arris SB8200 with the same speed issues, and testing with a laptop plugged into the modem directly, I get 1300 every time. I'm using good quality cables (have tried a couple) about 2M long. It looks like the issue is the Netgate hardware.
Since my switch is 1GBE I've not worried about it but am looking to upgrade the switch and it looks like Xfinity is rolling out their new faster tiers in our area. I've decided its time to fix this or add a new router to the upgrade list. I'm at a loss on how to troubleshoot the issue. Any suggestions?
-
Edit: One more piece of info--I also use one of the 2.5gbe LAN connections to connect to my a 2.5gb SFP to RJ45 adapter installed in my switch. I see no issues there.
-
Does it actually link at 2.5G?
Do you see errors on the interface in Status > Interfaces?
Try reassigning WAN to one of the other igb ports and see if the issue follows it.
-
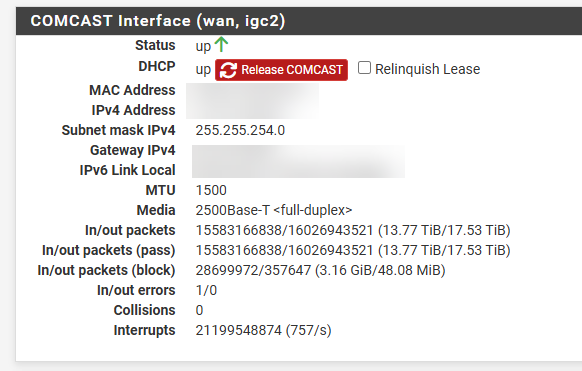
I have tried multiple ports, the problem always follows. Here's the status with it forced to 2.5. I managed to get 300-something and 250-something with it set like this. I set it back to 1gb and got a 940 and a 939.
-
Hmm, not errors then.
Check the output of
sysctl hw.igcandsysctl dev.igc.2. Could be a flow control issue.Can you the status of the modem port or set anything at that end?
-
The only thing I can see in the modem related to ethernet is that it agrees, 2.5gb connection. The logs don't show anything at all, assume they must be related to the router functions that are bypassed when set to bridge mode.
I have no idea what I'm looking at in the output of these commands.
Shell Output - sysctl hw.igc
hw.igc.max_interrupt_rate: 20000
hw.igc.eee_setting: 1
hw.igc.sbp: 1
hw.igc.smart_pwr_down: 0
hw.igc.rx_abs_int_delay: 66
hw.igc.tx_abs_int_delay: 66
hw.igc.rx_int_delay: 0
hw.igc.tx_int_delay: 66
hw.igc.disable_crc_stripping: 0
Shell Output - sysctl dev.igc.2 dev.igc.2.wake: 0 dev.igc.2.interrupts.rx_desc_min_thresh: 0 dev.igc.2.interrupts.asserts: 21205157789 dev.igc.2.mac_stats.tso_txd: 0 dev.igc.2.mac_stats.tx_frames_1024_1522: 12870635006 dev.igc.2.mac_stats.tx_frames_512_1023: 117248314 dev.igc.2.mac_stats.tx_frames_256_511: 118770026 dev.igc.2.mac_stats.tx_frames_128_255: 373871075 dev.igc.2.mac_stats.tx_frames_65_127: 2318793523 dev.igc.2.mac_stats.tx_frames_64: 232229298 dev.igc.2.mac_stats.mcast_pkts_txd: 41 dev.igc.2.mac_stats.bcast_pkts_txd: 30221 dev.igc.2.mac_stats.good_pkts_txd: 16031547242 dev.igc.2.mac_stats.total_pkts_txd: 16031547242 dev.igc.2.mac_stats.good_octets_txd: 19566552685116 dev.igc.2.mac_stats.good_octets_recvd: 15444273234391 dev.igc.2.mac_stats.rx_frames_1024_1522: 10030708797 dev.igc.2.mac_stats.rx_frames_512_1023: 149340411 dev.igc.2.mac_stats.rx_frames_256_511: 133766002 dev.igc.2.mac_stats.rx_frames_128_255: 297433919 dev.igc.2.mac_stats.rx_frames_65_127: 4831425297 dev.igc.2.mac_stats.rx_frames_64: 179397977 dev.igc.2.mac_stats.mcast_pkts_recvd: 17616456 dev.igc.2.mac_stats.bcast_pkts_recvd: 2567 dev.igc.2.mac_stats.good_pkts_recvd: 15622072403 dev.igc.2.mac_stats.total_pkts_recvd: 15623300953 dev.igc.2.mac_stats.xoff_txd: 0 dev.igc.2.mac_stats.xoff_recvd: 0 dev.igc.2.mac_stats.xon_txd: 0 dev.igc.2.mac_stats.xon_recvd: 0 dev.igc.2.mac_stats.alignment_errs: 0 dev.igc.2.mac_stats.crc_errs: 0 dev.igc.2.mac_stats.recv_errs: 0 dev.igc.2.mac_stats.recv_jabber: 0 dev.igc.2.mac_stats.recv_oversize: 0 dev.igc.2.mac_stats.recv_fragmented: 0 dev.igc.2.mac_stats.recv_undersize: 0 dev.igc.2.mac_stats.recv_no_buff: 0 dev.igc.2.mac_stats.missed_packets: 0 dev.igc.2.mac_stats.defer_count: 0 dev.igc.2.mac_stats.sequence_errors: 0 dev.igc.2.mac_stats.symbol_errors: 0 dev.igc.2.mac_stats.collision_count: 0 dev.igc.2.mac_stats.late_coll: 0 dev.igc.2.mac_stats.multiple_coll: 0 dev.igc.2.mac_stats.single_coll: 0 dev.igc.2.mac_stats.excess_coll: 0 dev.igc.2.queue_rx_1.rx_irq: 0 dev.igc.2.queue_rx_1.rxd_tail: 243 dev.igc.2.queue_rx_1.rxd_head: 244 dev.igc.2.queue_rx_0.rx_irq: 0 dev.igc.2.queue_rx_0.rxd_tail: 667 dev.igc.2.queue_rx_0.rxd_head: 668 dev.igc.2.queue_tx_1.tx_irq: 0 dev.igc.2.queue_tx_1.txd_tail: 803 dev.igc.2.queue_tx_1.txd_head: 803 dev.igc.2.queue_tx_0.tx_irq: 0 dev.igc.2.queue_tx_0.txd_tail: 510 dev.igc.2.queue_tx_0.txd_head: 510 dev.igc.2.fc_low_water: 32752 dev.igc.2.fc_high_water: 32768 dev.igc.2.rx_control: 71335938 dev.igc.2.device_control: 1477707329 dev.igc.2.watchdog_timeouts: 0 dev.igc.2.rx_overruns: 0 dev.igc.2.link_irq: 392 dev.igc.2.dropped: 0 dev.igc.2.eee_control: 1 dev.igc.2.itr: 488 dev.igc.2.tx_abs_int_delay: 66 dev.igc.2.rx_abs_int_delay: 66 dev.igc.2.tx_int_delay: 66 dev.igc.2.rx_int_delay: 0 dev.igc.2.rs_dump: 0 dev.igc.2.reg_dump: General Registers CTRL 58140641 STATUS 40780683 CTRL_EXIT 10000040 Interrupt Registers ICR 00000000 RX Registers RCTL 04408002 RDLEN 00004000 RDH 0000029c RDT 0000029b RXDCTL 02040808 RDBAL 6aa7e000 RDBAH 00000000 TX Registers TCTL a503f0fa TDBAL 6aa62000 TDBAH 00000000 TDLEN 00004000 TDH 000001fe TDT 000001fe TXDCTL 0201011f TDFH 00000000 TDFT 00000000 TDFHS 00000000 TDFPC 00000000 dev.igc.2.fc: 3 dev.igc.2.debug: -1 dev.igc.2.nvm: -1 dev.igc.2.iflib.rxq1.rxq_fl0.buf_size: 2048 dev.igc.2.iflib.rxq1.rxq_fl0.credits: 1023 dev.igc.2.iflib.rxq1.rxq_fl0.cidx: 244 dev.igc.2.iflib.rxq1.rxq_fl0.pidx: 243 dev.igc.2.iflib.rxq1.cpu: 1 dev.igc.2.iflib.rxq0.rxq_fl0.buf_size: 2048 dev.igc.2.iflib.rxq0.rxq_fl0.credits: 1023 dev.igc.2.iflib.rxq0.rxq_fl0.cidx: 668 dev.igc.2.iflib.rxq0.rxq_fl0.pidx: 667 dev.igc.2.iflib.rxq0.cpu: 0 dev.igc.2.iflib.txq1.r_abdications: 0 dev.igc.2.iflib.txq1.r_restarts: 0 dev.igc.2.iflib.txq1.r_stalls: 0 dev.igc.2.iflib.txq1.r_starts: 165433 dev.igc.2.iflib.txq1.r_drops: 0 dev.igc.2.iflib.txq1.r_enqueues: 165439 dev.igc.2.iflib.txq1.ring_state: pidx_head: 0638 pidx_tail: 0638 cidx: 0638 state: IDLE dev.igc.2.iflib.txq1.txq_cleaned: 166649 dev.igc.2.iflib.txq1.txq_processed: 166689 dev.igc.2.iflib.txq1.txq_in_use: 42 dev.igc.2.iflib.txq1.txq_cidx_processed: 801 dev.igc.2.iflib.txq1.txq_cidx: 761 dev.igc.2.iflib.txq1.txq_pidx: 803 dev.igc.2.iflib.txq1.no_tx_dma_setup: 0 dev.igc.2.iflib.txq1.txd_encap_efbig: 0 dev.igc.2.iflib.txq1.tx_map_failed: 0 dev.igc.2.iflib.txq1.no_desc_avail: 0 dev.igc.2.iflib.txq1.mbuf_defrag_failed: 0 dev.igc.2.iflib.txq1.m_pullups: 0 dev.igc.2.iflib.txq1.mbuf_defrag: 0 dev.igc.2.iflib.txq1.cpu: 1 dev.igc.2.iflib.txq0.r_abdications: 0 dev.igc.2.iflib.txq0.r_restarts: 0 dev.igc.2.iflib.txq0.r_stalls: 0 dev.igc.2.iflib.txq0.r_starts: 142376 dev.igc.2.iflib.txq0.r_drops: 0 dev.igc.2.iflib.txq0.r_enqueues: 142377 dev.igc.2.iflib.txq0.ring_state: pidx_head: 1256 pidx_tail: 1256 cidx: 1256 state: IDLE dev.igc.2.iflib.txq0.txq_cleaned: 143828 dev.igc.2.iflib.txq0.txq_processed: 143868 dev.igc.2.iflib.txq0.txq_in_use: 42 dev.igc.2.iflib.txq0.txq_cidx_processed: 508 dev.igc.2.iflib.txq0.txq_cidx: 468 dev.igc.2.iflib.txq0.txq_pidx: 510 dev.igc.2.iflib.txq0.no_tx_dma_setup: 0 dev.igc.2.iflib.txq0.txd_encap_efbig: 0 dev.igc.2.iflib.txq0.tx_map_failed: 0 dev.igc.2.iflib.txq0.no_desc_avail: 0 dev.igc.2.iflib.txq0.mbuf_defrag_failed: 0 dev.igc.2.iflib.txq0.m_pullups: 0 dev.igc.2.iflib.txq0.mbuf_defrag: 0 dev.igc.2.iflib.txq0.cpu: 0 dev.igc.2.iflib.override_nrxds: 0 dev.igc.2.iflib.override_ntxds: 0 dev.igc.2.iflib.use_logical_cores: 0 dev.igc.2.iflib.separate_txrx: 0 dev.igc.2.iflib.core_offset: 0 dev.igc.2.iflib.tx_abdicate: 0 dev.igc.2.iflib.rx_budget: 0 dev.igc.2.iflib.disable_msix: 0 dev.igc.2.iflib.override_qs_enable: 0 dev.igc.2.iflib.override_nrxqs: 0 dev.igc.2.iflib.override_ntxqs: 0 dev.igc.2.iflib.driver_version: 1 dev.igc.2.%parent: pci6 dev.igc.2.%pnpinfo: vendor=0x8086 device=0x15f3 subvendor=0x8086 subdevice=0x0000 class=0x020000 dev.igc.2.%location: slot=0 function=0 dbsf=pci0:6:0:0 handle=\_SB_.PCI0.PEX5.PXSX dev.igc.2.%driver: igc dev.igc.2.%desc: Intel(R) Ethernet Controller I225-V -
You might try disabling flow control as a test:
sysctl dev.igc.2.fc=0What pfSense version is that?
-
I’ll give that a try and report back. It’s 24.03, I know I’m behind.
-
Ah, well I'd definitely try 24.11 then. I'm not aware of anything specific there that might address this but there have been a number of updates/fixes.
-
@stephenw10
Yeah been meaning to do it but with two of us working from home and being a crazy busy time can’t even really afford weekend downtime. But I just kicked it off and will test changing flow control tomorrow. -
@stephenw10 Unfortunately neither the upgrade or changing flow control made any difference. Still get near 1gb when forced to 1gb, still get in the 300's when forced to 2.5gb.
-
How are you testing that exactly?
Can you grab a packet capture during the poor throughput?
-
@stephenw10 I use a docker container called Speedtest Tracker which uses Speedtest.net. Running in docker and taking the browser out of the picture it seems to provide pretty consistent results. I'll have to look into capturing packets, should be doable, just have never had the need.
-
Hmm, the issues could be on the LAN side and are just hidden by limiting the throughput to 1G on the WAN.
Do you see any errors on the LAN interface?
You might try running an iperf3 test to or from pfSense itself and a LAN side client. Or running a a speedtest client test from pfSense directly so the LAN side is not involved.
-
Might be getting somewhere. I installed the speedtest widget from https://github.com/LeonStraathof/pfsense-speedtest-widget and get above the full provisioned speed as I would typically expect.
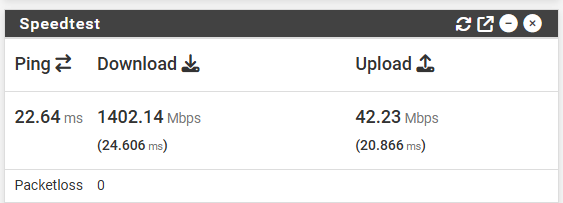
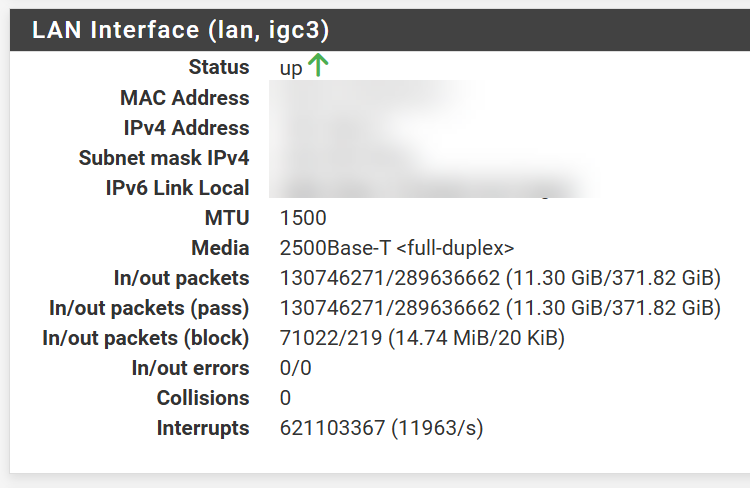
So I guess I don't understand why having more available bandwidth on the WAN interface would slow down the LAN? Don't see any errors but the interrupts seems high?
-
@matt_m said in Netgate 4100 slower at 2.5gbe than 1gbe:
So I guess I don't understand why having more available bandwidth on the WAN interface would slow down the LAN?
Lack of flow control on either interface can cause this. I have 2.5Gb link on WAN (provisioned @ 2Gb down), and 10Gb link on the LAN interface. If I turn off flow control on the LAN, speed tests go very, very badly.
-
I did some more testing.
- If I set the LAN interface to 1000Gb I get most of the speed back. Tests in the high 800s, still notably lower than normal.
- I tried all combinations of flow control on the LAN and WAN interfaces, doesn't seem to have any impact.
- I enabled flow control on my Unifi network. At 2.5gb it doesn't seem to have any impact or maybe made things worse.
- Flow control enabled everywhere, LAN at 2.5, WAN at 1, it seemed to be staying in the 800s
- Back to flow control disabled in Unifi, enabled everywhere in pfSense, LAN at 2.5, WAN at 1, its back to the mid 900's.
Something about the router or my configuration of the router is an issue.
-
One additional test, to rule out the SFP to RJ45 module, I have a small Netgear unmanaged 2.5gb switch sitting unused. I connected the LAN interface and the Proxmox host running my docker server directly to the 2.5gb switch and set the WAN back to 2.5 and didn't do any better than through all the Unifi equipment. I'll also add that I recently upgraded my proxmox host and saw these issues with the old host so its not that.
-
Yeah check the sysctl outputs for the LAN side NIC.
Try an iperf test between pfSense and a LAN side client, make sure you can actually pass >1G there.
-
@stephenw10 had trouble getting iperf installed—just seemed to stall out. Figure a reboot was in order but couldn’t take down the network since we were working then headed out of town.
I have been intending to upgrade my switches to 2.5gb and picked up a Unifi Pro Max 24 during our trip. That will eliminate the GBIC to RJ45 adapter I've been using. I don’t expect that to resolve the issue but it’s something that’s been on my list for a while and will give me the ability to set up a 2.5gb connection from the router to my Docker machine for testing and will let a couple other machines take advantage of higher speeds. That also means I need to resolve this one way or another.
I’ve stumbled upon 1-2 other posts in dusty corners of the internet that might be describing the same issue but none with any resolution.