Cannot Achieve 10g pfsense bottleneck
-
@stephenw10 Hi Stephen,
boot logs
ixl1: netmap queues/slots: TX 4/1024, RX 4/1024
ixl1: SR-IOV ready
ixl1: PCI Express Bus: Speed 8.0GT/s Width x8
ixl1: Allocating 4 queues for PF LAN VSI; 4 queues active
ixl1: Ethernet address: 3c:ec:ec:dc:b3:a1
ixl1: Using MSI-X interrupts with 5 vectors
ixl1: Using 4 RX queues 4 TX queues
ixl1: Using 1024 TX descriptors and 1024 RX descriptors
ixl1: PF-ID[1]: VFs 64, MSI-X 129, VF MSI-X 5, QPs 768, MDIO & I2C
ixl1: fw 9.121.73281 api 1.15 nvm 9.20 etid 8000e153 oem 1.269.0
ixl1: <Intel(R) Ethernet Controller XXV710 for 25GbE SFP28 - 2.3.3-k> mem 0x38bffd000000-0x38bffdffffff,0x38bfff000000-0x38bfff007fff irq 40 at device 0.1 numa-domain 0 on pci7
ixl0: netmap queues/slots: TX 4/1024, RX 4/1024
ixl0: SR-IOV ready
ixl0: PCI Express Bus: Speed 8.0GT/s Width x8
ixl0: Allocating 4 queues for PF LAN VSI; 4 queues active
ixl0: Ethernet address: 3c:ec:ec:dc:b3:a2
ixl0: Using MSI-X interrupts with 5 vectors
ixl0: Using 4 RX queues 4 TX queues
ixl0: Using 1024 TX descriptors and 1024 RX descriptors
ixl0: PF-ID[0]: VFs 64, MSI-X 129, VF MSI-X 5, QPs 768, MDIO & I2C
ixl0: fw 9.121.73281 api 1.15 nvm 9.20 etid 8000e153 oem 1.269.0
ixl0: <Intel(R) Ethernet Controller XXV710 for 25GbE SFP28 - 2.3.3-k> mem 0x38bffe000000-0x38bffeffffff,0x38bfff008000-0x38bfff00ffff irq 40 at device 0.0 numa-domain 0 on pci7
which test do you want me to check with -R switch?
from pfsense box to another machine
or cross vlan machine to machine? -
@Laxarus said in Cannot Achieve 10g pfsense bottleneck:
which test do you want me to check with -R switch?
Any of the tests hitting the 5Gbps limit. Just to be sure it's the same with the states opened the other way.
You might be able to tune the number of queues and their size there.
-
I agree with Stephen about limit the parallel session to 8. I usually use -P5. That leave some CPU for other processing. Do not run iperf server or client on PfSense. Just use that for routing.
Still trying to understand your network. Are all the VLAN's routing through PfSense with VLAN Gateways on .1 for each subnet ? Maybe do a simple drawing ?
Also is PF running in Proxmox or standalone on the Xeon ?
Try turning the buffer bloat limiter off & run PF in the simplest mode possible.
-
@stephenw10 here another set of results with -R
root@PROXMOX1:~# iperf3 -c 192.168.40.40 -P 8 -w 256K -R
Connecting to host 192.168.40.40, port 5201
Reverse mode, remote host 192.168.40.40 is sending
[  5] local 192.168.55.21 port 35280 connected to 192.168.40.40 port 5201
[  7] local 192.168.55.21 port 35292 connected to 192.168.40.40 port 5201
[  9] local 192.168.55.21 port 35296 connected to 192.168.40.40 port 5201
[ 11] local 192.168.55.21 port 35302 connected to 192.168.40.40 port 5201
[ 13] local 192.168.55.21 port 35318 connected to 192.168.40.40 port 5201
[ 15] local 192.168.55.21 port 35326 connected to 192.168.40.40 port 5201
[ 17] local 192.168.55.21 port 35336 connected to 192.168.40.40 port 5201
[ 19] local 192.168.55.21 port 35344 connected to 192.168.40.40 port 5201
[ ID] Interval           Transfer     Bitrate
[  5]   0.00-1.00   sec   136 MBytes  1.14 Gbits/sec
[  7]   0.00-1.00   sec   113 MBytes   944 Mbits/sec
[  9]   0.00-1.00   sec  60.5 MBytes   507 Mbits/sec
[ 11]   0.00-1.00   sec  38.1 MBytes   319 Mbits/sec
[ 13]   0.00-1.00   sec  60.5 MBytes   507 Mbits/sec
[ 15]   0.00-1.00   sec  29.2 MBytes   245 Mbits/sec
[ 17]   0.00-1.00   sec   116 MBytes   970 Mbits/sec
[ 19]   0.00-1.00   sec  81.1 MBytes   680 Mbits/sec
[SUM]   0.00-1.00   sec   634 MBytes  5.32 Gbits/sec
- - - - - - - - - - - - - - - - - - - - - - - - -
[  5]   1.00-2.00   sec   121 MBytes  1.02 Gbits/sec
[  7]   1.00-2.00   sec  93.2 MBytes   782 Mbits/sec
[  9]   1.00-2.00   sec  62.2 MBytes   522 Mbits/sec
[ 11]   1.00-2.00   sec  45.8 MBytes   384 Mbits/sec
[ 13]   1.00-2.00   sec  68.8 MBytes   577 Mbits/sec
[ 15]   1.00-2.00   sec  39.6 MBytes   332 Mbits/sec
[ 17]   1.00-2.00   sec  85.9 MBytes   720 Mbits/sec
[ 19]   1.00-2.00   sec  69.2 MBytes   581 Mbits/sec
[SUM]   1.00-2.00   sec   586 MBytes  4.92 Gbits/sec
- - - - - - - - - - - - - - - - - - - - - - - - -
[  5]   2.00-3.00   sec   148 MBytes  1.24 Gbits/sec
[  7]   2.00-3.00   sec   138 MBytes  1.16 Gbits/sec
[  9]   2.00-3.00   sec  37.5 MBytes   315 Mbits/sec
[ 11]   2.00-3.00   sec  20.2 MBytes   170 Mbits/sec
[ 13]   2.00-3.00   sec  94.4 MBytes   792 Mbits/sec
[ 15]   2.00-3.00   sec  22.5 MBytes   189 Mbits/sec
[ 17]   2.00-3.00   sec   136 MBytes  1.14 Gbits/sec
[ 19]   2.00-3.00   sec  71.6 MBytes   601 Mbits/sec
[SUM]   2.00-3.00   sec   668 MBytes  5.61 Gbits/sec
- - - - - - - - - - - - - - - - - - - - - - - - -
[  5]   3.00-4.00   sec   130 MBytes  1.09 Gbits/sec
[  7]   3.00-4.00   sec  86.5 MBytes   725 Mbits/sec
[  9]   3.00-4.00   sec  71.5 MBytes   599 Mbits/sec
[ 11]   3.00-4.00   sec  36.6 MBytes   307 Mbits/sec
[ 13]   3.00-4.00   sec  84.1 MBytes   705 Mbits/sec
[ 15]   3.00-4.00   sec  62.5 MBytes   524 Mbits/sec
[ 17]   3.00-4.00   sec   112 MBytes   935 Mbits/sec
[ 19]   3.00-4.00   sec  58.5 MBytes   490 Mbits/sec
[SUM]   3.00-4.00   sec   642 MBytes  5.38 Gbits/sec
- - - - - - - - - - - - - - - - - - - - - - - - -
[  5]   4.00-5.00   sec   112 MBytes   942 Mbits/sec
[  7]   4.00-5.00   sec   106 MBytes   888 Mbits/sec
[  9]   4.00-5.00   sec  76.9 MBytes   645 Mbits/sec
[ 11]   4.00-5.00   sec  38.8 MBytes   325 Mbits/sec
[ 13]   4.00-5.00   sec  81.1 MBytes   681 Mbits/sec
[ 15]   4.00-5.00   sec  58.8 MBytes   493 Mbits/sec
[ 17]   4.00-5.00   sec   110 MBytes   925 Mbits/sec
[ 19]   4.00-5.00   sec  71.1 MBytes   597 Mbits/sec
[SUM]   4.00-5.00   sec   655 MBytes  5.49 Gbits/sec
- - - - - - - - - - - - - - - - - - - - - - - - -
[  5]   5.00-6.00   sec   113 MBytes   946 Mbits/sec
[  7]   5.00-6.00   sec   107 MBytes   897 Mbits/sec
[  9]   5.00-6.00   sec  46.4 MBytes   389 Mbits/sec
[ 11]   5.00-6.00   sec  23.6 MBytes   198 Mbits/sec
[ 13]   5.00-6.00   sec  84.1 MBytes   706 Mbits/sec
[ 15]   5.00-6.00   sec  28.1 MBytes   236 Mbits/sec
[ 17]   5.00-6.00   sec   110 MBytes   924 Mbits/sec
[ 19]   5.00-6.00   sec  84.1 MBytes   706 Mbits/sec
[SUM]   5.00-6.00   sec   596 MBytes  5.00 Gbits/sec
- - - - - - - - - - - - - - - - - - - - - - - - -
[  5]   6.00-7.00   sec   123 MBytes  1.03 Gbits/sec
[  7]   6.00-7.00   sec   103 MBytes   867 Mbits/sec
[  9]   6.00-7.00   sec  58.5 MBytes   491 Mbits/sec
[ 11]   6.00-7.00   sec  14.8 MBytes   124 Mbits/sec
[ 13]   6.00-7.00   sec  67.1 MBytes   563 Mbits/sec
[ 15]   6.00-7.00   sec  26.4 MBytes   221 Mbits/sec
[ 17]   6.00-7.00   sec  87.0 MBytes   730 Mbits/sec
[ 19]   6.00-7.00   sec  97.1 MBytes   815 Mbits/sec
[SUM]   6.00-7.00   sec   577 MBytes  4.84 Gbits/sec
- - - - - - - - - - - - - - - - - - - - - - - - -
[  5]   7.00-8.00   sec   107 MBytes   901 Mbits/sec
[  7]   7.00-8.00   sec   137 MBytes  1.15 Gbits/sec
[  9]   7.00-8.00   sec  59.1 MBytes   496 Mbits/sec
[ 11]   7.00-8.00   sec  43.4 MBytes   364 Mbits/sec
[ 13]   7.00-8.00   sec  70.0 MBytes   587 Mbits/sec
[ 15]   7.00-8.00   sec  20.5 MBytes   172 Mbits/sec
[ 17]   7.00-8.00   sec   125 MBytes  1.05 Gbits/sec
[ 19]   7.00-8.00   sec  62.8 MBytes   526 Mbits/sec
[SUM]   7.00-8.00   sec   625 MBytes  5.24 Gbits/sec
- - - - - - - - - - - - - - - - - - - - - - - - -
[  5]   8.00-9.00   sec   112 MBytes   942 Mbits/sec
[  7]   8.00-9.00   sec   118 MBytes   986 Mbits/sec
[  9]   8.00-9.00   sec  60.6 MBytes   509 Mbits/sec
[ 11]   8.00-9.00   sec  57.0 MBytes   478 Mbits/sec
[ 13]   8.00-9.00   sec  50.9 MBytes   427 Mbits/sec
[ 15]   8.00-9.00   sec  24.5 MBytes   206 Mbits/sec
[ 17]   8.00-9.00   sec   109 MBytes   913 Mbits/sec
[ 19]   8.00-9.00   sec  61.1 MBytes   513 Mbits/sec
[SUM]   8.00-9.00   sec   593 MBytes  4.97 Gbits/sec
- - - - - - - - - - - - - - - - - - - - - - - - -
[  5]   9.00-10.00  sec   146 MBytes  1.22 Gbits/sec
[  7]   9.00-10.00  sec   147 MBytes  1.23 Gbits/sec
[  9]   9.00-10.00  sec  21.0 MBytes   176 Mbits/sec
[ 11]   9.00-10.00  sec  19.8 MBytes   166 Mbits/sec
[ 13]   9.00-10.00  sec  84.9 MBytes   712 Mbits/sec
[ 15]   9.00-10.00  sec  11.8 MBytes  98.6 Mbits/sec
[ 17]   9.00-10.00  sec   108 MBytes   905 Mbits/sec
[ 19]   9.00-10.00  sec  75.5 MBytes   633 Mbits/sec
[SUM]   9.00-10.00  sec   613 MBytes  5.14 Gbits/sec
- - - - - - - - - - - - - - - - - - - - - - - - -
[ ID] Interval           Transfer     Bitrate         Retr
[  5]   0.00-10.00  sec  1.22 GBytes  1.05 Gbits/sec    5            sender
[  5]   0.00-10.00  sec  1.22 GBytes  1.05 Gbits/sec                  receiver
[  7]   0.00-10.00  sec  1.12 GBytes   963 Mbits/sec    3            sender
[  7]   0.00-10.00  sec  1.12 GBytes   963 Mbits/sec                  receiver
[  9]   0.00-10.00  sec   555 MBytes   465 Mbits/sec    2            sender
[  9]   0.00-10.00  sec   554 MBytes   465 Mbits/sec                  receiver
[ 11]   0.00-10.00  sec   338 MBytes   284 Mbits/sec    2            sender
[ 11]   0.00-10.00  sec   338 MBytes   284 Mbits/sec                  receiver
[ 13]   0.00-10.00  sec   746 MBytes   626 Mbits/sec    4            sender
[ 13]   0.00-10.00  sec   746 MBytes   626 Mbits/sec                  receiver
[ 15]   0.00-10.00  sec   324 MBytes   272 Mbits/sec    3            sender
[ 15]   0.00-10.00  sec   324 MBytes   272 Mbits/sec                  receiver
[ 17]   0.00-10.00  sec  1.07 GBytes   921 Mbits/sec    5            sender
[ 17]   0.00-10.00  sec  1.07 GBytes   921 Mbits/sec                  receiver
[ 19]   0.00-10.00  sec   733 MBytes   615 Mbits/sec    2            sender
[ 19]   0.00-10.00  sec   732 MBytes   614 Mbits/sec                  receiver
[SUM]   0.00-10.00  sec  6.05 GBytes  5.19 Gbits/sec   26             sender
[SUM]   0.00-10.00  sec  6.04 GBytes  5.19 Gbits/sec                  receiver

iperf Done.
and
root@PROXMOX1:~# iperf3 -c 192.168.40.40 -P 8 -w 256K Connecting to host 192.168.40.40, port 5201 [ 5] local 192.168.55.21 port 45124 connected to 192.168.40.40 port 5201 [ 7] local 192.168.55.21 port 45138 connected to 192.168.40.40 port 5201 [ 9] local 192.168.55.21 port 45150 connected to 192.168.40.40 port 5201 [ 11] local 192.168.55.21 port 45154 connected to 192.168.40.40 port 5201 [ 13] local 192.168.55.21 port 45162 connected to 192.168.40.40 port 5201 [ 15] local 192.168.55.21 port 45174 connected to 192.168.40.40 port 5201 [ 17] local 192.168.55.21 port 45176 connected to 192.168.40.40 port 5201 [ 19] local 192.168.55.21 port 45190 connected to 192.168.40.40 port 5201 [ ID] Interval Transfer Bitrate Retr Cwnd [ 5] 0.00-1.00 sec 68.9 MBytes 577 Mbits/sec 4 219 KBytes [ 7] 0.00-1.00 sec 88.6 MBytes 743 Mbits/sec 3 212 KBytes [ 9] 0.00-1.00 sec 78.0 MBytes 654 Mbits/sec 2 216 KBytes [ 11] 0.00-1.00 sec 76.8 MBytes 643 Mbits/sec 2 218 KBytes [ 13] 0.00-1.00 sec 77.8 MBytes 652 Mbits/sec 1 331 KBytes [ 15] 0.00-1.00 sec 73.9 MBytes 619 Mbits/sec 2 218 KBytes [ 17] 0.00-1.00 sec 64.9 MBytes 544 Mbits/sec 7 215 KBytes [ 19] 0.00-1.00 sec 81.4 MBytes 682 Mbits/sec 1 215 KBytes [SUM] 0.00-1.00 sec 610 MBytes 5.11 Gbits/sec 22 - - - - - - - - - - - - - - - - - - - - - - - - - [ 5] 1.00-2.00 sec 68.8 MBytes 577 Mbits/sec 2 219 KBytes [ 7] 1.00-2.00 sec 88.2 MBytes 740 Mbits/sec 1 212 KBytes [ 9] 1.00-2.00 sec 78.4 MBytes 657 Mbits/sec 4 216 KBytes [ 11] 1.00-2.00 sec 76.6 MBytes 643 Mbits/sec 0 218 KBytes [ 13] 1.00-2.00 sec 76.4 MBytes 641 Mbits/sec 1 331 KBytes [ 15] 1.00-2.00 sec 71.2 MBytes 598 Mbits/sec 4 218 KBytes [ 17] 1.00-2.00 sec 63.1 MBytes 530 Mbits/sec 2 215 KBytes [ 19] 1.00-2.00 sec 83.8 MBytes 703 Mbits/sec 2 215 KBytes [SUM] 1.00-2.00 sec 606 MBytes 5.09 Gbits/sec 16 - - - - - - - - - - - - - - - - - - - - - - - - - [ 5] 2.00-3.00 sec 66.1 MBytes 555 Mbits/sec 2 219 KBytes [ 7] 2.00-3.00 sec 92.1 MBytes 774 Mbits/sec 0 212 KBytes [ 9] 2.00-3.00 sec 78.2 MBytes 657 Mbits/sec 4 216 KBytes [ 11] 2.00-3.00 sec 80.4 MBytes 675 Mbits/sec 2 218 KBytes [ 13] 2.00-3.00 sec 76.0 MBytes 638 Mbits/sec 1 331 KBytes [ 15] 2.00-3.00 sec 72.1 MBytes 606 Mbits/sec 5 218 KBytes [ 17] 2.00-3.00 sec 60.4 MBytes 507 Mbits/sec 3 215 KBytes [ 19] 2.00-3.00 sec 80.4 MBytes 675 Mbits/sec 3 215 KBytes [SUM] 2.00-3.00 sec 606 MBytes 5.09 Gbits/sec 20 - - - - - - - - - - - - - - - - - - - - - - - - - [ 5] 3.00-4.00 sec 55.4 MBytes 464 Mbits/sec 3 219 KBytes [ 7] 3.00-4.00 sec 88.9 MBytes 745 Mbits/sec 2 212 KBytes [ 9] 3.00-4.00 sec 82.1 MBytes 688 Mbits/sec 2 216 KBytes [ 11] 3.00-4.00 sec 75.4 MBytes 632 Mbits/sec 3 218 KBytes [ 13] 3.00-4.00 sec 86.9 MBytes 728 Mbits/sec 4 331 KBytes [ 15] 3.00-4.00 sec 83.6 MBytes 701 Mbits/sec 1 218 KBytes [ 17] 3.00-4.00 sec 53.2 MBytes 446 Mbits/sec 5 215 KBytes [ 19] 3.00-4.00 sec 65.8 MBytes 551 Mbits/sec 6 215 KBytes [SUM] 3.00-4.00 sec 591 MBytes 4.96 Gbits/sec 26 - - - - - - - - - - - - - - - - - - - - - - - - - [ 5] 4.00-5.00 sec 56.1 MBytes 471 Mbits/sec 1 219 KBytes [ 7] 4.00-5.00 sec 87.0 MBytes 730 Mbits/sec 2 212 KBytes [ 9] 4.00-5.00 sec 84.6 MBytes 710 Mbits/sec 3 216 KBytes [ 11] 4.00-5.00 sec 70.8 MBytes 593 Mbits/sec 4 218 KBytes [ 13] 4.00-5.00 sec 84.1 MBytes 706 Mbits/sec 0 331 KBytes [ 15] 4.00-5.00 sec 84.9 MBytes 712 Mbits/sec 3 218 KBytes [ 17] 4.00-5.00 sec 59.1 MBytes 496 Mbits/sec 3 215 KBytes [ 19] 4.00-5.00 sec 67.4 MBytes 565 Mbits/sec 8 215 KBytes [SUM] 4.00-5.00 sec 594 MBytes 4.98 Gbits/sec 24 - - - - - - - - - - - - - - - - - - - - - - - - - [ 5] 5.00-6.00 sec 62.9 MBytes 527 Mbits/sec 1 219 KBytes [ 7] 5.00-6.00 sec 85.2 MBytes 715 Mbits/sec 1 212 KBytes [ 9] 5.00-6.00 sec 88.5 MBytes 742 Mbits/sec 1 216 KBytes [ 11] 5.00-6.00 sec 70.1 MBytes 588 Mbits/sec 1 218 KBytes [ 13] 5.00-6.00 sec 80.9 MBytes 678 Mbits/sec 2 331 KBytes [ 15] 5.00-6.00 sec 87.8 MBytes 736 Mbits/sec 1 218 KBytes [ 17] 5.00-6.00 sec 63.6 MBytes 534 Mbits/sec 3 215 KBytes [ 19] 5.00-6.00 sec 69.9 MBytes 586 Mbits/sec 3 215 KBytes [SUM] 5.00-6.00 sec 609 MBytes 5.11 Gbits/sec 13 - - - - - - - - - - - - - - - - - - - - - - - - - [ 5] 6.00-7.00 sec 61.0 MBytes 512 Mbits/sec 1 219 KBytes [ 7] 6.00-7.00 sec 102 MBytes 856 Mbits/sec 2 212 KBytes [ 9] 6.00-7.00 sec 64.2 MBytes 539 Mbits/sec 1 216 KBytes [ 11] 6.00-7.00 sec 97.4 MBytes 817 Mbits/sec 0 218 KBytes [ 13] 6.00-7.00 sec 81.5 MBytes 684 Mbits/sec 0 331 KBytes [ 15] 6.00-7.00 sec 65.8 MBytes 552 Mbits/sec 8 218 KBytes [ 17] 6.00-7.00 sec 50.1 MBytes 420 Mbits/sec 8 215 KBytes [ 19] 6.00-7.00 sec 89.9 MBytes 754 Mbits/sec 2 215 KBytes [SUM] 6.00-7.00 sec 612 MBytes 5.13 Gbits/sec 22 - - - - - - - - - - - - - - - - - - - - - - - - - [ 5] 7.00-8.00 sec 64.2 MBytes 539 Mbits/sec 0 219 KBytes [ 7] 7.00-8.00 sec 92.4 MBytes 775 Mbits/sec 2 212 KBytes [ 9] 7.00-8.00 sec 71.0 MBytes 596 Mbits/sec 4 216 KBytes [ 11] 7.00-8.00 sec 90.1 MBytes 756 Mbits/sec 4 218 KBytes [ 13] 7.00-8.00 sec 80.1 MBytes 672 Mbits/sec 0 331 KBytes [ 15] 7.00-8.00 sec 68.4 MBytes 574 Mbits/sec 5 218 KBytes [ 17] 7.00-8.00 sec 53.6 MBytes 450 Mbits/sec 3 215 KBytes [ 19] 7.00-8.00 sec 84.2 MBytes 707 Mbits/sec 4 215 KBytes [SUM] 7.00-8.00 sec 604 MBytes 5.07 Gbits/sec 22 - - - - - - - - - - - - - - - - - - - - - - - - - [ 5] 8.00-9.00 sec 68.2 MBytes 572 Mbits/sec 2 219 KBytes [ 7] 8.00-9.00 sec 94.2 MBytes 790 Mbits/sec 2 212 KBytes [ 9] 8.00-9.00 sec 70.4 MBytes 590 Mbits/sec 1 216 KBytes [ 11] 8.00-9.00 sec 84.9 MBytes 712 Mbits/sec 2 218 KBytes [ 13] 8.00-9.00 sec 79.8 MBytes 669 Mbits/sec 1 331 KBytes [ 15] 8.00-9.00 sec 64.9 MBytes 544 Mbits/sec 3 218 KBytes [ 17] 8.00-9.00 sec 57.1 MBytes 479 Mbits/sec 6 215 KBytes [ 19] 8.00-9.00 sec 87.4 MBytes 733 Mbits/sec 1 215 KBytes [SUM] 8.00-9.00 sec 607 MBytes 5.09 Gbits/sec 18 - - - - - - - - - - - - - - - - - - - - - - - - - [ 5] 9.00-10.00 sec 62.0 MBytes 520 Mbits/sec 2 219 KBytes [ 7] 9.00-10.00 sec 91.6 MBytes 768 Mbits/sec 1 212 KBytes [ 9] 9.00-10.00 sec 73.0 MBytes 612 Mbits/sec 2 216 KBytes [ 11] 9.00-10.00 sec 87.6 MBytes 734 Mbits/sec 3 218 KBytes [ 13] 9.00-10.00 sec 81.1 MBytes 680 Mbits/sec 0 331 KBytes [ 15] 9.00-10.00 sec 72.9 MBytes 611 Mbits/sec 2 218 KBytes [ 17] 9.00-10.00 sec 59.0 MBytes 494 Mbits/sec 3 215 KBytes [ 19] 9.00-10.00 sec 86.2 MBytes 723 Mbits/sec 2 215 KBytes [SUM] 9.00-10.00 sec 614 MBytes 5.14 Gbits/sec 15 - - - - - - - - - - - - - - - - - - - - - - - - - [ ID] Interval Transfer Bitrate Retr [ 5] 0.00-10.00 sec 634 MBytes 531 Mbits/sec 18 sender [ 5] 0.00-10.00 sec 633 MBytes 531 Mbits/sec receiver [ 7] 0.00-10.00 sec 910 MBytes 764 Mbits/sec 16 sender [ 7] 0.00-10.00 sec 910 MBytes 763 Mbits/sec receiver [ 9] 0.00-10.00 sec 768 MBytes 645 Mbits/sec 24 sender [ 9] 0.00-10.00 sec 768 MBytes 644 Mbits/sec receiver [ 11] 0.00-10.00 sec 810 MBytes 679 Mbits/sec 21 sender [ 11] 0.00-10.00 sec 810 MBytes 679 Mbits/sec receiver [ 13] 0.00-10.00 sec 804 MBytes 675 Mbits/sec 10 sender [ 13] 0.00-10.00 sec 804 MBytes 674 Mbits/sec receiver [ 15] 0.00-10.00 sec 745 MBytes 625 Mbits/sec 34 sender [ 15] 0.00-10.00 sec 745 MBytes 625 Mbits/sec receiver [ 17] 0.00-10.00 sec 584 MBytes 490 Mbits/sec 43 sender [ 17] 0.00-10.00 sec 584 MBytes 490 Mbits/sec receiver [ 19] 0.00-10.00 sec 796 MBytes 668 Mbits/sec 32 sender [ 19] 0.00-10.00 sec 796 MBytes 667 Mbits/sec receiver [SUM] 0.00-10.00 sec 5.91 GBytes 5.08 Gbits/sec 198 sender [SUM] 0.00-10.00 sec 5.91 GBytes 5.07 Gbits/sec receiver iperf Done.@pwood999 Sorry if I was not clear earlier, pf is running on bare metal xeon. I use Proxmox for testing because it is a suitable beefy server with high speed nic.
pfsense box >>>2X25G SFP28 LAGG Trunk (main connection)>>>> switch
-
And the different subnets are all VLANs across that LAGG with pfSense routing between them I assume?
-
@stephenw10 exactly
-
Did a quick test in my work lab today.
- Host is ESXI on a 40-core DELL with 192GB memory & 10TB SSD.
- PfSense 2.7.2 running in ESXI with 10G interfaces. WAN Public IP connects to an external Juniper MX80 router.
- Another interface on the MX80 has our speedtest server with iperf3 running under Ubuntu.
- Client PC is windows10 VM with 12 CPU & 32GB memory.
So iperf3 traffic goes as follows, and achieves about 8-9Gbps.
Client-VM <--> PfSense <--> MX80 <--> iperf3_Server.
Downstream Test.
[ ID] Interval Transfer Bitrate Retr
[ 5] 0.00-10.01 sec 1.43 GBytes 1.23 Gbits/sec 1279 sender
[ 5] 0.00-10.00 sec 1.43 GBytes 1.23 Gbits/sec receiver
[ 7] 0.00-10.01 sec 1.74 GBytes 1.49 Gbits/sec 408 sender
[ 7] 0.00-10.00 sec 1.74 GBytes 1.49 Gbits/sec receiver
[ 9] 0.00-10.01 sec 1.77 GBytes 1.52 Gbits/sec 604 sender
[ 9] 0.00-10.00 sec 1.77 GBytes 1.52 Gbits/sec receiver
[ 11] 0.00-10.01 sec 1.01 GBytes 868 Mbits/sec 480 sender
[ 11] 0.00-10.00 sec 1.01 GBytes 866 Mbits/sec receiver
[ 13] 0.00-10.01 sec 1.78 GBytes 1.52 Gbits/sec 777 sender
[ 13] 0.00-10.00 sec 1.77 GBytes 1.52 Gbits/sec receiver
[ 15] 0.00-10.01 sec 881 MBytes 739 Mbits/sec 838 sender
[ 15] 0.00-10.00 sec 879 MBytes 738 Mbits/sec receiver
[ 17] 0.00-10.01 sec 1010 MBytes 847 Mbits/sec 522 sender
[ 17] 0.00-10.00 sec 1007 MBytes 845 Mbits/sec receiver
[ 19] 0.00-10.01 sec 908 MBytes 761 Mbits/sec 1038 sender
[ 19] 0.00-10.00 sec 904 MBytes 759 Mbits/sec receiver
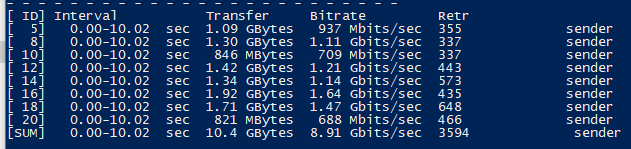
[SUM] 0.00-10.01 sec 10.5 GBytes 8.98 Gbits/sec 5946 sender
[SUM] 0.00-10.00 sec 10.4 GBytes 8.97 Gbits/sec receiverUpstream (without -R) only gets about 4-5Gbps, so not sure about that.
Note: this was a quick & dirty test with no optimisation of the ESXI 10G virtual NIC's etc, and no packages, limiters, etc on PfSense. Will upgrade to 2.8.x and see what happens.
-
Upgraded to 2.8.1 but no real difference. with GUI logged in I'm getting about 4.5-4.7Gbps Upstream, but with GUI logged out it increases to 5.1Gbps.
DS is the same at just over 9Gbps.
-
@pwood999 thanks for that, I suspect the 25G LAG connection to the downstream switch. I will try to disable the LAG and see what happens with another test.
And according to your test even with a simple setup, how come you could not achieve 10g both ways?
-
Ok well I'd try setting 8 queues on that system since I'd expect that NIC to suppprt them:
dev.ixl.0.iflib.override_nrxqs: # of rxqs to use, 0 => use default #
dev.ixl.0.iflib.override_ntxqs: # of txqs to use, 0 => use default #
You might also bump the queue descriptors:
dev.ixl.0.iflib.override_nrxds: list of # of RX descriptors to use, 0 = use default # dev.ixl.0.iflib.override_ntxds: list of # of TX descriptors to use, 0 = use default # -
@Laxarus I suspect it's a limitation on the iperf server. I tried WinVM to PfSense and get around 7.5-8.5G both ways.
PFsense client to the server seems limited on upstream to about 6Gbps. Not sure why yet, because we definitely got 8.5Gbps symmetric over XGS-PON using the same server. [UPDATE] just tried another Ubuntu VM with direct connection to the Juniper MX80 and that gets 8.7-9.4Gbps both ways with iperf3.
When I'm next in the Lab, I plan to connect our Excentis ByteBlower to the PfSense and try that. Much better traffic generator than iperf3, and I can then try UDP / TCP at various DS & US rates individually & simultaneous. It also allows me to set the packet payload to ensure no fragmentation
-
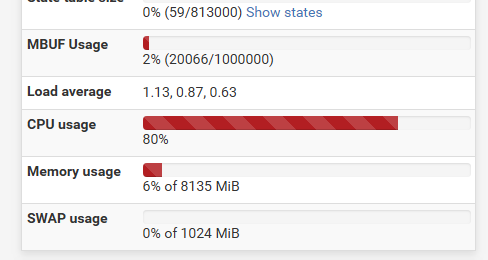
Another thing I noticed when running iperf for 30 seconds, is the PfSense CPU ramps up in stages. It goes to 27% after about 5secs, and then 45% 5 secs later, and finally about 80% for the remainder of the run.
Try adding this option "--get-server-output" and check the retries on the packet flows. That will reduce the effective data payload bitrate.
-
@stephenw10 how to modify these?
directly creating /boot/loader.conf.local and adding below ?# NIC queues dev.ixl.0.iflib.override_nrxqs="8" dev.ixl.0.iflib.override_ntxqs="8" dev.ixl.1.iflib.override_nrxqs="8" dev.ixl.1.iflib.override_ntxqs="8" # Queue descriptors dev.ixl.0.iflib.override_nrxds="2048" dev.ixl.0.iflib.override_ntxds="2048" dev.ixl.1.iflib.override_nrxds="2048" dev.ixl.1.iflib.override_ntxds="2048"Also If I increase the queues on both ix1 and ix2, then won't I be over-committing my cpu cores?
@pwood999 said in Cannot Achieve 10g pfsense bottleneck:
Try adding this option "--get-server-output" and check the retries on the packet flows. That will reduce the effective data payload bitrate.
will try that
-
Yes I would try that. Those values appear to be sysctls, you can rewrote them at runtime. but I'd expect to need to reload the driver to see that. So setting it as loader values might make more sense.
7 out of your 8 cores are 50% idle so adding more load shouldn't really be a bad thing IMO. You might also be able to achieve the same thing using core affinity with 4 queues. Right now it looks like you;re limited by 1 core that gets twice the loading somehow.
-
@stephenw10
Added these to /boot/loader.conf.local and rebooted the firewallthen
ixl1: netmap queues/slots: TX 8/2048, RX 8/2048
ixl1: SR-IOV ready
ixl1: PCI Express Bus: Speed 8.0GT/s Width x8
ixl1: Allocating 8 queues for PF LAN VSI; 8 queues active
ixl1: Ethernet address: 3c:ec:ec:dc:b3:a1
ixl1: Using MSI-X interrupts with 9 vectors
ixl1: Using 8 RX queues 8 TX queues
ixl1: Using 2048 TX descriptors and 2048 RX descriptors
ixl1: PF-ID[1]: VFs 64, MSI-X 129, VF MSI-X 5, QPs 768, MDIO & I2C
ixl1: fw 9.121.73281 api 1.15 nvm 9.20 etid 8000e153 oem 1.269.0
ixl1: <Intel(R) Ethernet Controller XXV710 for 25GbE SFP28 - 2.3.3-k> mem 0x38bffd000000-0x38bffdffffff,0x38bfff000000-0x38bfff007fff irq 40 at device 0.1 numa-domain 0 on pci7
ixl0: netmap queues/slots: TX 8/2048, RX 8/2048
ixl0: SR-IOV ready
ixl0: PCI Express Bus: Speed 8.0GT/s Width x8
ixl0: Allocating 8 queues for PF LAN VSI; 8 queues active
ixl0: Ethernet address: 3c:ec:ec:dc:b3:a2
ixl0: Using MSI-X interrupts with 9 vectors
ixl0: Using 8 RX queues 8 TX queues
ixl0: Using 2048 TX descriptors and 2048 RX descriptors
ixl0: PF-ID[0]: VFs 64, MSI-X 129, VF MSI-X 5, QPs 768, MDIO & I2C
ixl0: fw 9.121.73281 api 1.15 nvm 9.20 etid 8000e153 oem 1.269.0
ixl0: <Intel(R) Ethernet Controller XXV710 for 25GbE SFP28 - 2.3.3-k> mem 0x38bffe000000-0x38bffeffffff,0x38bfff008000-0x38bfff00ffff irq 40 at device 0.0 numa-domain 0 on pci7
idle
last pid: 28275;  load averages:    1.19,    1.84,    1.08                                      up 0+00:08:07  03:49:25
644 threads:   9 running, 603 sleeping, 32 waiting
CPU 0:  0.8% user,  0.0% nice,  0.4% system,  0.8% interrupt, 98.0% idle
CPU 1:  0.8% user,  0.0% nice,  0.0% system,  0.8% interrupt, 98.4% idle
CPU 2:  0.0% user,  0.0% nice,  2.0% system,  0.8% interrupt, 97.3% idle
CPU 3:  1.2% user,  0.0% nice,  0.0% system,  0.8% interrupt, 98.0% idle
CPU 4:  1.2% user,  0.0% nice,  2.0% system,  0.4% interrupt, 96.5% idle
CPU 5:  0.4% user,  0.0% nice,  0.0% system,  0.4% interrupt, 99.2% idle
CPU 6:  0.4% user,  0.0% nice,  0.4% system,  0.0% interrupt, 99.2% idle
CPU 7:  1.2% user,  0.0% nice,  0.0% system,  0.4% interrupt, 98.4% idle
Mem: 509M Active, 187M Inact, 2135M Wired, 28G Free
ARC: 297M Total, 138M MFU, 148M MRU, 140K Anon, 1880K Header, 8130K Other
     228M Compressed, 596M Uncompressed, 2.62:1 Ratio
Swap: 4096M Total, 4096M Free

  PID USERNAME    PRI NICE   SIZE    RES STATE    C   TIME    WCPU COMMAND
   11 root        187 ki31     0B   128K CPU1     1   6:12  98.71% [idle{idle: cpu1}]
   11 root        187 ki31     0B   128K CPU3     3   6:13  97.83% [idle{idle: cpu3}]
   11 root        187 ki31     0B   128K CPU4     4   6:18  97.72% [idle{idle: cpu4}]
   11 root        187 ki31     0B   128K RUN      6   6:18  97.53% [idle{idle: cpu6}]
   11 root        187 ki31     0B   128K CPU2     2   6:13  97.51% [idle{idle: cpu2}]
   11 root        187 ki31     0B   128K RUN      5   6:01  97.14% [idle{idle: cpu5}]
   11 root        187 ki31     0B   128K CPU7     7   5:59  97.12% [idle{idle: cpu7}]
   11 root        187 ki31     0B   128K CPU0     0   5:49  97.08% [idle{idle: cpu0}]
71284 www          24    0   142M    39M kqread   6   0:31   7.91% /usr/local/sbin/haproxy -f /var/etc/haproxy/haproxy.
   12 root        -60    -     0B   384K WAIT     0   1:00   1.64% [intr{swi1: netisr 1}]
    0 root        -60    -     0B  2352K -        0   1:48   1.34% [kernel{if_io_tqg_0}]
   12 root        -60    -     0B   384K WAIT     5   1:09   1.19% [intr{swi1: netisr 7}]
    0 root        -60    -     0B  2352K -        2   0:35   0.94% [kernel{if_io_tqg_2}]
   12 root        -60    -     0B   384K WAIT     4   0:28   0.93% [intr{swi1: netisr 5}]
and testing from win11 pc to a proxmox host
PS D:\Downloads\iperf3> .\iperf3.exe -c 192.168.55.21 -P 8 -w 256K -t 50
Connecting to host 192.168.55.21, port 5201
[  5] local 192.168.30.52 port 62052 connected to 192.168.55.21 port 5201
[  7] local 192.168.30.52 port 62053 connected to 192.168.55.21 port 5201
[  9] local 192.168.30.52 port 62054 connected to 192.168.55.21 port 5201
[ 11] local 192.168.30.52 port 62055 connected to 192.168.55.21 port 5201
[ 13] local 192.168.30.52 port 62056 connected to 192.168.55.21 port 5201
[ 15] local 192.168.30.52 port 62057 connected to 192.168.55.21 port 5201
[ 17] local 192.168.30.52 port 62058 connected to 192.168.55.21 port 5201
[ 19] local 192.168.30.52 port 62059 connected to 192.168.55.21 port 5201
[ ID] Interval           Transfer     Bitrate
[  5]   0.00-1.01   sec  79.2 MBytes   659 Mbits/sec
[  7]   0.00-1.01   sec  75.4 MBytes   627 Mbits/sec
[  9]   0.00-1.01   sec   106 MBytes   885 Mbits/sec
[ 11]   0.00-1.01   sec  96.5 MBytes   802 Mbits/sec
[ 13]   0.00-1.01   sec  86.1 MBytes   716 Mbits/sec
[ 15]   0.00-1.01   sec   101 MBytes   839 Mbits/sec
[ 17]   0.00-1.01   sec  51.1 MBytes   425 Mbits/sec
[ 19]   0.00-1.01   sec  68.2 MBytes   567 Mbits/sec
[SUM]   0.00-1.01   sec   664 MBytes  5.52 Gbits/sec
- - - - - - - - - - - - - - - - - - - - - - - - -
[  5]   1.01-2.01   sec  66.4 MBytes   557 Mbits/sec
[  7]   1.01-2.01   sec  76.8 MBytes   644 Mbits/sec
[  9]   1.01-2.01   sec   123 MBytes  1.03 Gbits/sec
[ 11]   1.01-2.01   sec  70.2 MBytes   589 Mbits/sec
[ 13]   1.01-2.01   sec  94.0 MBytes   788 Mbits/sec
[ 15]   1.01-2.01   sec   104 MBytes   873 Mbits/sec
[ 17]   1.01-2.01   sec  63.1 MBytes   529 Mbits/sec
[ 19]   1.01-2.01   sec  65.6 MBytes   550 Mbits/sec
[SUM]   1.01-2.01   sec   663 MBytes  5.56 Gbits/sec
- - - - - - - - - - - - - - - - - - - - - - - - -
[  5]   2.01-3.01   sec  86.8 MBytes   729 Mbits/sec
[  7]   2.01-3.01   sec  99.9 MBytes   840 Mbits/sec
[  9]   2.01-3.01   sec   106 MBytes   891 Mbits/sec
[ 11]   2.01-3.01   sec   110 MBytes   921 Mbits/sec
[ 13]   2.01-3.01   sec  41.9 MBytes   352 Mbits/sec
[ 15]   2.01-3.01   sec  78.2 MBytes   658 Mbits/sec
[ 17]   2.01-3.01   sec  25.2 MBytes   212 Mbits/sec
[ 19]   2.01-3.01   sec  53.8 MBytes   452 Mbits/sec
[SUM]   2.01-3.01   sec   601 MBytes  5.05 Gbits/sec
- - - - - - - - - - - - - - - - - - - - - - - - -
[  5]   3.01-4.00   sec  75.4 MBytes   635 Mbits/sec
[  7]   3.01-4.00   sec  84.6 MBytes   713 Mbits/sec
[  9]   3.01-4.00   sec   102 MBytes   860 Mbits/sec
[ 11]   3.01-4.00   sec   119 MBytes  1.01 Gbits/sec
[ 13]   3.01-4.00   sec  86.4 MBytes   727 Mbits/sec
[ 15]   3.01-4.00   sec  88.1 MBytes   742 Mbits/sec
[ 17]   3.01-4.00   sec  58.6 MBytes   494 Mbits/sec
[ 19]   3.01-4.00   sec  54.4 MBytes   458 Mbits/sec
[SUM]   3.01-4.00   sec   669 MBytes  5.63 Gbits/sec
still 5G
and the top results
last pid:  1910;  load averages:    5.12,    2.69,    1.53                                      up 0+00:11:13  03:52:31
644 threads:   15 running, 599 sleeping, 30 waiting
CPU 0:  0.0% user,  0.0% nice, 97.7% system,  0.4% interrupt,  2.0% idle
CPU 1:  0.8% user,  0.0% nice,  0.8% system, 31.3% interrupt, 67.2% idle
CPU 2:  1.6% user,  0.0% nice, 28.9% system, 15.2% interrupt, 54.3% idle
CPU 3:  0.8% user,  0.0% nice,  0.0% system, 59.8% interrupt, 39.5% idle
CPU 4:  1.2% user,  0.0% nice,  6.3% system, 74.6% interrupt, 18.0% idle
CPU 5:  0.8% user,  0.0% nice,  0.0% system, 35.9% interrupt, 63.3% idle
CPU 6:  0.8% user,  0.0% nice, 17.6% system, 25.4% interrupt, 56.3% idle
CPU 7:  2.3% user,  0.0% nice,  0.8% system, 44.1% interrupt, 52.7% idle
Mem: 507M Active, 188M Inact, 2136M Wired, 28G Free
ARC: 298M Total, 140M MFU, 146M MRU, 917K Anon, 1882K Header, 8181K Other
     228M Compressed, 596M Uncompressed, 2.62:1 Ratio
Swap: 4096M Total, 4096M Free

  PID USERNAME    PRI NICE   SIZE    RES STATE    C   TIME    WCPU COMMAND
    0 root        -60    -     0B  2352K CPU0     0   2:43  97.29% [kernel{if_io_tqg_0}]
   12 root        -60    -     0B   384K CPU4     4   1:45  94.90% [intr{swi1: netisr 1}]
   12 root        -60    -     0B   384K CPU3     3   2:15  87.69% [intr{swi1: netisr 7}]
   11 root        187 ki31     0B   128K RUN      1   8:23  65.80% [idle{idle: cpu1}]
   11 root        187 ki31     0B   128K RUN      5   8:05  63.96% [idle{idle: cpu5}]
   11 root        187 ki31     0B   128K CPU2     2   8:25  58.48% [idle{idle: cpu2}]
   11 root        187 ki31     0B   128K CPU6     6   8:36  57.28% [idle{idle: cpu6}]
   11 root        187 ki31     0B   128K CPU7     7   8:04  51.95% [idle{idle: cpu7}]
   12 root        -60    -     0B   384K WAIT     1   0:47  44.46% [intr{swi1: netisr 4}]
   11 root        187 ki31     0B   128K RUN      3   8:23  36.48% [idle{idle: cpu3}]
   12 root        -60    -     0B   384K WAIT     1   2:06  27.04% [intr{swi1: netisr 6}]
    0 root        -60    -     0B  2352K CPU2     2   0:52  26.96% [kernel{if_io_tqg_2}]
   12 root        -60    -     0B   384K WAIT     7   1:02  25.82% [intr{swi1: netisr 5}]
   11 root        187 ki31     0B   128K RUN      4   8:23  16.71% [idle{idle: cpu4}]
    0 root        -60    -     0B  2352K -        6   0:53  16.47% [kernel{if_io_tqg_6}]
71284 www          28    0   142M    39M CPU5     5   0:48  10.20% /usr/local/sbin/haproxy -f /var/etc/haproxy/haproxy.
   12 root        -60    -     0B   384K WAIT     6   1:06   7.50% [intr{swi1: netisr 2}]
    0 root        -60    -     0B  2352K RUN      4   0:58   6.71% [kernel{if_io_tqg_4}]
   11 root        187 ki31     0B   128K RUN      0   7:46   1.87% [idle{idle: cpu0}]
I still suspect something happening on the lag it should not be that hard to get 10g cross-vlan with the right infrastructure and I sure do have one.
-
Hmm, are you able to test without the lagg?
Just between the two ixl NICs directly?
-
@stephenw10 yeah, next step would be that. I need to arrange a time frame for a downtime. Will post the results.
-
@stephenw10 okay, all the tests done but it was a nightmare
I have done more than disabling lagg
updated the NIC firmware
updated the BIOS
reinstalled the pfsense with uefi boot instead of legacy
set my nic pci to EFI instead of legacy
disabled the laggnow it is a single SFP28 25G DAC cable
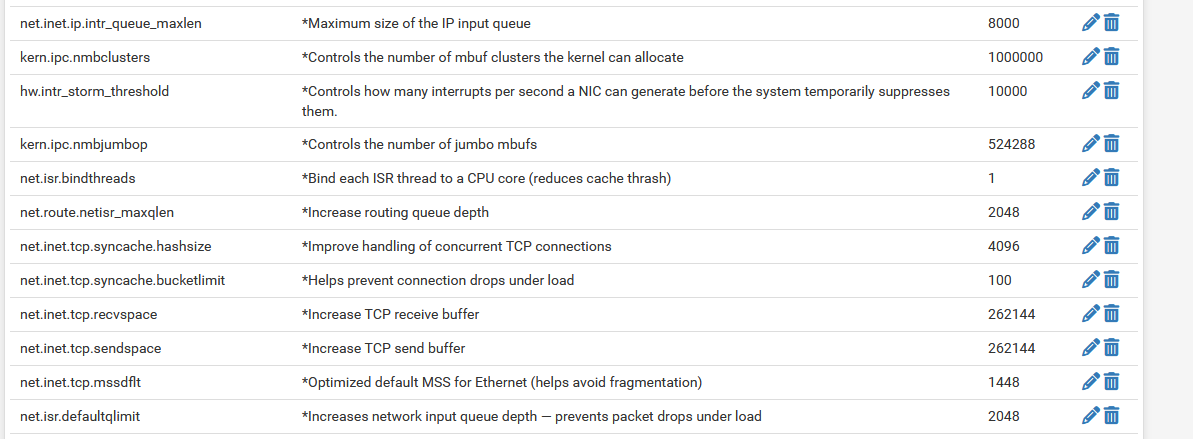
tuned some system variables
enabled Hardware TCP Segmentation Offloading
but still cannot get more than 5g.
Next step would be to use the actual 10g onboard NIC to see if the problem is with the 25G card.
any other troubleshooting steps are welcome
maybe this intel NIC does not play nice with pfsense
-
May I suggest to use jumbo frames if you do not use them already !
I changed every thing within the 10G part of my network including the pfSense lagg related to that to '9000' (netto), which did improve the trough put.
I did start a discussion about that a couple of month ago on the forum.
-
Do you still see one CPU core hitting 100% while the others are 50% idle?