pfsense 2.5.2 slowly leaking memory
-
I would have expected a better response from Netgate: "If it never exhausts it that may not be a problem" is a frankly irresponsible way to categorize memory issues for a company that sells hardware that is supposed to run on devices with limited cpu and memory 24/7. Perhaps this kind of attitude allowed to slip a terrible memory leak like pcscd into production.
Also what is the expectation here? Am I supposed to wait until all my memory is exhausted so my router goes down and suffer the consequences? I would rather be proactive than to be reactive.
Sorry if this sounds too harsh, but please take this as constructive criticism as I really am not trying to troll you or Netgate.
-
@netnerdy
I'm just a user of Netgate products but since the dawn of embedded devices there have been arguments around unused RAM.
One school is RAM should be 100% used the other is basically "you should always have 20% free RAM just in case".If you have unused RAM you are not near capacity.
Is this device using ZFS or standard UFS? That makes a difference.One also needs to understand the different types of memory: wired is basically kernel owned can't really be freed quickly. Cache and Free are self explanatory, Inactive is typically "was used but isn't now and should be freed next".
The position "if it never exhausts it may not be a problem" is technically accurate. Think garbage collection or lazy releasing of memory; so "it's allocated right now but in secs it's freed".
-
-
@netnerdy said in pfsense 2.5.2 slowly leaking memory:
Also what is the expectation here? Am I supposed to wait until all my memory is exhausted so my router goes down and suffer the consequences? I would rather be proactive than to be reactive.
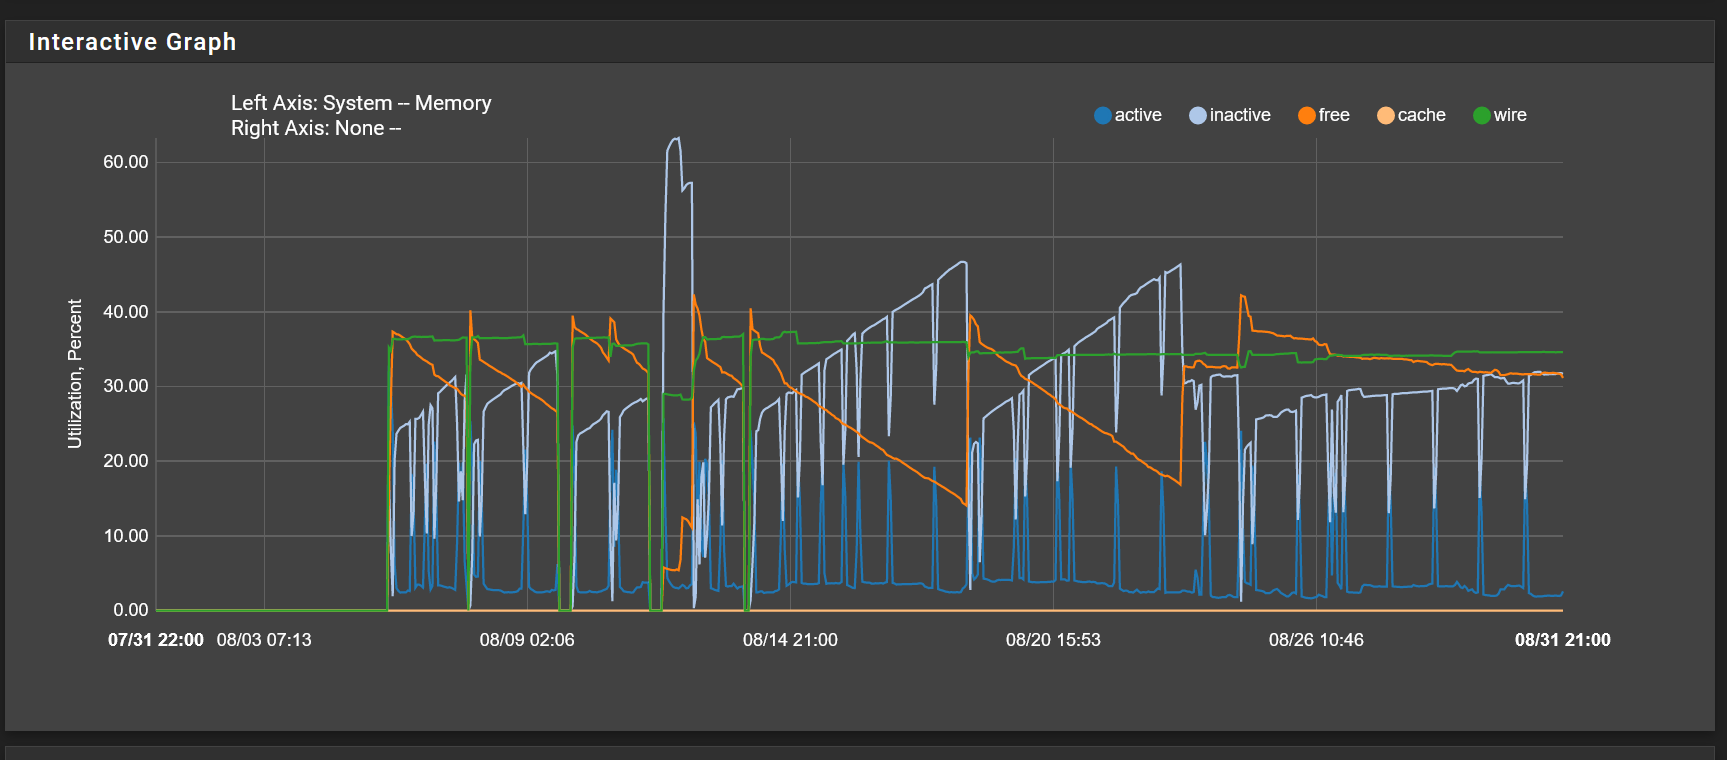
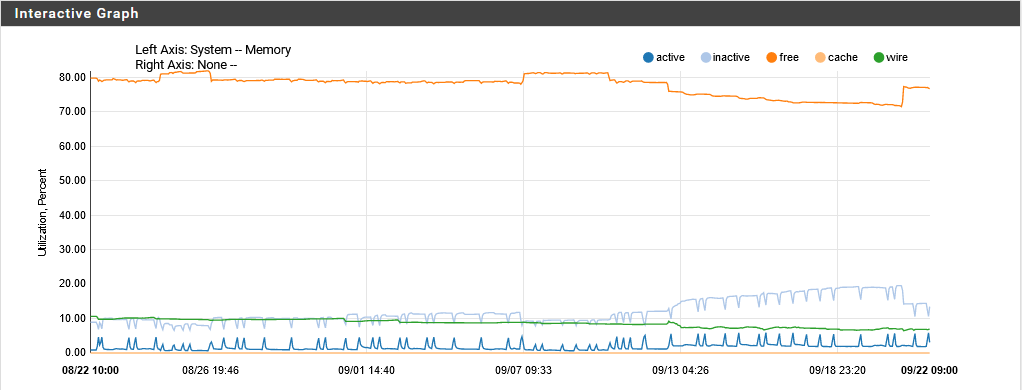
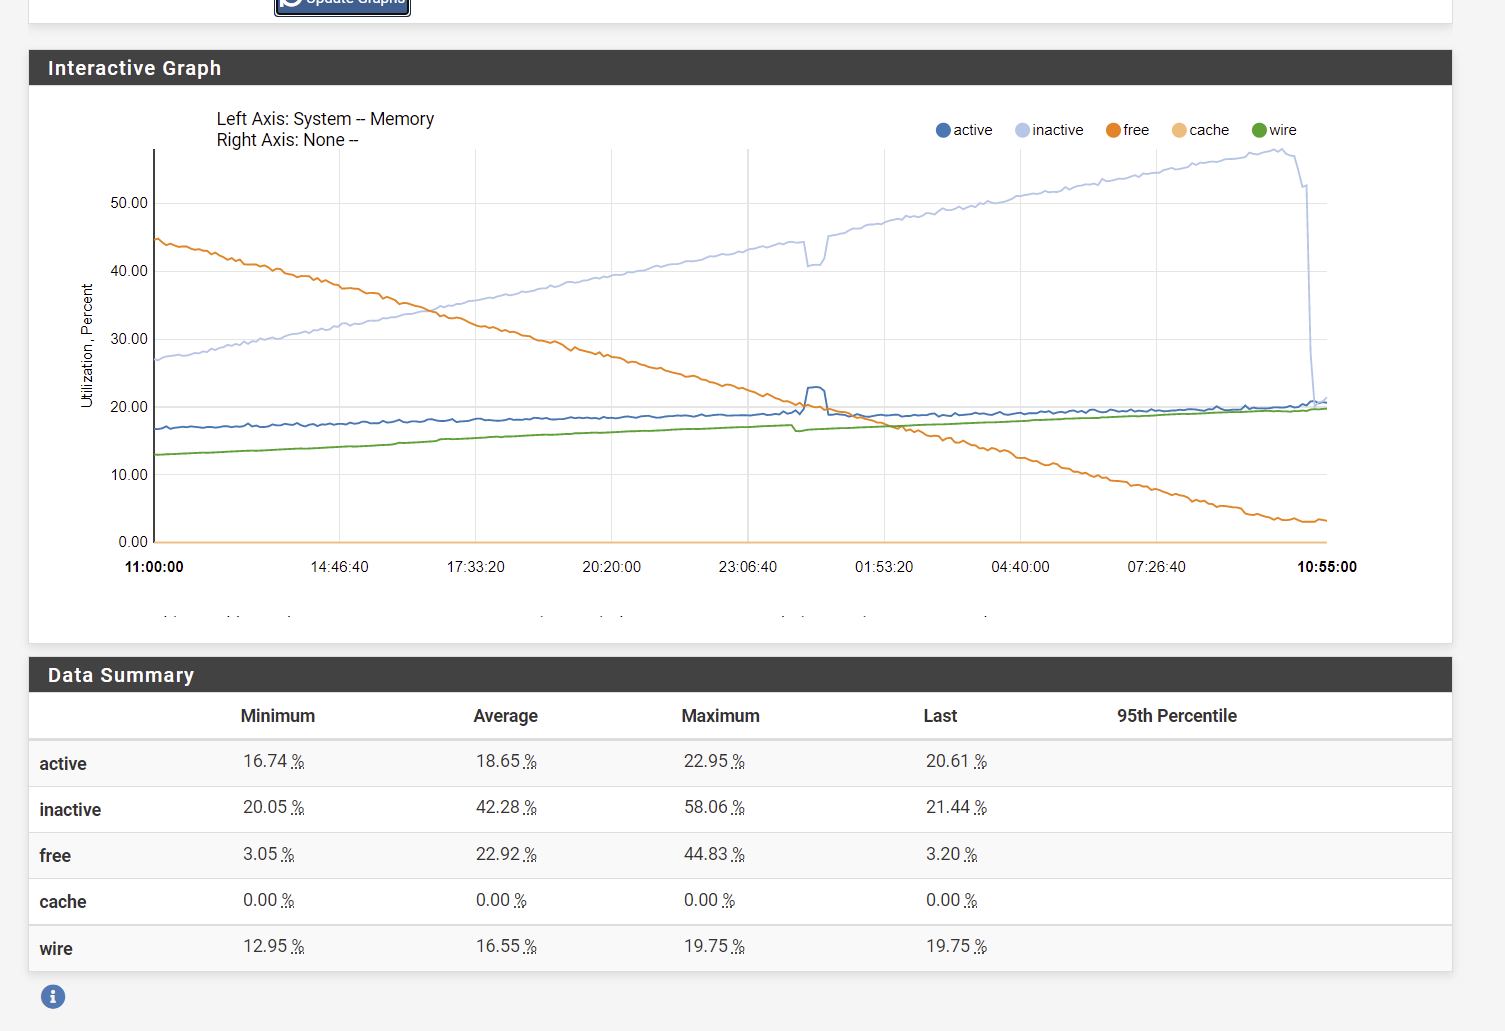
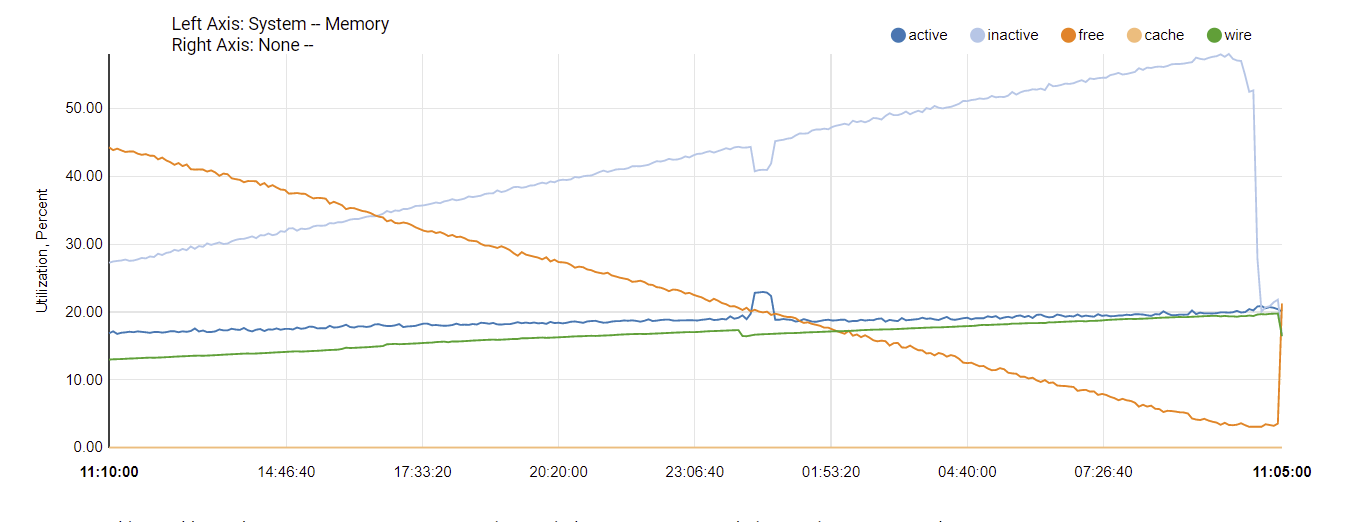
I'm asking if it's actually a leak or just something using memory because your graph in the first screenshot looks to be leveling off at ~30% which generally wouldn't worry me.
The actual used memory value will vary wildly with how much RAM you have installed and what packages you're running. 30% of 64GB with no packages would be unexpected.
If it is a linear usage rise that characterises a memory leak then that's obviously a problem.
In which case check what is using the memory.Steve
-
Sorry if misunderstood, thx for the clarification. Unfortunately, I had to reboot my router for another reason so I'll need to wait a week to answer your question.
I started paying attention to mem usage just because of the pcscd leak. When I saw the second drop I was worried. I would be totally content with the explanation of "this kind of mem usage trend is by design", which seems to be case. I'll revive this if I see anything fishy. thx!
-
Mmm, hard to say without more data. If is is still leaking somewhere it's small. It could also be something that simply doesn't free memory unless it has to and since you still have >30% free it doesn't.
Keep monitoring it. Check the process list.Steve
-
There is definitely a memory leak in 2.5.2. Have to reboot about once a week, otherwise system just crash, because it runs out of memory (have 8GB) and swap.
-
@netnerdy said in pfsense 2.5.2 slowly leaking memory:
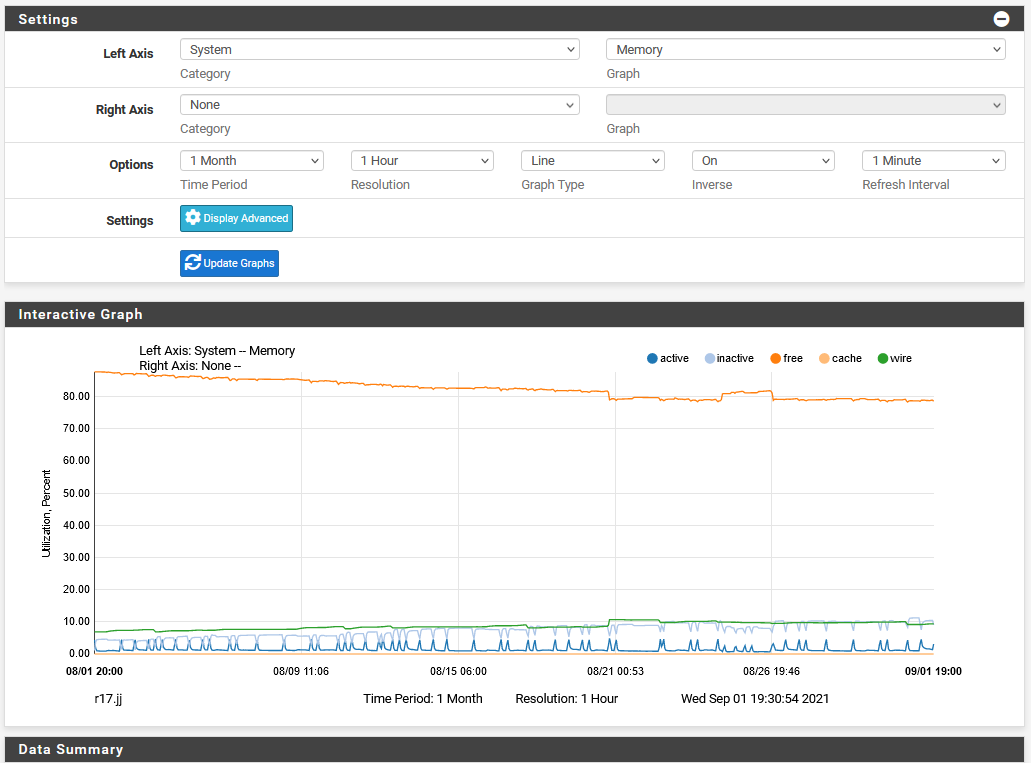
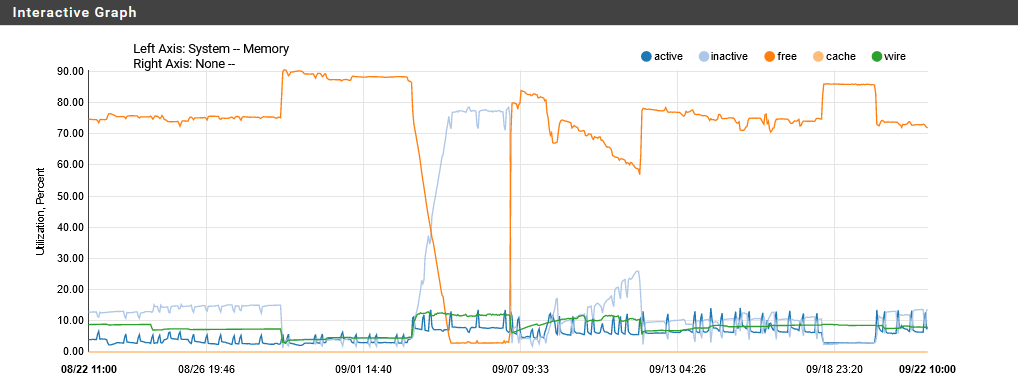
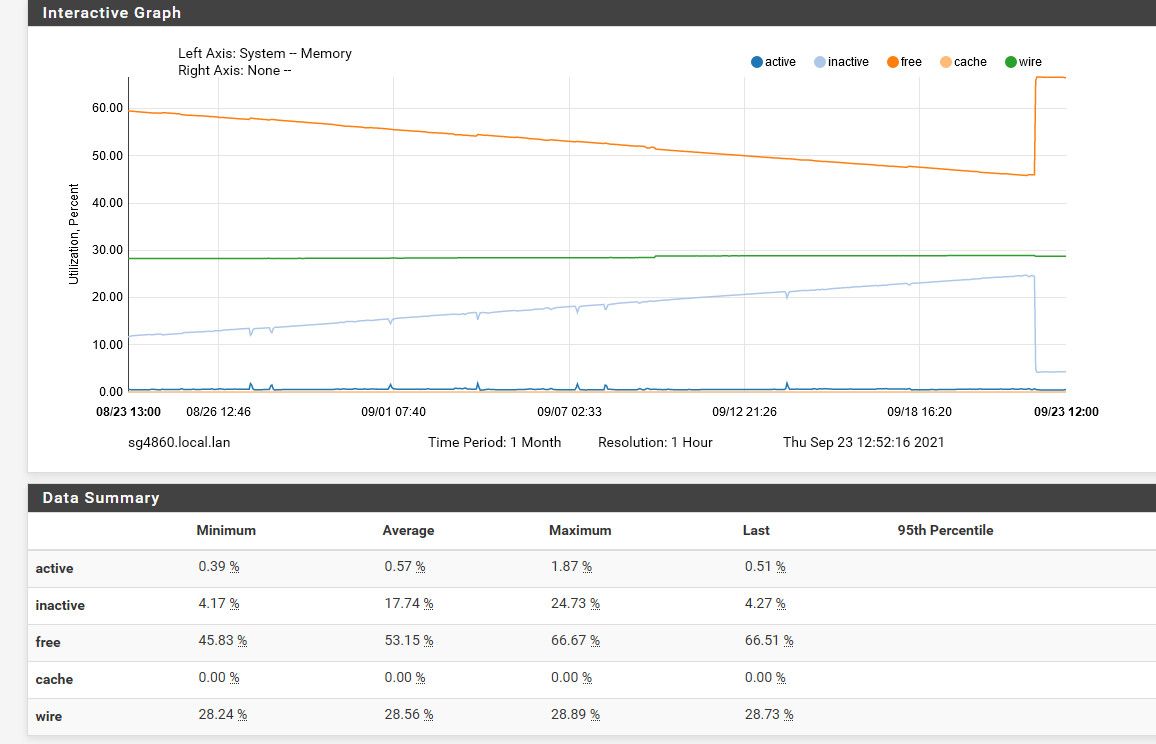
when you do a monthly view with 1 hour resolution?
Here is my sg4860 running 21.05.1, been up 46 days. Graph 1 month, 1 hour resolution
-
This post is deleted! -
Turns out the biggest memory hog was pfblocker unbound mode. When I switched to python mode I see significant memory savings.
-
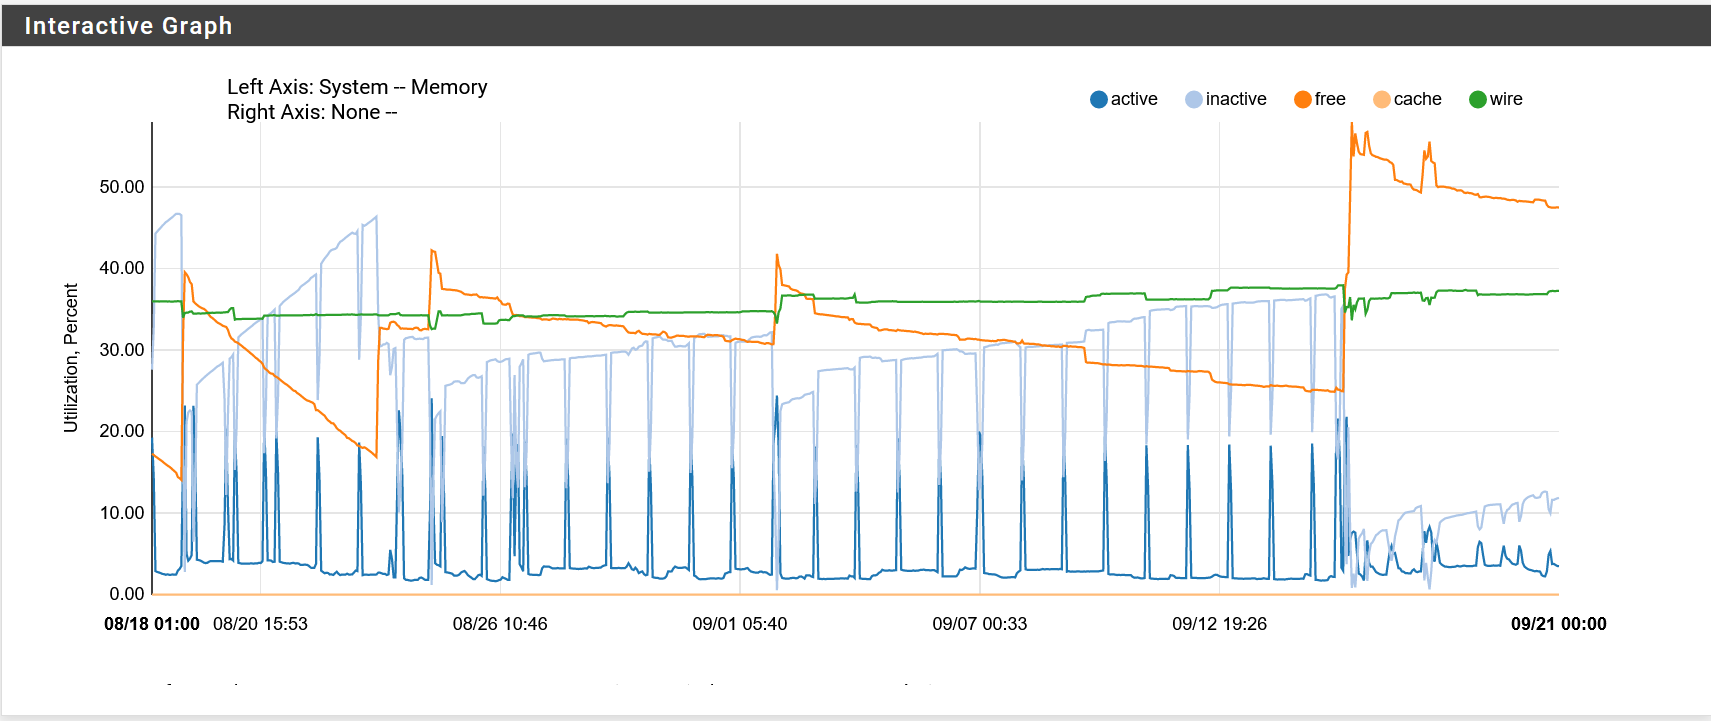
Huge difference in systems all running the same config.
-
@murzik I agree, 2.5.2 is acting weird.
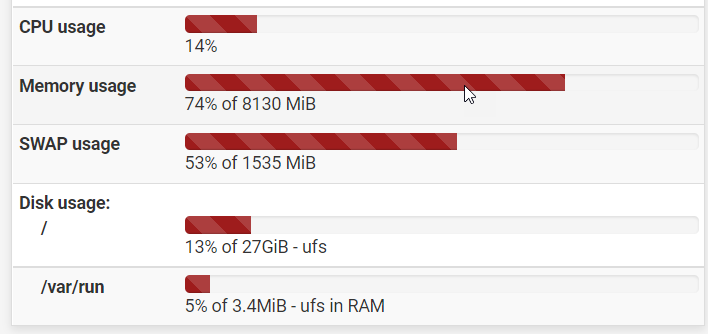
On a system with 4GB of ram and 2GB of swap, after 70 days, I notice unusual behavior.
Ram and swap usage is at 60%, however, I have never ever seen swap usage before, even after months of uptime.
My setup is really basic, no ressource hungry addons of any kind.
-
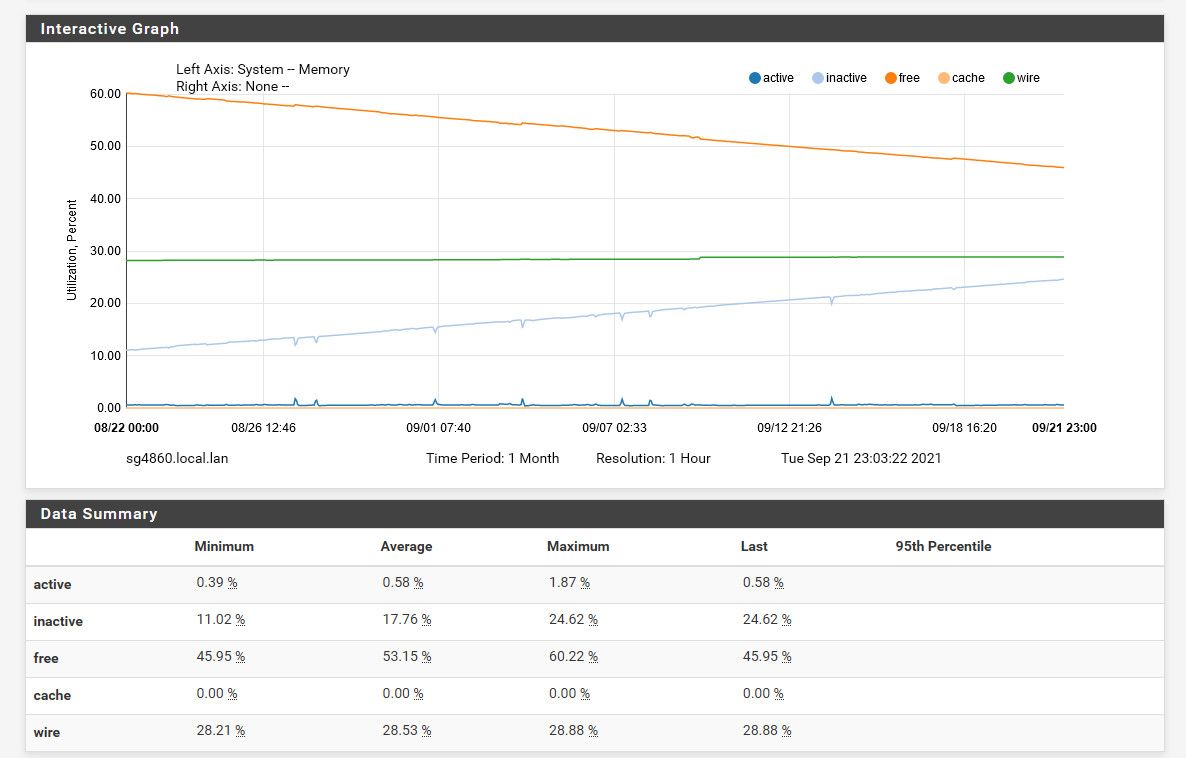
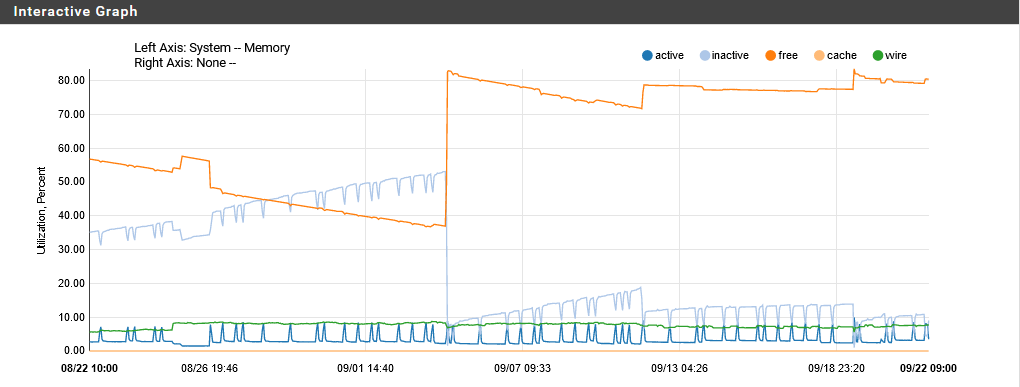
@cool_corona you say "same config"; is it same hardware, same set of packages, same functionality in your network?
Just curious because your graphs are "interesting" -
@mer Exactly the same.
-
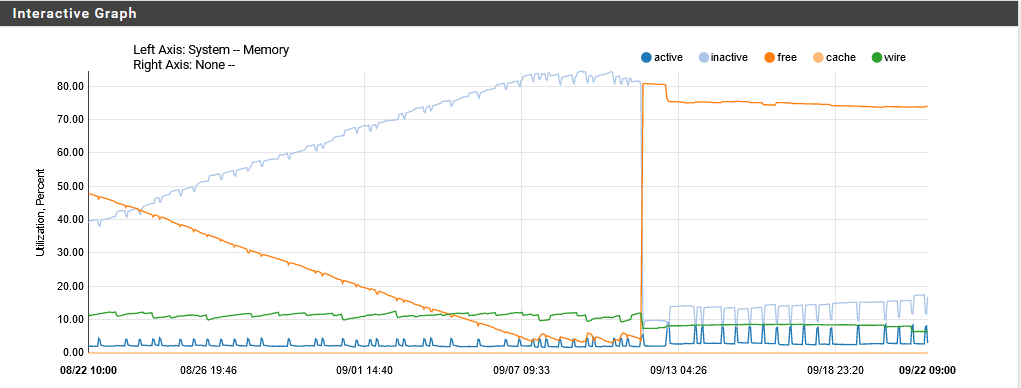
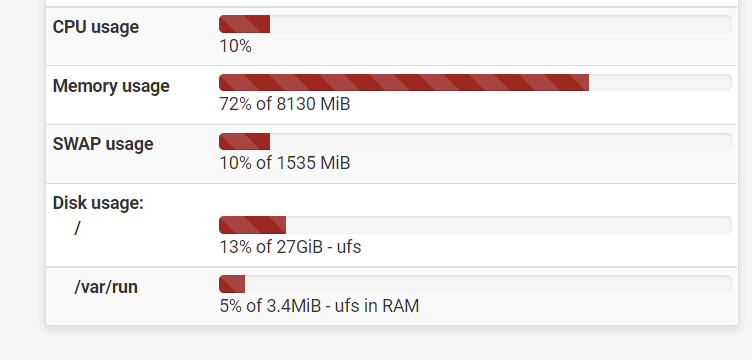
Just for one day
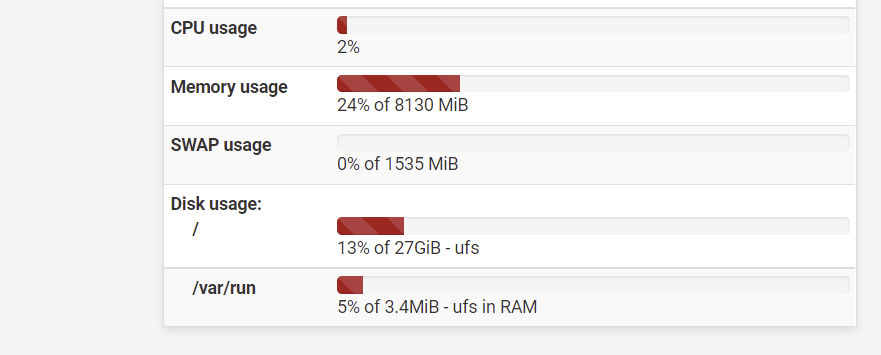
After reboot
-
@murzik And just to be clear, you've patched for the pcscd issue and/or that service is stopped (Status/Services)? We do have one 2.5.2 and its graphs are literally flat today except at 6:30 this morning when free memory increased 1%. That's when Suricata updates.
Do you have pfBlocker's DNSBL active, or any other packages?
-
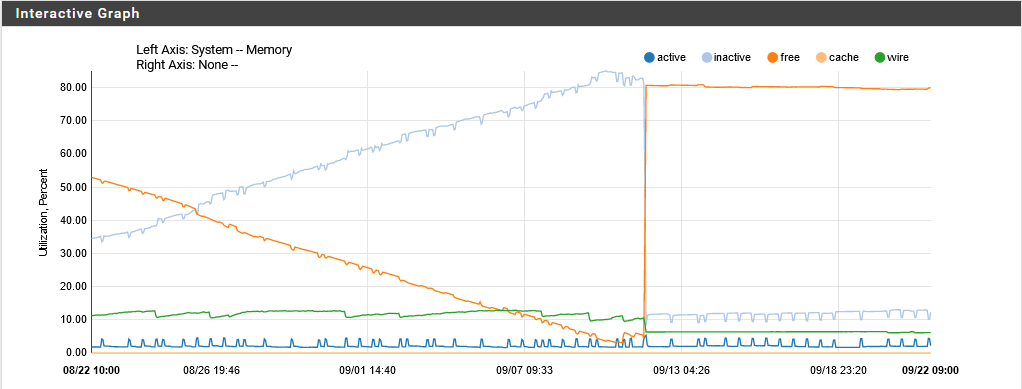
You can see exactly when I turned off pcscd a couple of days ago.. I thought I had stopped it, but it was running again..
-
Yes, I've patched pcscd. Do have pfblocker, snort, squid installed. But I had all the same packages for years.
-
@murzik I don't use DNSBL or Squid but you might read this recent post about pfBlocker.
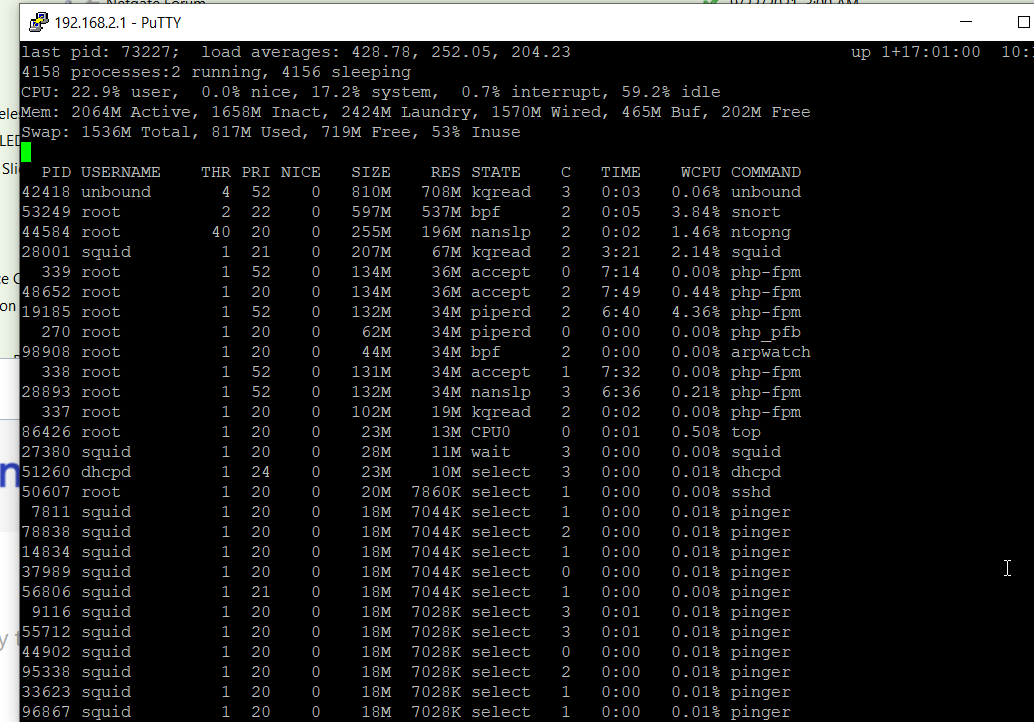
You could try looking at Diagnostics/System Activity, or run "top -o res" (sort by memory) at a command line, and see what is using the memory. I get:
PID USERNAME THR PRI NICE SIZE RES STATE C TIME WCPU COMMAND 81511 root 10 20 0 381M 337M nanslp 0 586:13 1.49% suricata 89847 root 1 52 0 135M 47M accept 0 0:29 0.00% php-fpm 93096 root 1 21 0 133M 46M accept 0 0:13 0.29% php-fpm 11372 root 1 52 0 132M 45M accept 1 0:03 0.00% php-fpm 338 root 1 52 0 133M 45M accept 0 0:11 0.00% php-fpm 337 root 1 52 0 132M 44M accept 1 0:34 0.00% php-fpm 26574 root 1 52 0 59M 38M piperd 1 0:00 0.00% php_pfb 73546 unbound 4 20 0 68M 32M kqread 1 1:17 0.00% unbound 336 root 1 20 0 102M 25M kqread 0 1:25 0.00% php-fpm 37003 root 1 20 0 29M 9648K kqread 2 0:07 0.05% nginx 36796 root 1 20 0 29M 9644K kqread 3 0:03 0.00% nginx ... -
@steveits
The problem not what application uses the most memory, but that memory usage grow over the time. I have to reboot every other day.
Also memory usage displayed with "top -o res" does not account for all memory used memory shown in GUI.
Stopping PF blocker does not free memory.