Latency issue - slow ping response
-
Hello,
Running latest 2.5.2-RELEASE.I have one WAN interface, and One LAN Interface which goes to cisco 48 port switch.
So client get Internet access from PFSense via Cisco 48 port switch.Everything works well but after few days ping to PFSense LAN interface starts causing issues.
If I ping PFSense LAN interface from any connected ClientPC, the Latency is very high. Around 400ms to 1200ms.This is happening since last 2 months and I read extensively to resolve the issue.
I have to restart PFsense everytime when this happens, and it gets back to normal for few days. But after 2-4 days, latency issue starts again always.When latency to PFSense LAN interface is high: (I tried following thihngs)
I physically removed CAT6 cable from WAN Interface so it disconnects from the Internet and tried, but still, latency remains high.
Then,
I removed CAT6 from LAN Interface so the entire LAN network is disconnected, and directly plugged just the laptop.
There is no internet cable, No LAN devices, just one Laptop directly connected to PFSense.
Still Ping to PFSense Local IP remain slow with 400ms to 1200ms.Then I was trying different options, and I tried to change subnet on LAN Interface from 22 to 23, and hit Apply. Ping response came back normal.
Then after a few days it slows again as it happens always since 2 months, and then I change subnet from 23 to 22. It works well without restarting.Why this happens? Why I am having latency issue and it goes away by just changing subnet.
I know there is no issue with subnet, but changing subnet, PFSense clears something and everything comes back normal.
Pls help to resolve this issue.Thanx
-
You should also try just re-saving the LAN interface with the same settings. I imagine that would also bring it back.
However 400-1200ms is huge. What is pfSense doing during that time?
Check Diag > System Activity or runtop -aSHat the command line.
About the only thing that can cause delays like that is if the CPU is used completely on some other task or you have active traffic shaping that is misconfigured.Stee
-
@stephenw10 yes, you are correct. I just tried and just re-saving the LAN Interface (without any changes) also resolved the latency issue.
CPU usage and memory have no issue.
CPU stays around 10% or max at 40% sometimes.Will see system activity again when issue starts. As of now latency is back to normal after Re-saving as advised by you.
Based on history, now it will take 1-2 days to have a problem again.Do you want me to post System Activity log here when have issue again?
Thanks
-
Yes, do that if you can.
What hardware are you running on? What NICs?
Steve
-
I am running on VM, having Realtek Gb Onboard + Asix gb USB LAN.
However, i tried changing hardware totally.
Here what I did:On first machine, where PFSense was running well since last 4 yrs (VM) with two onboard Realtek NIC, I swapped interfaces just to check if the particular port has any issue.
Swapping Interface did not resolve the issue.So next, I decided to move the entire VM to new totally different hardware. On new hardware with same VM I had same issue.
So next, I decided to create a fresh installation on PFSense with new VM, running parallel in network with different LAN IP.
This new installation does not have any extra settings. No VPN, No Extra packages, No extra rules, just basic 5-6 rules, No Port forwarding, nothing.
Just Two Interface, basic rules for Internet and DHCP server. (I have total 4 DHCP ranges in original machine, out of 4 i moved only 1 range to this new PFSense).Original PFSense IP: 192.168.2.14
New PFSense IP: 192.168.2.17
Under this trial, both PFSense are running on same hardware. New PFSense have only 10-12 DHCP clients and no other clients using it as gateway.
This performs well, but not entirely well. Instead of 1-2 days, this one is working well for 7-9 days, and then has same latency issue.While parallel running, the original PFSense has a latency issue at every 1-2 days.
-
What hypervisor are you using?
Are you passing the NICs through to the pfSense VM?
-
@stephenw10 said in Latency issue - slow ping response:
NICs
It is VMware workstation in current trial.
Yes, I have bridged NIC directly to VM. -
Hmm, well I would still suspect something in the VM setup. The only thing that can cause a delay like that in pfSense is a specifically configured Limiter.
I would also not trust any result that includes a USB NIC as they are notoriously bad in pfSense/FreeBSD.Can you try running either of those bare metal?
I'm not entirely clear how you are running two DHCP servers on the same subnet either. Could this be some conflict there? A simple IP or ARP conflict would show up immediately though.
Steve
-
@stephenw10
I have set "Allow only MAC" for DHCP.
Anyone in network would get DHCP lease only if it's MAC is whitelisted in "Allow MAC"So DHCP server in New PFSense has 12 whitelisted MAC, and original PFSense does not has these 12 MAC in its list. So no Conflict.
Why I do not doubt USB? Because original PFSense (VM) had two onboard NIC, no USB LAN, but still it had same issue.
I tried with different VMware workstation versions on totally different hardware, still have same issue.
-
And can you test either running bare metal?
-
@stephenw10
Okay, I will arrange for new hardware and will run one of them on bare metal.Meantime, when latency increases, I will share Activity log here.
I would like to share one thing which I noticed during trial:
Let's say currently I have high latency pinging PFSense LAN IP.
I remove LAN Network cable from PFSense (disconnecting the entire LAN network from PFSense) and just plug-in Laptop Directly to PFSense's LAN interface.
When I try to Ping PFSense LAN IP from Laptop, it is even worst. I hardly get 2-3 reply out of 10 ping.
PFSense does not like disconnecting my entire LAN network from it :) and it goes crazy when not seeing my LAN clients
This happened most of the time when I tried the method (removing LAN Network and just plug in Laptop) -
Is it actually linking at the correct speed and duplex when you do that? Actual packet loss like that sounds more like a bad link.
Do you see errors or collisions on the LAN in Status > Interfaces in any scenario?Steve
-
@stephenw10
Yes, it connects at 1gb Full duplex.I have not observed collisions on LAN status, will see it when this happens again.
Wondering why everything works well by just re-Saving LAN interface !!! -
Because doing so runs ifconfig against the LAN interface to set those options.
You might also test running:
ifconfig ue0 down; ifconfig ue0 upSee if that does the same. Assuming your LAN is ue0. -
@stephenw10
ifconfig ue0 down; ifconfig ue0 up resolved the issue.Following is "System Activity Log" and few screenshots.
DiagnosticsSystem Activity
CPU Activity
last pid: 31544;  load averages:  0.23,  0.29,  0.25  up 0+11:02:00    10:20:47
173 threads:   3 running, 121 sleeping, 49 waiting
CPU:  0.0% user,  0.1% nice,  1.0% system,  0.5% interrupt, 98.4% idle
Mem: 27M Active, 88M Inact, 149M Wired, 52M Buf, 173M Free
Swap: 1024M Total, 1024M Free

  PID USERNAME    PRI NICE   SIZE    RES STATE    C   TIME    WCPU COMMAND
   11 root        155 ki31     0B    32K CPU1     1 650:39  98.97% [idle{idle: cpu1}]
   11 root        155 ki31     0B    32K RUN      0 648:43  96.97% [idle{idle: cpu0}]
    0 root        -76    -     0B   432K -        1   6:48   2.98% [kernel{if_io_tqg_1}]
   12 root        -92    -     0B   784K WAIT     0   7:59   0.98% [intr{irq16: le0}]
    0 root        -76    -     0B   432K -        0   2:51   0.00% [kernel{if_config_tqg_0}]
   12 root        -60    -     0B   784K WAIT     1   0:31   0.00% [intr{swi4: clock (0)}]
42050 unbound      20    0    52M    29M kqread   0   0:28   0.00% /usr/local/sbin/unbound -c /var/unbound/unbound.conf{unbound}
19130 root         20    0    11M  2588K nanslp   0   0:27   0.00% /usr/local/bin/dpinger -S -r 0 -i WANGW -B 202.129.240.188 -p /var/run/dpinger_WANGW~202.129.240.188~202.129.240.177.pid -u /var/run/dpinger_WANGW~202.129.240.188~202.129.240.177.sock -C /etc/rc.gateway_alarm -d 1 -s 500 -l 2000 -t 60000 -A 1000 -D 500 -L 20 202.129.240.177{dpinger}
    0 root        -16    -     0B   432K swapin   1   0:27   0.00% [kernel{swapper}]
 5569 root         20    0    38M    27M nanslp   1   0:26   0.00% /usr/local/sbin/pcscd{pcscd}
   19 root        -16    -     0B    16K pftm     1   0:17   0.00% [pf purge]
   20 root        -16    -     0B    16K -        0   0:13   0.00% [rand_harvestq]
   25 root         16    -     0B    16K syncer   0   0:12   0.00% [syncer]
   12 root        -92    -     0B   784K WAIT     0   0:09   0.00% [intr{irq18: em2:irq0++}]
42050 unbound      20    0    52M    29M kqread   1   0:09   0.00% /usr/local/sbin/unbound -c /var/unbound/unbound.conf{unbound}
 7959 root         20    0    12M  2868K bpf      0   0:08   0.00% /usr/local/sbin/filterlog -i pflog0 -p /var/run/filterlog.pid
    0 root        -76    -     0B   432K -        0   0:07   0.00% [kernel{if_io_tqg_0}]
55785 dhcpd        20    0    22M    10M select   0   0:07   0.00% /usr/local/sbin/dhcpd -user dhcpd -group _dhcp -chroot /var/dhcpd -cf /etc/dhcpd.conf -pf /var/run/dhcpd.pid le0
   21 root        -16    -     0B    48K psleep   1   0:06   0.00% [pagedaemon{dom0}]
75659 root         52   20    11M  2596K wait     0   0:05   0.00% /bin/sh /var/db/rrd/updaterrd.sh
   16 root        -68    -     0B   160K -        1   0:05   0.00% [usb{usbus0}]
   16 root        -68    -     0B   160K -        0   0:05   0.00% [usb{usbus0}]
   12 root        -96    -     0B   784K WAIT     0   0:04   0.00% [intr{irq17: pcm0 mpt0+}]
   23 root        -16    -     0B    48K qsleep   1   0:04   0.00% [bufdaemon{bufdaemon}]
47835 root         20    0    19M  6356K select   0   0:04   0.00% /usr/local/sbin/ntpd -g -c /var/etc/ntpd.conf -p /var/run/ntpd.pid{ntpd}
   12 root        -88    -     0B   784K WAIT     0   0:04   0.00% [intr{irq15: ata1}]
91656 root         20    0    11M  2644K select   0   0:03   0.00% /usr/sbin/syslogd -O rfc3164 -s -c -c -l /var/dhcpd/var/run/log -P /var/run/syslog.pid -f /etc/syslog.conf
19130 root         20    0    11M  2588K sbwait   1   0:03   0.00% /usr/local/bin/dpinger -S -r 0 -i WANGW -B 202.129.240.188 -p /var/run/dpinger_WANGW~202.129.240.188~202.129.240.177.pid -u /var/run/dpinger_WANGW~202.129.240.188~202.129.240.177.sock -C /etc/rc.gateway_alarm -d 1 -s 500 -l 2000 -t 60000 -A 1000 -D 500 -L 20 202.129.240.177{dpinger}
    5 root        -16    -     0B    32K -        0   0:03   0.00% [cam{doneq0}]
  335 root         20    0    77M    25M kqread   0   0:02   0.00% php-fpm: master process (/usr/local/lib/php-fpm.conf) (php-fpm)
  517 root         20    0    10M  1272K select   1   0:02   0.00% /sbin/devd -q -f /etc/pfSense-devd.conf
19130 root         20    0    11M  2588K nanslp   0   0:02   0.00% /usr/local/bin/dpinger -S -r 0 -i WANGW -B 202.129.240.188 -p /var/run/dpinger_WANGW~202.129.240.188~202.129.240.177.pid -u /var/run/dpinger_WANGW~202.129.240.188~202.129.240.177.sock -C /etc/rc.gateway_alarm -d 1 -s 500 -l 2000 -t 60000 -A 1000 -D 500 -L 20 202.129.240.177{dpinger}
   23 root         20    -     0B    48K sdflus   0   0:01   0.00% [bufdaemon{/ worker}]
 5569 root         20    0    38M    27M select   0   0:01   0.00% /usr/local/sbin/pcscd{pcscd}
    5 root        -16    -     0B    32K -        1   0:01   0.00% [cam{scanner}]
  336 root         22    0    77M    35M piperd   1   0:01   0.00% php-fpm: pool nginx (php-fpm)
   16 root        -68    -     0B   160K -        0   0:01   0.00% [usb{usbus1}]
  337 root         52    0    77M    35M accept   0   0:01   0.00% php-fpm: pool nginx (php-fpm)
  338 root         52    0    77M    34M accept   1   0:01   0.00% php-fpm: pool nginx (php-fpm)
47378 root         20    0    11M  2568K nanslp   0   0:00   0.00% /usr/sbin/cron -s
    0 root        -76    -     0B   432K -        0   0:00   0.00% [kernel{softirq_0}]
   24 root        -16    -     0B    16K vlruwt   1   0:00   0.00% [vnlru]
   21 root        -16    -     0B    48K umarcl   0   0:00   0.00% [pagedaemon{uma}]
   23 root         20    -     0B    48K -        0   0:00   0.00% [bufdaemon{bufspacedaemon-0}]
    0 root        -76    -     0B   432K -        1   0:00   0.00% [kernel{softirq_1}]
46805 root         20    0    19M  8360K kqread   1   0:00   0.00% nginx: worker process (nginx)
    0 root          8    -     0B   432K -        0   0:00   0.00% [kernel{thread taskq}]
    6 root        -16    -     0B    16K idle     1   0:00   0.00% [mpt_recovery0]
19130 root         20    0    11M  2588K accept   0   0:00   0.00% /usr/local/bin/dpinger -S -r 0 -i WANGW -B 202.129.240.188 -p /var/run/dpinger_WANGW~202.129.240.188~202.129.240.177.pid -u /var/run/dpinger_WANGW~202.129.240.188~202.129.240.177.sock -C /etc/rc.gateway_alarm -d 1 -s 500 -l 2000 -t 60000 -A 1000 -D 500 -L 20 202.129.240.177{dpinger}
   66 root         -8    -     0B    16K mdwait   0   0:00   0.00% [md0]
92808 root         20    0    10M  2100K nanslp   0   0:00   0.00% minicron: helper /usr/local/bin/ping_hosts.sh  (minicron)
    1 root         20    0  9552K   884K wait     1   0:00   0.00% [init]
   17 root        -16    -     0B    16K -        0   0:00   0.00% [soaiod4]
    7 root        -16    -     0B    16K -        0   0:00   0.00% [soaiod1]
    8 root        -16    -     0B    16K -        0   0:00   0.00% [soaiod2]
    9 root        -16    -     0B    16K -        0   0:00   0.00% [soaiod3]
13066 root         52    0    12M  3036K wait     0   0:00   0.00% -sh (sh)
   14 root         -8    -     0B    48K -        1   0:00   0.00% [geom{g_down}]
 9932 root         52    0    11M  2784K wait     1   0:00   0.00% login [pam] (login)
   14 root         -8    -     0B    48K -        0   0:00   0.00% [geom{g_event}]
46636 root         20    0    18M  7716K kqread   1   0:00   0.00% nginx: worker process (nginx)
46502 root         52    0    17M  7252K pause    1   0:00   0.00% nginx: master process /usr/local/sbin/nginx -c /var/etc/nginx-webConfigurator.conf (nginx)
31544 root         22    0    12M  3272K CPU0     0   0:00   0.00% /usr/bin/top -baHS 999
  375 root         43   20    11M  2748K kqread   1   0:00   0.00% /usr/local/sbin/check_reload_status
 9198 root         22    0    11M  2896K wait     0   0:00   0.00% /bin/sh /usr/local/sbin/sshguard -i /var/run/sshguard.pid
 9426 root         21    0    16M  3700K piperd   0   0:00   0.00% /usr/local/libexec/sshg-parser
93466 root         20    0    10M  2104K nanslp   1   0:00   0.00% minicron: helper /usr/local/sbin/fcgicli -f /etc/rc.expireaccounts  (minicron)
   12 root        -52    -     0B   784K WAIT     1   0:00   0.00% [intr{swi6: task queue}]
11390 root         52    0    11M  2204K ttyin    1   0:00   0.00% /usr/libexec/getty Pc ttyv7
   12 root        -72    -     0B   784K WAIT     0   0:00   0.00% [intr{swi1: netisr 0}]
   12 root        -72    -     0B   784K WAIT     0   0:00   0.00% [intr{swi1: netisr 1}]
13191 root         52    0    11M  2872K ttyin    1   0:00   0.00% /bin/sh /etc/rc.initial
10949 root         52    0    11M  2204K ttyin    1   0:00   0.00% /usr/libexec/getty Pc ttyv5
 9597 root         21    0    12M  2584K piperd   1   0:00   0.00% /usr/local/libexec/sshg-blocker{sshg-blocker}
 9864 root         24    0    11M  2884K piperd   0   0:00   0.00% /bin/sh /usr/local/libexec/sshg-fw-pf
19130 root         52    0    11M  2588K uwait    0   0:00   0.00% /usr/local/bin/dpinger -S -r 0 -i WANGW -B 202.129.240.188 -p /var/run/dpinger_WANGW~202.129.240.188~202.129.240.177.pid -u /var/run/dpinger_WANGW~202.129.240.188~202.129.240.177.sock -C /etc/rc.gateway_alarm -d 1 -s 500 -l 2000 -t 60000 -A 1000 -D 500 -L 20 202.129.240.177{dpinger}
10443 root         52    0    11M  2204K ttyin    1   0:00   0.00% /usr/libexec/getty Pc ttyv2
10736 root         52    0    11M  2204K ttyin    1   0:00   0.00% /usr/libexec/getty Pc ttyv4
11227 root         52    0    11M  2204K ttyin    1   0:00   0.00% /usr/libexec/getty Pc ttyv6
10122 root         52    0    11M  2204K ttyin    1   0:00   0.00% /usr/libexec/getty Pc ttyv1
   14 root         -8    -     0B    48K -        1   0:00   0.00% [geom{g_up}]
10593 root         52    0    11M  2204K ttyin    1   0:00   0.00% /usr/libexec/getty Pc ttyv3
 9290 root         20    0    10M  2060K piperd   1   0:00   0.00% /bin/cat
 9597 root         20    0    12M  2584K nanslp   0   0:00   0.00% /usr/local/libexec/sshg-blocker{sshg-blocker}
29891 root         52   20    10M  2044K nanslp   1   0:00   0.00% sleep 60
60170 root         52   20    10M  2044K nanslp   1   0:00   0.00% sleep 67572
  377 root         52   20    11M  2576K kqread   1   0:00   0.00% check_reload_status: Monitoring daemon of check_reload_status (check_reload_status)
93740 root         52    0    10M  2084K wait     0   0:00   0.00% /usr/local/bin/minicron 86400 /var/run/update_alias_url_data.pid /usr/local/sbin/fcgicli -f /etc/rc.update_alias_url_data
92564 root         52    0    10M  2080K wait     0   0:00   0.00% /usr/local/bin/minicron 240 /var/run/ping_hosts.pid /usr/local/bin/ping_hosts.sh
93250 root         52    0    10M  2084K wait     0   0:00   0.00% /usr/local/bin/minicron 3600 /var/run/expire_accounts.pid /usr/local/sbin/fcgicli -f /etc/rc.expireaccounts
59971 root         52   20    11M  2844K wait     1   0:00   0.00% /bin/sh /etc/rc.update_pkg_metadata
93992 root         52    0    10M  2104K nanslp   0   0:00   0.00% minicron: helper /usr/local/sbin/fcgicli -f /etc/rc.update_alias_url_data  (minicron)
    0 root          8    -     0B   432K -        0   0:00   0.00% [kernel{acpi_task_1}]
 9739 root         22    0    11M  2888K wait     0   0:00   0.00% /bin/sh /usr/local/sbin/sshguard -i /var/run/sshguard.pid
   16 root        -76    -     0B   160K -        0   0:00   0.00% [usb{usbus0}]
    0 root         -8    -     0B   432K -        1   0:00   0.00% [kernel{CAM taskq}]
   12 root        -84    -     0B   784K WAIT     0   0:00   0.00% [intr{irq1: atkbd0}]
    0 root          8    -     0B   432K -        1   0:00   0.00% [kernel{linuxkpi_short_wq_0}]
 5569 root         52    0    38M    27M piperd   0   0:00   0.00% /usr/local/sbin/pcscd{pcscd}
   18 root        -16    -     0B    16K waitin   1   0:00   0.00% [sctp_iterator]
   13 root        -16    -     0B    32K sleep    0   0:00   0.00% [ng_queue{ng_queue0}]
    0 root          8    -     0B   432K -        1   0:00   0.00% [kernel{firmware taskq}]
    0 root        -20    -     0B   432K -        1   0:00   0.00% [kernel{crypto_0}]
   13 root        -16    -     0B    32K sleep    1   0:00   0.00% [ng_queue{ng_queue1}]
    0 root          8    -     0B   432K -        1   0:00   0.00% [kernel{inm_free taskq}]
   21 root        -16    -     0B    48K launds   0   0:00   0.00% [pagedaemon{laundry: dom0}]
   22 root        -16    -     0B    16K psleep   0   0:00   0.00% [vmdaemon]
   16 root        -68    -     0B   160K -        1   0:00   0.00% [usb{usbus0}]
   16 root        -68    -     0B   160K -        0   0:00   0.00% [usb{usbus1}]
    0 root          8    -     0B   432K -        0   0:00   0.00% [kernel{acpi_task_2}]
   26 root        -16    -     0B    16K aldslp   0   0:00   0.00% [ALQ Daemon]
   10 root        -16    -     0B    16K audit_   1   0:00   0.00% [audit]
   15 root        -16    -     0B    16K seqsta   1   0:00   0.00% [sequencer 00]
   12 root        -52    -     0B   784K WAIT     0   0:00   0.00% [intr{swi6: Giant taskq}]
    0 root          8    -     0B   432K -        0   0:00   0.00% [kernel{mlx4}]
    0 root          8    -     0B   432K -        1   0:00   0.00% [kernel{aiod_kick taskq}]
    0 root          8    -     0B   432K -        1   0:00   0.00% [kernel{kqueue_ctx taskq}]
    0 root          8    -     0B   432K -        1   0:00   0.00% [kernel{in6m_free taskq}]
    0 root          8    -     0B   432K -        1   0:00   0.00% [kernel{linuxkpi_long_wq_0}]
    0 root          8    -     0B   432K -        0   0:00   0.00% [kernel{acpi_task_0}]
    4 root        -16    -     0B    16K crypto   1   0:00   0.00% [crypto returns 1]
    2 root        -16    -     0B    16K crypto   1   0:00   0.00% [crypto]
    3 root        -16    -     0B    16K crypto   1   0:00   0.00% [crypto returns 0]
    0 root        -20    -     0B   432K -        1   0:00   0.00% [kernel{crypto_1}]
   16 root        -68    -     0B   160K -        0   0:00   0.00% [usb{usbus1}]
   16 root        -72    -     0B   160K -        0   0:00   0.00% [usb{usbus1}]
   16 root        -72    -     0B   160K -        1   0:00   0.00% [usb{usbus0}]
   16 root        -76    -     0B   160K -        0   0:00   0.00% [usb{usbus1}]
    0 root          8    -     0B   432K -        1   0:00   0.00% [kernel{linuxkpi_short_wq_3}]
    0 root          8    -     0B   432K -        1   0:00   0.00% [kernel{linuxkpi_long_wq_1}]
    0 root          8    -     0B   432K -        1   0:00   0.00% [kernel{linuxkpi_long_wq_2}]
    0 root          8    -     0B   432K -        1   0:00   0.00% [kernel{linuxkpi_long_wq_3}]
    0 root          8    -     0B   432K -        1   0:00   0.00% [kernel{linuxkpi_short_wq_2}]
    0 root          8    -     0B   432K -        1   0:00   0.00% [kernel{linuxkpi_short_wq_1}]
   12 root        -56    -     0B   784K WAIT    -1   0:00   0.00% [intr{swi5: fast taskq}]
   12 root        -60    -     0B   784K WAIT    -1   0:00   0.00% [intr{swi4: clock (1)}]
   12 root        -64    -     0B   784K WAIT    -1   0:00   0.00% [intr{swi3: vm}]
   12 root        -72    -     0B   784K WAIT    -1   0:00   0.00% [intr{swi1: pfsync}]
   12 root        -72    -     0B   784K WAIT    -1   0:00   0.00% [intr{swi1: pf send}]
   12 root        -80    -     0B   784K WAIT    -1   0:00   0.00% [intr{irq263: pcib10}]
   12 root        -80    -     0B   784K WAIT    -1   0:00   0.00% [intr{irq262: pcib9}]

   12 root        -80    -     0B   784K WAIT    -1   0:00   0.00% [intr{irq261: pcib8}]
   12 root        -80    -     0B   784K WAIT    -1   0:00   0.00% [intr{irq260: pcib7}]
   12 root        -80    -     0B   784K WAIT    -1   0:00   0.00% [intr{irq259: pcib6}]
   12 root        -80    -     0B   784K WAIT    -1   0:00   0.00% [intr{irq258: pcib5}]
   12 root        -80    -     0B   784K WAIT    -1   0:00   0.00% [intr{irq257: pcib4}]
   12 root        -80    -     0B   784K WAIT    -1   0:00   0.00% [intr{irq256: pcib3}]
   12 root        -80    -     0B   784K WAIT    -1   0:00   0.00% [intr{irq269: pcib16}]
   12 root        -80    -     0B   784K WAIT    -1   0:00   0.00% [intr{irq271: pcib18}]
   12 root        -80    -     0B   784K WAIT    -1   0:00   0.00% [intr{irq272: pcib19}]
   12 root        -80    -     0B   784K WAIT    -1   0:00   0.00% [intr{irq273: pcib20}]
   12 root        -80    -     0B   784K WAIT    -1   0:00   0.00% [intr{irq274: pcib21}]
   12 root        -80    -     0B   784K WAIT    -1   0:00   0.00% [intr{irq275: pcib22}]
   12 root        -80    -     0B   784K WAIT    -1   0:00   0.00% [intr{irq276: pcib23}]
   12 root        -80    -     0B   784K WAIT    -1   0:00   0.00% [intr{irq277: pcib24}]
   12 root        -80    -     0B   784K WAIT    -1   0:00   0.00% [intr{irq278: pcib25}]
   12 root        -80    -     0B   784K WAIT    -1   0:00   0.00% [intr{irq279: pcib26}]
   12 root        -80    -     0B   784K WAIT    -1   0:00   0.00% [intr{irq280: pcib27}]
   12 root        -80    -     0B   784K WAIT    -1   0:00   0.00% [intr{irq281: pcib28}]
   12 root        -80    -     0B   784K WAIT    -1   0:00   0.00% [intr{irq282: pcib29}]
   12 root        -80    -     0B   784K WAIT    -1   0:00   0.00% [intr{irq283: pcib30}]
   12 root        -80    -     0B   784K WAIT    -1   0:00   0.00% [intr{irq284: pcib31}]
   12 root        -80    -     0B   784K WAIT    -1   0:00   0.00% [intr{irq285: pcib32}]
   12 root        -80    -     0B   784K WAIT    -1   0:00   0.00% [intr{irq286: pcib33}]
   12 root        -80    -     0B   784K WAIT    -1   0:00   0.00% [intr{irq287: pcib34}]
   12 root        -80    -     0B   784K WAIT    -1   0:00   0.00% [intr{irq264: pcib11}]
   12 root        -80    -     0B   784K WAIT    -1   0:00   0.00% [intr{irq268: pcib15}]
   12 root        -80    -     0B   784K WAIT    -1   0:00   0.00% [intr{irq270: pcib17}]
   12 root        -80    -     0B   784K WAIT    -1   0:00   0.00% [intr{irq265: pcib12}]
   12 root        -80    -     0B   784K WAIT    -1   0:00   0.00% [intr{irq266: pcib13}]
   12 root        -80    -     0B   784K WAIT    -1   0:00   0.00% [intr{irq267: pcib14}]
   12 root        -84    -     0B   784K WAIT    -1   0:00   0.00% [intr{irq12: psm0}]
   12 root        -88    -     0B   784K WAIT    -1   0:00   0.00% [intr{irq14: ata0}]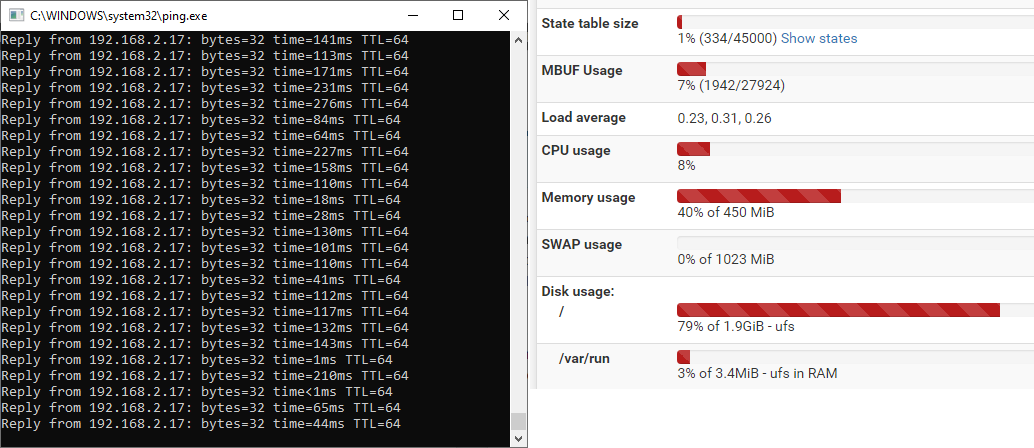

-
Hmm, well I would definitely go back to the other device to remove the USB NIC from the equation. It looks like you are actually using le0 as LAN there though, not ue0. Did you run the ifconfig command against le0 instead?
But I would still check a bare metal install first if you can.
Steve
-
@stephenw10
Yes I did execute for le0.But VM on bare-metal with onboard NICs (No USB NIC), should be okay, right?
-
I would certainly expect that. There's nothing outside limiters that can cause latency like that in pfSense.
Steve
-
@stephenw10
Okay, I tried on totally new hardware with server-grade PCI LAN card (intel i350) and on VM.
Still facing same issue. -
So you see the same thing both in a VM on new hardware AND running bare metal on that?