Netgate Discussion Forum
    • Categories
    • Recent
    • Tags
    • Popular
    • Users
    • Search
    • Register
    • Login

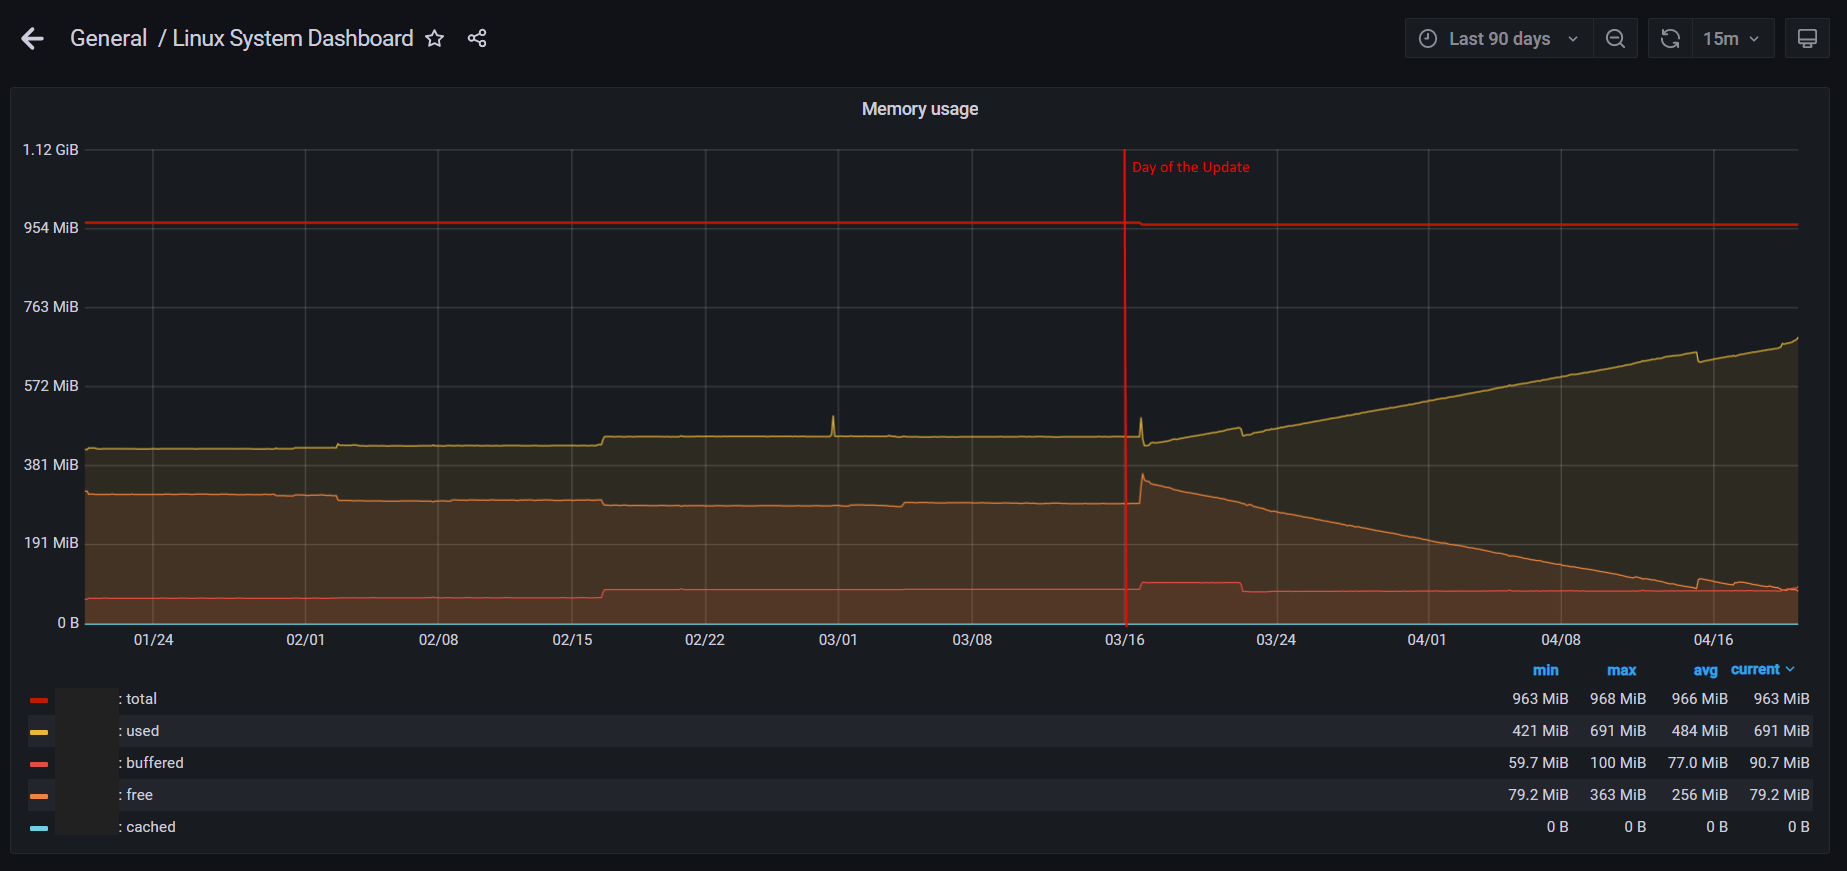
    Continuously increasing memory usage since the update to 2.6

    Scheduled Pinned Locked Moved General pfSense Questions
    42 Posts 9 Posters 11.7k Views
    Loading More Posts
    • Oldest to Newest
    • Newest to Oldest
    • Most Votes
    Reply
    • Reply as topic
    Log in to reply
    This topic has been deleted. Only users with topic management privileges can see it.
    • K
      kprovost @Techniker_ctr
      last edited by

      Can you post the output of vmstat -z, ideally on a machine that's using most of its memory? If there's a memory leak in the kernel there may be some indication of it there.

      T 1 Reply Last reply Reply Quote 0
      • T
        Techniker_ctr @kprovost
        last edited by

        @kprovost

        Following the output on VM1

        ITEM                   SIZE  LIMIT     USED     FREE      REQ FAIL SLEEP
        
        UMA Kegs:               224,      0,     142,      11,     142,   0,   0
        UMA Zones:              680,      0,     143,       2,     143,   0,   0
        UMA Slabs:               80,      0,   18750,     450,  109008,   0,   0
        UMA Hash:               256,      0,       9,       6,      14,   0,   0
        4 Bucket:                32,      0,      27,     598, 1498399,   0,   0
        6 Bucket:                48,      0,       7,     574,  863703,   0,   0
        8 Bucket:                64,      0,      26,     780, 1263635,  19,   0
        12 Bucket:               96,      0,      10,     277,  175069,   0,   0
        16 Bucket:              128,      0,      54,     318,   53744,   1,   0
        32 Bucket:              256,      0,      47,     148,  836378,   4,   0
        64 Bucket:              512,      0,      56,      72, 1119551,81796,   0
        128 Bucket:            1024,      0,      44,      24,  535362,   1,   0
        256 Bucket:            2048,      0,      52,      10, 4815883,  19,   0
        vmem:                  1856,      0,       3,       1,       3,   0,   0
        vmem btag:               56,      0,     867,     624,    1094,  11,   0
        VM OBJECT:              256,      0,    3634,    2156,253463924,   0,   0
        RADIX NODE:             144,      0,    8017,    5915,716370226,   0,   0
        MAP:                    240,      0,       3,      61,       3,   0,   0
        KMAP ENTRY:             120,      0,      13,      86,      14,   0,   0
        MAP ENTRY:              120,      0,    5241,    7035,2263377409,   0,   0
        VMSPACE:               2560,      0,      57,      30,10984762,   0,   0
        fakepg:                 104,      0,       1,     151,       1,   0,   0
        64 pcpu:                  8,      0,    5073,    2095,   34172,   0,   0
        mt_stats_zone:           64,      0,     500,      76,     500,   0,   0
        mt_zone:                 24,      0,     500,     335,     500,   0,   0
        16:                      16,      0,    1938,     823,78830492,   0,   0
        32:                      32,      0,    2455,    1045,54857778,   0,   0
        64:                      64,      0,  491731,     301,109581451,   0,   0
        128:                    128,      0, 1962118,     182,96462269,   0,   0
        256:                    256,      0,  489866,      79,77600913,   0,   0
        512:                    512,      0,     426,     198,11174057,   0,   0
        1024:                  1024,      0,    1612,      44,11834906,   0,   0
        2048:                  2048,      0,     295,      79,10466901,   0,   0
        4096:                  4096,      0,   17438,      13,14626646,   0,   0
        8192:                  8192,      0,      30,       2,  308457,   0,   0
        16384:                16384,      0,      19,       2,  408909,   0,   0
        32768:                32768,      0,       6,       0,     263,   0,   0
        65536:                65536,      0,      15,       2, 6915281,   0,   0
        SLEEPQUEUE:              80,      0,     217,      62,     217,   0,   0
        kenv:                   258,      0,       3,      72,    3640,   0,   0
        Files:                   80,      0,     205,     395,143610016,   0,   0
        filedesc0:             1104,      0,      82,      29,10984786,   0,   0
        rangeset pctrie nodes:    144,      0,       0,       0,       0,   0,   0
        TURNSTILE:              136,      0,     217,      43,     217,   0,   0
        rl_entry:                40,      0,     116,     384,     116,   0,   0
        umtx pi:                 96,      0,       0,       0,       0,   0,   0
        umtx_shm:                88,      0,       0,       0,       0,   0,   0
        PROC:                  1328,      0,      81,      42,10984785,   0,   0
        PGRP:                    88,      0,      38,     412,  112692,   0,   0
        THREAD:                1840,      0,     201,      15,    6198,   0,   0
        cpuset:                 104,      0,      11,     113,      11,   0,   0
        domainset:               40,      0,       0,       0,       0,   0,   0
        audit_record:          1280,      0,       0,       0,       0,   0,   0
        mbuf_packet:            256, 383385,       0,     759,30556029,   0,   0
        mbuf:                   256, 383385,    8193,     768,263857330,   0,   0
        mbuf_cluster:          2048,  59902,     759,       7,  150995,   0,   0
        mbuf_jumbo_page:       4096,  29951,       0,       4,   55790,   0,   0
        mbuf_jumbo_9k:         9216,   8874,       0,       0,       0,   0,   0
        mbuf_jumbo_16k:       16384,   4991,       0,       0,       0,   0,   0
        epoch_record pcpu:      256,      0,       4,      12,       4,   0,   0
        NetGraph items:          72,   4123,       0,     279,   29063,   0,   0
        NetGraph data items:     72,   4123,       0,       0,       1,   0,   0
        DMAR_MAP_ENTRY:         120,      0,       0,       0,       0,   0,   0
        ttyinq:                 160,      0,     180,      20,     375,   0,   0
        ttyoutq:                256,      0,      95,      40,     198,   0,   0
        FPU_save_area:          512,      0,       0,       0,       0,   0,   0
        g_bio:                  376,      0,       0,     350,27462740,   0,   0
        linux_dma_pctrie:       144,      0,       0,       0,       0,   0,   0
        linux_dma_object:        24,      0,       0,       0,       0,   0,   0
        cryptop:                128,      0,       0,       0,       0,   0,   0
        cryptodesc:             120,      0,       0,       0,       0,   0,   0
        crypto_session:          32,      0,       0,       0,       0,   0,   0
        vtnet_tx_hdr:            24,      0,       0,       0,       0,   0,   0
        VNODE:                  480,      0,    2225,      71,   82458,   0,   0
        VNODEPOLL:              120,      0,       0,       0,       0,   0,   0
        BUF TRIE:               144,      0,     563,    6268, 4618013,   0,   0
        NAMEI:                 1024,      0,       0,      40,212755708,   0,   0
        rentr:                   24,      0,       0,       0,     966,   0,   0
        S VFS Cache:            108,      0,    2519,     316,  805596,   0,   0
        STS VFS Cache:          148,      0,       0,       0,       0,   0,   0
        L VFS Cache:            328,      0,      20,      64,   24777,   0,   0
        LTS VFS Cache:          368,      0,       0,       0,       0,   0,   0
        TMPFS dirent:            64,      0,      41,     393,   18729,   0,   0
        TMPFS node:             232,      0,      42,      94,   18730,   0,   0
        NCLNODE:                608,      0,       0,       0,       0,   0,   0
        DIRHASH:               1024,      0,      31,      17,     890,   0,   0
        Mountpoints:           2744,      0,       4,       5,      10,   0,   0
        AIO:                    208,      0,       0,       0,       0,   0,   0
        AIOP:                    32,      0,       0,       0,       0,   0,   0
        AIOCB:                  752,      0,       0,       0,       0,   0,   0
        AIOLIO:                 280,      0,       0,       0,       0,   0,   0
        pipe:                   760,      0,      12,      43, 9800538,   0,   0
        procdesc:               136,      0,       0,       0,       0,   0,   0
        ksiginfo:               112,      0,     107,     383, 4736160,   0,   0
        itimer:                 352,      0,       0,       0,       0,   0,   0
        ng_pipe:                 64,      0,       0,       0,       0,   0,   0
        KNOTE:                  160,      0,      30,     195,34096706,   0,   0
        socket:                 872,  30804,      80,     272, 1250903,   0,   0
        IPsec SA lft_c:          16,      0,       0,       0,       0,   0,   0
        unpcb:                  256,  30810,      42,     138,  431749,   0,   0
        ipq:                     56,   1917,       0,       0,       0,   0,   0
        udp_inpcb:              488,  30808,      21,      91,  631572,   0,   0
        udpcb:                   32,  30875,      21,     604,  631572,   0,   0
        tcp_inpcb:              488,  30808,      10,      62,   76559,   0,   0
        tcpcb:                  984,  30804,      10,      30,   76559,   0,   0
        tcptw:                   88,   6165,       0,     270,   21380,   0,   0
        syncache:               168,  15364,       0,     138,   47481,   0,   0
        hostcache:               96,  15375,       7,      34,     355,   0,   0
        sackhole:                32,      0,       0,     375,      41,   0,   0
        tfo:                      4,      0,       0,       0,       0,   0,   0
        tfo_ccache_entries:      80,      0,       0,       0,       0,   0,   0
        tcpreass:                48,   3818,       0,       0,      26,   0,   0
        tcp_log:                400, 5000000,       0,       0,       0,   0,   0
        tcp_log_bucket:         144,      0,       0,       0,       0,   0,   0
        tcp_log_node:           120,      0,       0,       0,       0,   0,   0
        sctp_ep:               1280,  30804,       0,       0,       0,   0,   0
        sctp_asoc:             2288,  40000,       0,       0,       0,   0,   0
        sctp_laddr:              48,  80012,       0,       0,      19,   0,   0
        sctp_raddr:             736,  80000,       0,       0,       0,   0,   0
        sctp_chunk:             152, 400010,       0,       0,       0,   0,   0
        sctp_readq:             152, 400010,       0,       0,       0,   0,   0
        sctp_stream_msg_out:    112, 400015,       0,       0,       0,   0,   0
        sctp_asconf:             40, 400000,       0,       0,       0,   0,   0
        sctp_asconf_ack:         48, 400060,       0,       0,       0,   0,   0
        udplite_inpcb:          488,  30808,       0,       0,       0,   0,   0
        ripcb:                  488,  30808,       5,      35,   29066,   0,   0
        rtentry:                208,      0,      25,      70,      33,   0,   0
        pf mtags:                48,      0,       0,     830,76849844,   0,   0
        pf tags:                104,      0,       0,       0,       0,   0,   0
        pf states:              320,  96000,      57,     135, 2129745,   0,   0
        pf state keys:           88,      0,      57,     438, 2129745,   0,   0
        pf source nodes:        136,  96019,       0,       0,       0,   0,   0
        pf table entry counters:     64,      0,       0,       0,       0,   0,   0
        pf table entries:       160, 400000,  132853,   12297,  785608,   6,   0
        pf frags:               256,      0,       0,       0,       0,   0,   0
        pf frag entries:         40,   5000,       0,       0,       0,   0,   0
        pf state scrubs:         40,      0,       0,       0,       0,   0,   0
        bridge_rtnode:           88,      0,       0,       0,       0,   0,   0
        selfd:                   64,      0,     158,     772,137686944,   0,   0
        swpctrie:               144, 119853,       0,       0,       0,   0,   0
        swblk:                  136, 119828,       0,       0,       0,   0,   0
        FFS inode:              160,      0,    2129,     196,   63670,   0,   0
        FFS1 dinode:            128,      0,       0,       0,       0,   0,   0
        FFS2 dinode:            256,      0,    2129,     136,   63670,   0,   0
        
        K 1 Reply Last reply Reply Quote 0
        • K
          kprovost @Techniker_ctr
          last edited by

          @techniker_ctr said in Continuously increasing memory usage since the update to 2.6:

          128: 128, 0, 1962118, 182,96462269, 0, 0

          It looks like the '128' zone is the most likely culprit. Rather unhelpfully that's a generic zone used by the in-kernel 'malloc()' call.

          Let's confirm that that's the problem first. Can you keep an eye on the vmstat output for a few hours to see if the used number (currently at 1962118) increases roughly in line with the growing memory use you see?

          (Napkin math: we've got 1962118 allocations of 128 bytes, so about 240 MB. That seems to be about right for what we're looking for.)

          Once that's confirmed the following running Dtrace script on the router may provide clues:

          #!/usr/bin/env -S /usr/sbin/dtrace -x nolibs -s
          
          struct uma_zone {
                  uint32_t *mtx;
                  char *uz_name;
          };
          
          fbt:kernel:uma_zalloc_arg:entry
          / ((struct uma_zone *)arg0)->uz_name == "128" /
          {
                  @num[stack()] = count();
          }
          

          Let that run for a few minutes and then terminate it with Ctrl+C. It'll likely produce a large amount of output, but with any luck the top user will give us a clue as to where that memory is going.

          T 1 Reply Last reply Reply Quote 1
          • T
            Techniker_ctr @kprovost
            last edited by

            @kprovost I wasn't able to run the script for minutes, it crashed after ~20 sec with message "Killed". So attached the output for about 15 seconds: output.txt

            The 128 zone increase during one day:

            2022-05-22 08:48 :

            128:                    128,      0,   14566,     221,  812169,   0,   0
            

            2022-05-22 17:19 :

            128:                    128,      0,   29424,     119, 1566853,   0,   0
            
            K 1 Reply Last reply Reply Quote 0
            • K
              kprovost @Techniker_ctr
              last edited by kprovost

              @techniker_ctr
              Okay, it's pretty safe to conclude we're indeed leaking from the 128 zone.

              The dtrace output doesn't immediately point to an obvious suspect, but having looked through it I think this is where the problem is:

                        kernel`malloc+0x72
                        kernel`nvpair_create_number+0x3f
                        kernel`nvlist_add_number+0x26
                        kernel`pf_get_syncookies+0xa2
                        kernel`pfioctl+0x2bd6
                        kernel`devfs_ioctl+0xb0
                        kernel`VOP_IOCTL_APV+0x7b
                        kernel`vn_ioctl+0x16c
                        kernel`devfs_ioctl_f+0x1e
                        kernel`kern_ioctl+0x2b7
                        kernel`sys_ioctl+0x101
                        kernel`amd64_syscall+0x387
                        kernel`0xffffffff8135af6e
                          4
              

              There's nothing there to distinguish it from some of the other calls, but 2.6 does not have this commit: https://github.com/pfsense/FreeBSD-src/commit/410b11b25bdf39be3a73003ae5e5fadd9e3497fd
              That fixes a memory leak in that code path, and pfsense ends up calling that regularly to obtain unrelated counters.

              I expect you to be able to confirm this by running pfctl -si -v in a loop. That should leak memory quickly.

              The good news is that the fix is already included in the upcoming 22.05 (plus) release and will also be in future CE releases.

              fireodoF 1 Reply Last reply Reply Quote 5
              • stephenw10S
                stephenw10 Netgate Administrator
                last edited by

                Looks like it's already in 2.7 snapshots too if you're able to test one.

                1 Reply Last reply Reply Quote 1
                • fireodoF
                  fireodo @kprovost
                  last edited by

                  @kprovost said in Continuously increasing memory usage since the update to 2.6:

                  The good news is that the fix is already included in the upcoming 22.05 (plus) release and will also be in future CE releases.

                  Dumb Question: is there a command to release that memory on a running system? (I think no)

                  Kettop Mi4300YL CPU: i5-4300Y @ 1.60GHz RAM: 8GB Ethernet Ports: 4
                  SSD: SanDisk pSSD-S2 16GB (ZFS) WiFi: WLE200NX
                  pfsense 2.8.0 CE
                  Packages: Apcupsd, Cron, Iftop, Iperf, LCDproc, Nmap, pfBlockerNG, RRD_Summary, Shellcmd, Snort, Speedtest, System_Patches.

                  K 1 Reply Last reply Reply Quote 0
                  • K
                    kprovost @fireodo
                    last edited by

                    @fireodo There is not, no.

                    That's sort of why we call it 'leaked' memory. It's gone (at least until the system is rebooted). If this were a user space leak you could restart the application to reclaim the memory, but as it's leaking from the kernel you have to restart the kernel (i.e. reboot).

                    fireodoF 1 Reply Last reply Reply Quote 2
                    • fireodoF
                      fireodo @kprovost
                      last edited by fireodo

                      @kprovost said in Continuously increasing memory usage since the update to 2.6:

                      It's gone (at least until the system is rebooted).

                      Understood. Thank you!
                      BTW: I can also confirm this as I made myself researches in this matter on my Lab machine. (Following the instructions in this thread)

                      Best regards,
                      fireodo

                      Kettop Mi4300YL CPU: i5-4300Y @ 1.60GHz RAM: 8GB Ethernet Ports: 4
                      SSD: SanDisk pSSD-S2 16GB (ZFS) WiFi: WLE200NX
                      pfsense 2.8.0 CE
                      Packages: Apcupsd, Cron, Iftop, Iperf, LCDproc, Nmap, pfBlockerNG, RRD_Summary, Shellcmd, Snort, Speedtest, System_Patches.

                      M 1 Reply Last reply Reply Quote 0
                      • fireodoF fireodo referenced this topic on
                      • fireodoF fireodo referenced this topic on
                      • M
                        manueljv2 @fireodo
                        last edited by

                        @fireodo Good day, this problem was solved? I have the same problem and I have not managed to solve it. can help me please

                        572d8cd8-0951-4114-af7c-8b8c288791fe-image.png

                        7ae76760-0a5b-4f6a-827f-4adb435be4d1-image.png

                        a8a5df67-fbbe-48a3-a47b-a371ffb17e87-image.png

                        7e130ad5-90d9-4ed7-b16d-bb111eacbd33-image.png

                        d467f455-f82c-478b-8046-3f3432d6e640-image.png

                        K 1 Reply Last reply Reply Quote 0
                        • K
                          kprovost @manueljv2
                          last edited by

                          @manueljv2 Yes, the fix is in both the current 2.7 snapshots and the upcoming 23.01 plus release.

                          D 1 Reply Last reply Reply Quote 0
                          • D
                            dschmitz @kprovost
                            last edited by

                            @kprovost Has this issue been fixed? I am having the same issues and I am on 23.01.
                            Any ideas?
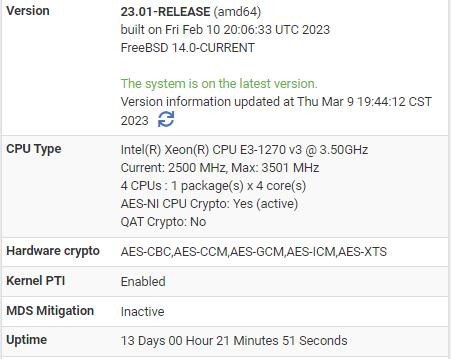
                            059e4b6b-d8fc-49e6-a5f0-e5d4b0f47e8e-image.png
                            5e93c5de-9a5e-445d-95e5-6e5abaa89b5c-image.png
                            43f73b94-7d1a-4005-90fe-797306fb6f56-image.png

                            S 1 Reply Last reply Reply Quote 0
                            • S
                              SteveITS Galactic Empire @dschmitz
                              last edited by

                              @dschmitz said in Continuously increasing memory usage since the update to 2.6:

                              @kprovost Has this issue been fixed? I am having the same issues and I am on 23.01.

                              See
                              https://forum.netgate.com/topic/178568/netgate-1100-high-memory-consumption/4

                              Pre-2.7.2/23.09: Only install packages for your version, or risk breaking it. Select your branch in System/Update/Update Settings.
                              When upgrading, allow 10-15 minutes to restart, or more depending on packages and device speed.
                              Upvote 👍 helpful posts!

                              D 1 Reply Last reply Reply Quote 0
                              • D
                                dschmitz @SteveITS
                                last edited by

                                @steveits Thank you! Have installed the patch and configured the system tunable. Will post back if continue to have issues.

                                K 1 Reply Last reply Reply Quote 0
                                • K
                                  kprovost @dschmitz
                                  last edited by

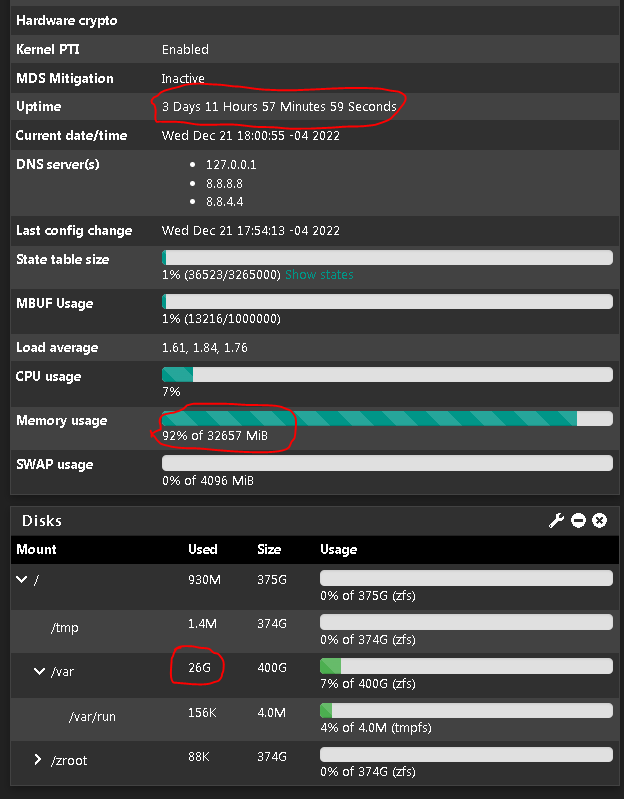
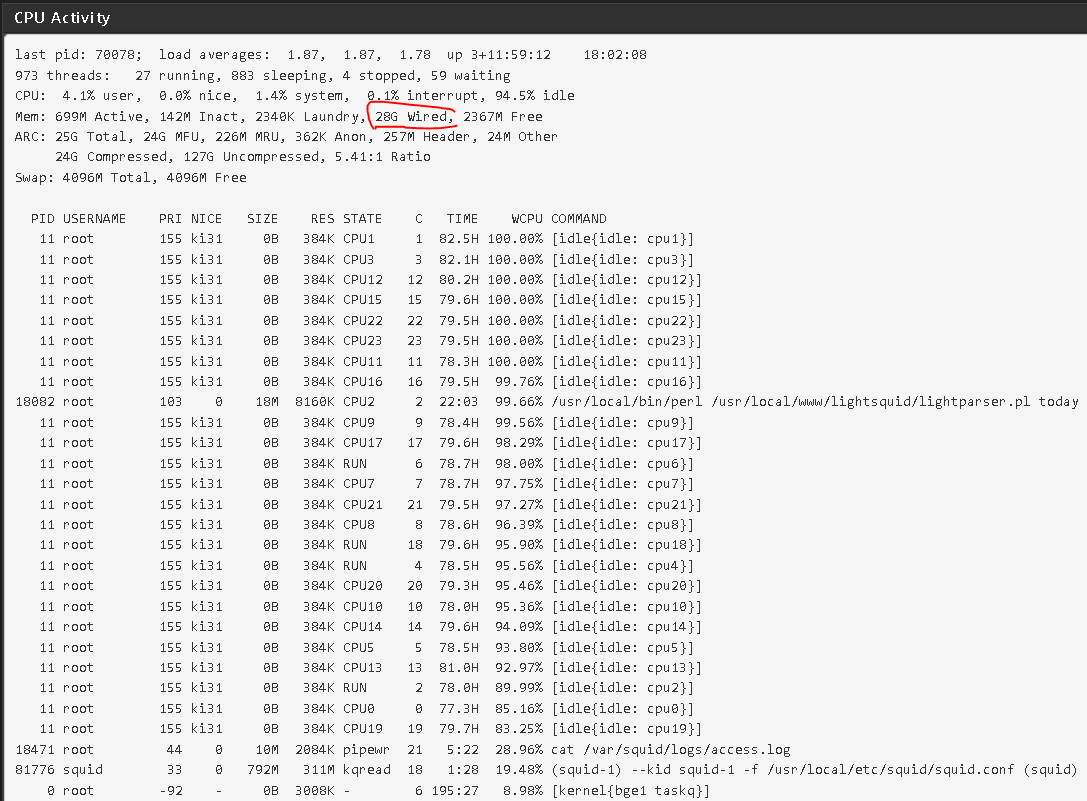
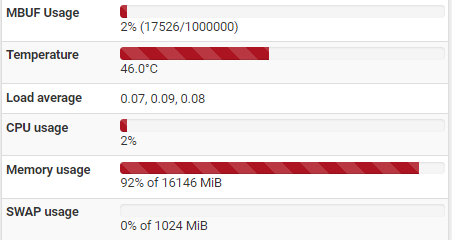
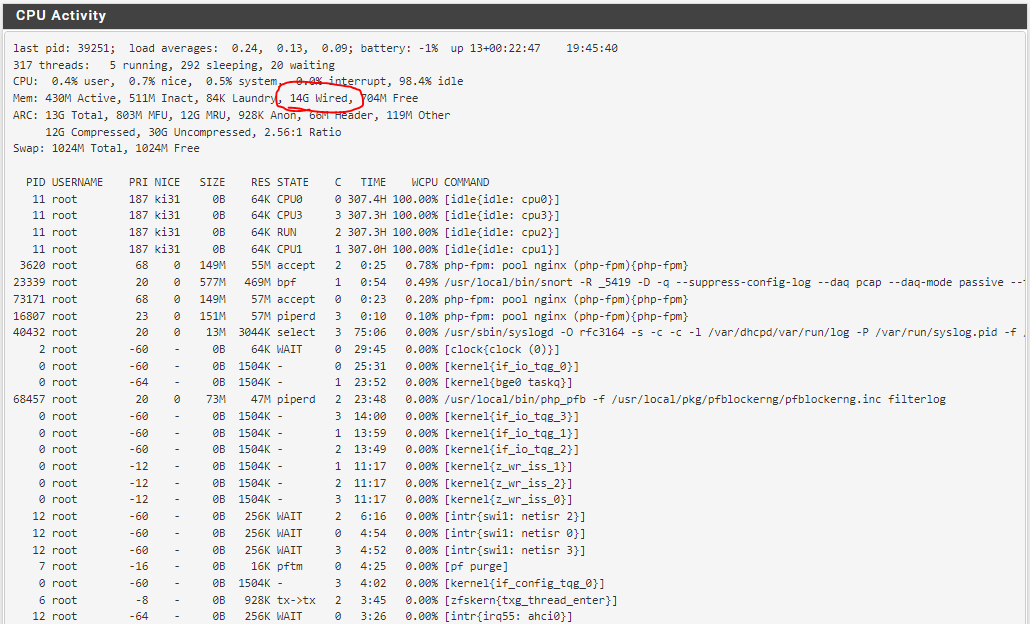
                                  @dschmitz Steve's already pointed you at a way to have the UI show lower memory use, but I wanted to reinforce the point that what your 'top' screenshot shows is not a problem.

                                  It does show that the majority of RAM is in use, but if you look one line lower you can see that 13 out of the 14 GB of wired memory is used by the ARC (ZFS's buffer cache).
                                  That's a good thing. It means that the memory you paid for is doing stuff, rather than sitting around burning electrons for nothing. Once memory is needed for other things (such as pf states, or installing packages or any of the thousands of other things the system does) the ARC will release that memory.

                                  As a general rule, memory usage on modern operating systems is much more complicated than you think it is, even if you take this rule into account.

                                  1 Reply Last reply Reply Quote 2
                                  • fireodoF fireodo referenced this topic on
                                  • First post
                                    Last post
                                  Copyright 2025 Rubicon Communications LLC (Netgate). All rights reserved.