Fatal trap 12
-
You can add it as an attachment if you rename it to .txt. Or post a link to it on pastebin or similar.
Steve
-
@stephenw10 Thanks,
these are the entire log file, one from the j4125 and the other from the i3 -
J4125 BT:
db:0:kdb.enter.default>  bt
Tracing pid 12 tid 100066 td 0xfffff800056d0000
kdb_enter() at kdb_enter+0x37/frame 0xfffffe000048c180
vpanic() at vpanic+0x197/frame 0xfffffe000048c1d0
panic() at panic+0x43/frame 0xfffffe000048c230
trap_fatal() at trap_fatal+0x391/frame 0xfffffe000048c290
trap_pfault() at trap_pfault+0x4f/frame 0xfffffe000048c2e0
trap() at trap+0x286/frame 0xfffffe000048c3f0
calltrap() at calltrap+0x8/frame 0xfffffe000048c3f0
--- trap 0xc, rip = 0xffffffff80e1dfa0, rsp = 0xfffffe000048c4c0, rbp = 0xfffffe000048c4f0 ---
m_copydata() at m_copydata+0x70/frame 0xfffffe000048c4f0
ip_forward() at ip_forward+0x2e5/frame 0xfffffe000048c5c0
ip_input() at ip_input+0x850/frame 0xfffffe000048c670
netisr_dispatch_src() at netisr_dispatch_src+0xca/frame 0xfffffe000048c6c0
ether_demux() at ether_demux+0x16a/frame 0xfffffe000048c6f0
ether_nh_input() at ether_nh_input+0x330/frame 0xfffffe000048c750
netisr_dispatch_src() at netisr_dispatch_src+0xca/frame 0xfffffe000048c7a0
ether_input() at ether_input+0x89/frame 0xfffffe000048c800
vlan_input() at vlan_input+0x23b/frame 0xfffffe000048c860
ether_demux() at ether_demux+0x153/frame 0xfffffe000048c890
ether_nh_input() at ether_nh_input+0x330/frame 0xfffffe000048c8f0
netisr_dispatch_src() at netisr_dispatch_src+0xca/frame 0xfffffe000048c940
ether_input() at ether_input+0x89/frame 0xfffffe000048c9a0
re_rxeof() at re_rxeof+0x5f9/frame 0xfffffe000048ca10
re_intr_msi() at re_intr_msi+0xef/frame 0xfffffe000048ca50
ithread_loop() at ithread_loop+0x23c/frame 0xfffffe000048cab0
fork_exit() at fork_exit+0x7e/frame 0xfffffe000048caf0
fork_trampoline() at fork_trampoline+0xe/frame 0xfffffe000048caf0
--- trap 0, rip = 0, rsp = 0, rbp = 0 ---
Message Buffer:
Loads of:<6>re1: watchdog timeout <6>re1: link state changed to DOWN <6>re1.200: link state changed to DOWN <6>re1.201: link state changed to DOWN <6>re1.107: link state changed to DOWN <6>re1.150: link state changed to DOWN <6>re1.120: link state changed to DOWN <6>re1: link state changed to UP <6>re1.200: link state changed to UP <6>re1.201: link state changed to UP <6>re1.107: link state changed to UP <6>re1.150: link state changed to UP <6>re1.120: link state changed to UPi3 BT:
db:0:kdb.enter.default>  bt
Tracing pid 0 tid 100008 td 0xfffff80005330740
kdb_enter() at kdb_enter+0x37/frame 0xfffffe003df8f5a0
vpanic() at vpanic+0x197/frame 0xfffffe003df8f5f0
panic() at panic+0x43/frame 0xfffffe003df8f650
trap_fatal() at trap_fatal+0x391/frame 0xfffffe003df8f6b0
trap_pfault() at trap_pfault+0x4f/frame 0xfffffe003df8f700
trap() at trap+0x286/frame 0xfffffe003df8f810
calltrap() at calltrap+0x8/frame 0xfffffe003df8f810
--- trap 0xc, rip = 0xffffffff80edb69d, rsp = 0xfffffe003df8f8e0, rbp = 0xfffffe003df8f9b0 ---
rtsock_msg_mbuf() at rtsock_msg_mbuf+0xed/frame 0xfffffe003df8f9b0
rt_newmaddrmsg() at rt_newmaddrmsg+0x108/frame 0xfffffe003df8fa60
if_delmulti_locked() at if_delmulti_locked+0x2a/frame 0xfffffe003df8fa90
if_delmulti_ifma_flags() at if_delmulti_ifma_flags+0x54/frame 0xfffffe003df8fac0
in6m_release_task() at in6m_release_task+0xcd/frame 0xfffffe003df8fb20
taskqueue_run_locked() at taskqueue_run_locked+0x144/frame 0xfffffe003df8fb80
taskqueue_thread_loop() at taskqueue_thread_loop+0xb6/frame 0xfffffe003df8fbb0
fork_exit() at fork_exit+0x7e/frame 0xfffffe003df8fbf0
fork_trampoline() at fork_trampoline+0xe/frame 0xfffffe003df8fbf0
--- trap 0, rip = 0, rsp = 0, rbp = 0 ---
Message buffer has a bunch of:
config_aqm Unable to configure flowset, flowset busy!
config_aqm Unable to configure flowset, flowset busy!
config_aqm Unable to configure flowset, flowset busy!
Ok, these look like completely different crashes.
The first one I would not investigate further with those watchdog timeouts logged in re1. That must be solved first and if you go back to that you should do that by loading the alternative Realtek driver.The second crash is more interesting. Those console errors make it looks like a Limiters issue.
I assume you have Limiters running? How are they configured?Steve
-
@stephenw10 Thank you for the reply and for your time.
The first one I would not investigate further with those watchdog timeouts logged in re1. That must be solved first and if you go back to that you should do that by loading the alternative Realtek driver.
How can I do that?
The configuration is the same but (I restored the J4125 backup on the i3 and I changed the interfaces associations).
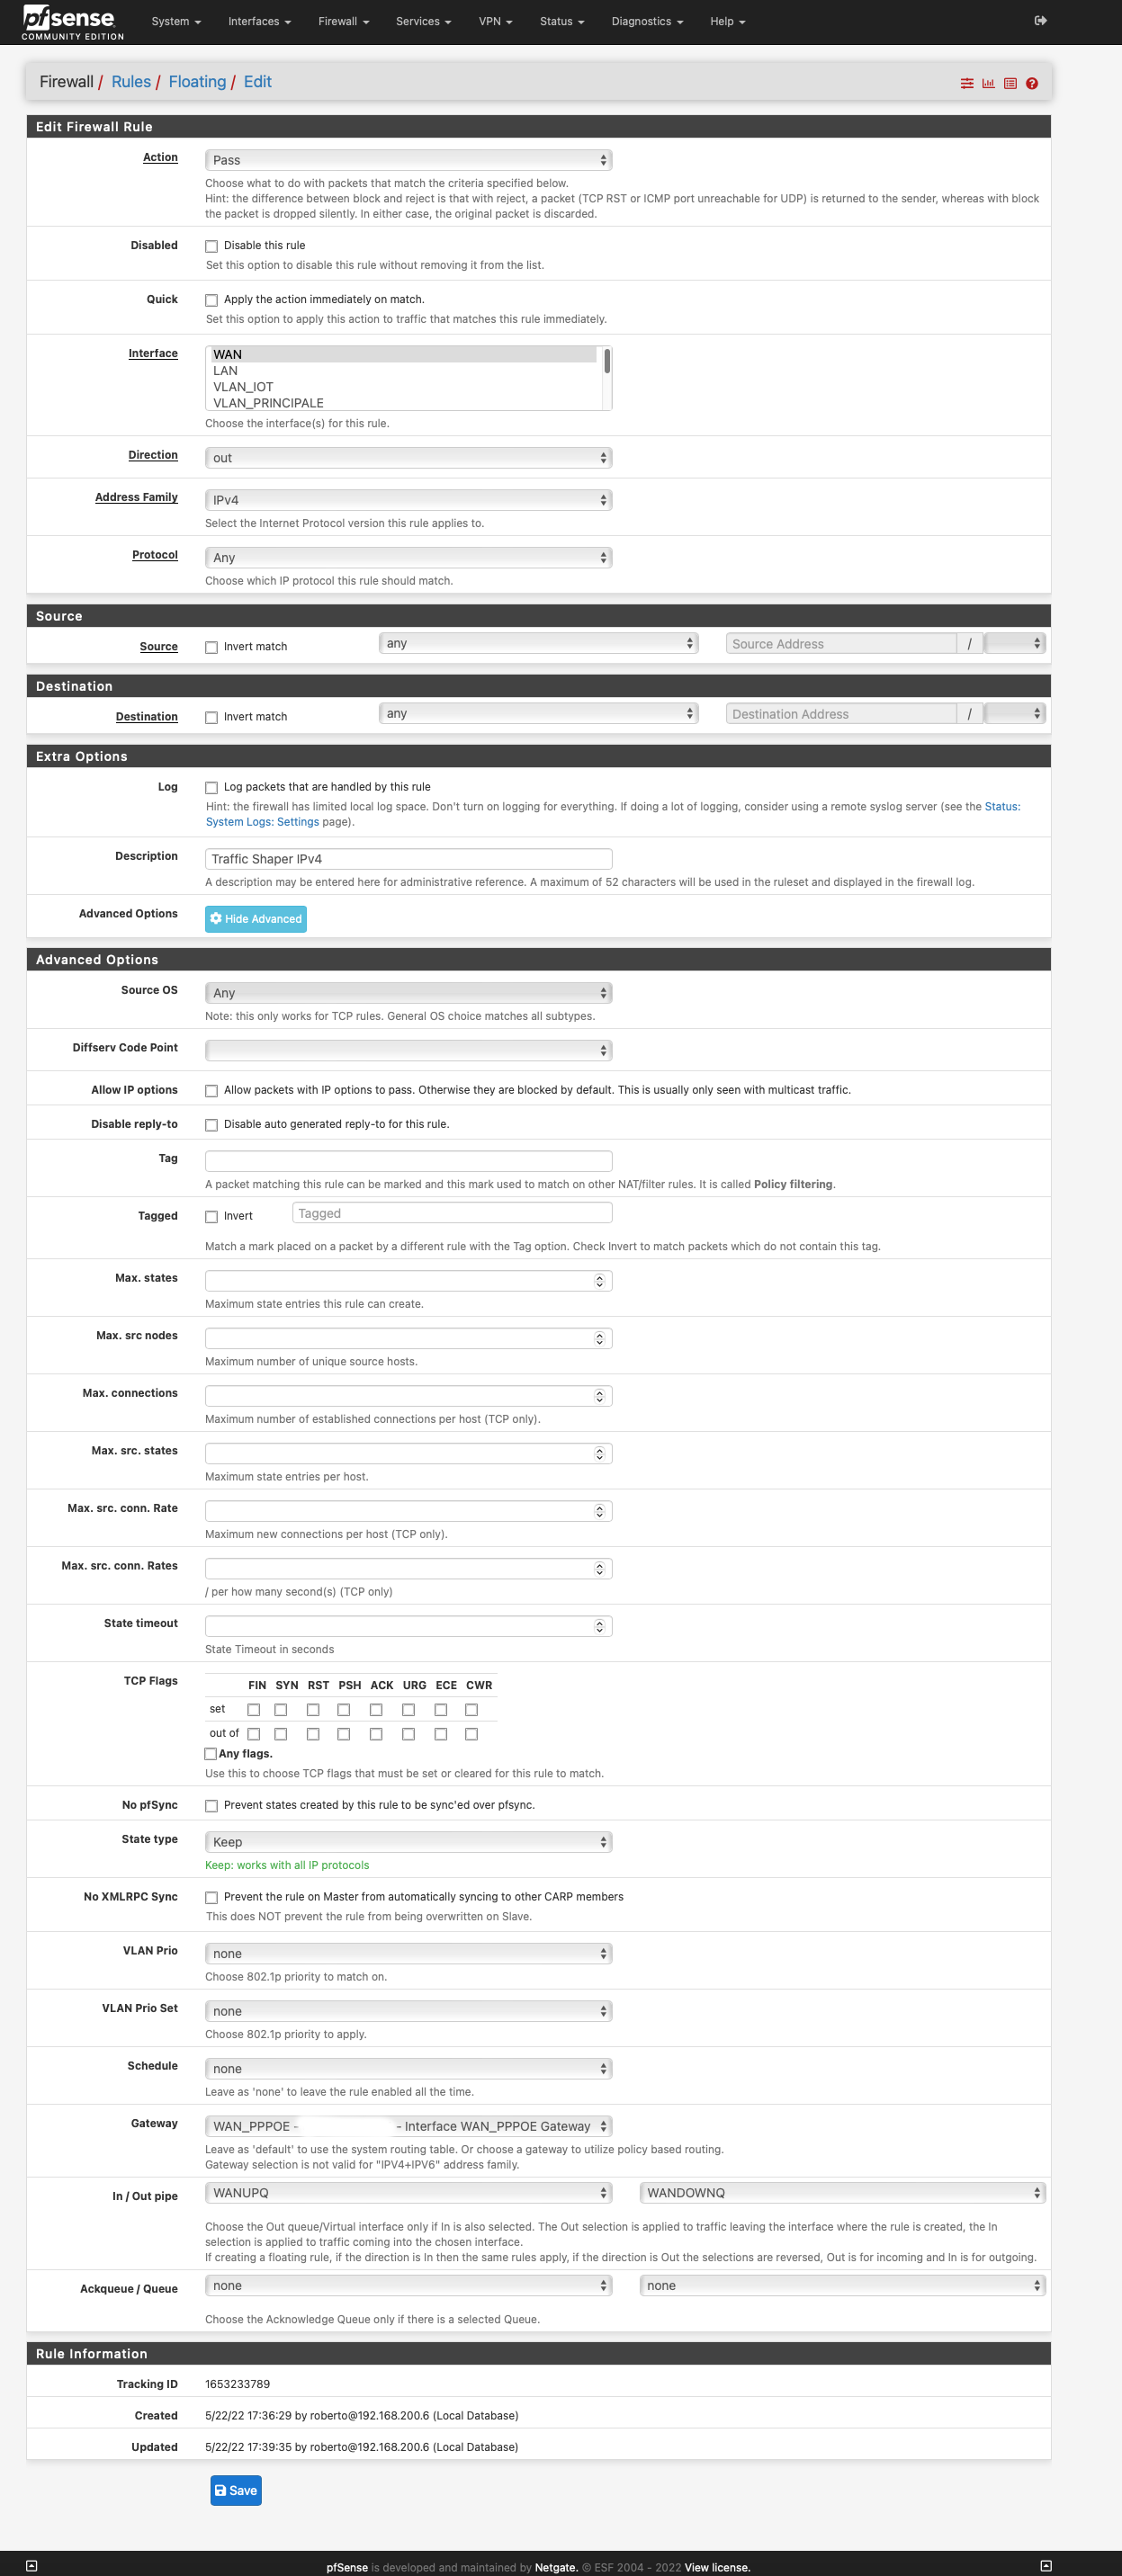
Yes I have limiter active on both
These are how them are configured
Down

Up
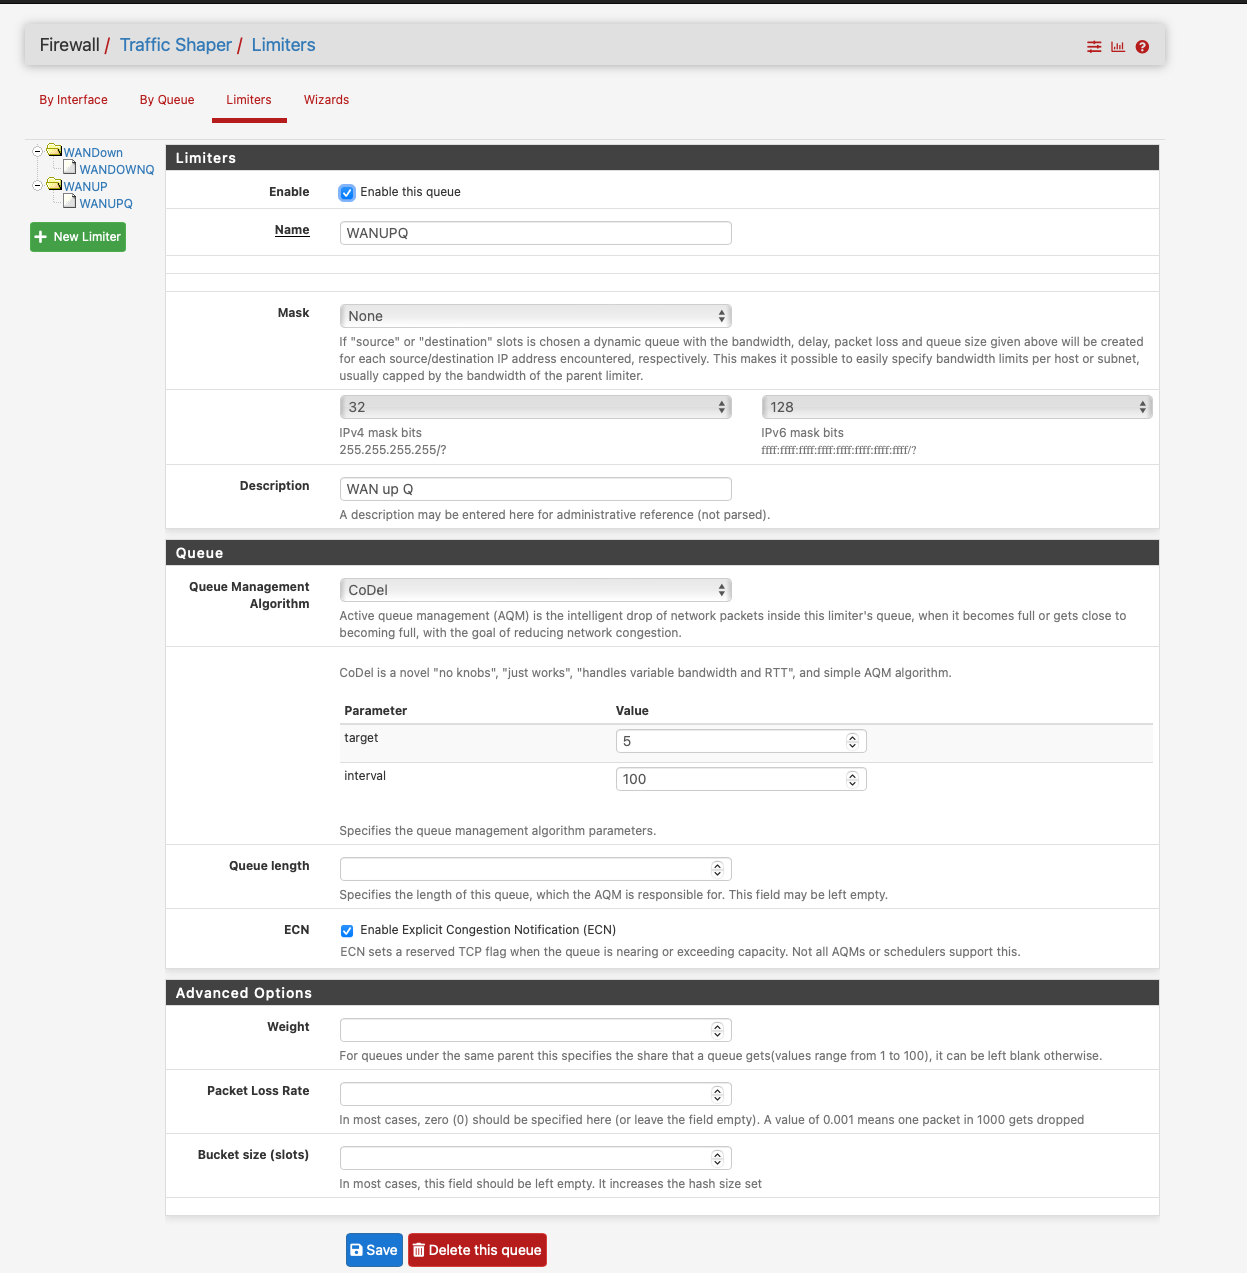
Firewall
I used this video as guide/base setup
https://www.youtube.com/watch?v=iXqExAALzR8Note: Sunday I disabled pfblocker and till now, I have no freeze occur.
So, could that plugin be the cause of my problems? -
@crc_error_79 said in Fatal trap 12:
The first one I would not investigate further with those watchdog timeouts logged in re1. That must be solved first and if you go back to that you should do that by loading the alternative Realtek driver.
How can I do that?By looking up what has been said about Realtek.
There are several threads on the forum that talk about an alternative driver you can install.
See here : https://forum.netgate.com/category/6/hardwareThe best choice is probably : do not use any Realtek NICs. Realteks often create "suffering and pain".
-
@gertjan said in Fatal trap 12:
https://forum.netgate.com/category/6/hardware
Thank you, it just saw an infinite 3rd about the realtek driver.. it really create suffering and pain..
So I think that I will move the pfsense on the i3 with intel card and I will keep this as spare part.
But this machine as problem too, how can I solve?
Little OT, I would like to use the i3 as proxmox machine, if I install pfsense as a vm could I have some problems? performance (gaming), stability, etc
-
It's possible something in pfBlocker is causing it but that would usually be some type of resource exhaustion. The warning in the message buffer really look like some thing in the Limiters. But that could also be related to resource exhaustion.
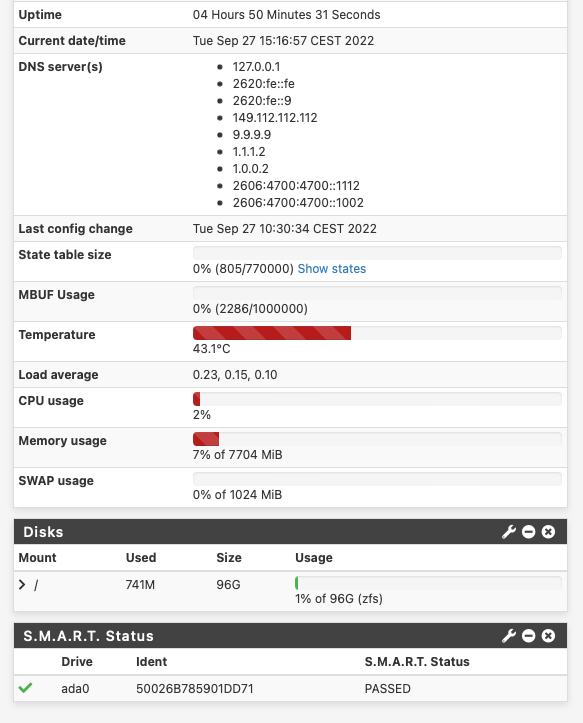
Check the monitoring graphs, make sure nothing it hitting 100%. Memory, mbufs, cpu usage.
There are no errors in the system log before this happens?
How often does it happen?The biggest problem with running pfSense in Proxmox (or any hypervisor) is getting the required isolation between WAN and LAN. Especially when Proxmox is booting for example. It can be done with the right pass-through options, at least once it's booted.
Steve
-
@stephenw10 Thank you
I have never seen those values goes above 10%
The last crash happened 2 days ago when I opened the post.
Sometimes happens randomly and sometimes happens when I apply some firewall rule or after some settings modifications or simply moving from a section to another (ex. from firewall rules to interface assignments etc.) or when I play online games (destiny 2 on ps)But as I said once I remove pfblocker the issue "seems" gone away even with the J4125 (with realteck).
So do you think that it is the realtek card fight agains the limiters?
-
The Realtek watchguard timeout message can happen without any other factor if the hardware doesn't play nice. I would not read anything into that being related to what looks like the Limiters issue.
If you're able to I would try disabling the Limiters and re-enabling pfBlocker to see if that causes a panic and what kind it causes. But I'd only do that if it proves stable with pfBlocker disabled.
Steve
-
@stephenw10 Of course I can!
Till now with "standard" usage (internet, netflix, disney, etc and gaming) it had no freeze.
Now I turned off the limiter reinstalled pfblocker. Let's see..
-
Ciao, @stephenw10
I did some test as suggested.
With pfblocker enabled worked well for 2 days, then it begun to had some random crashes.
These crashes usually happens during video stream (netflix) or watching youtube.
Also, the router crashes even after pressing the "save" button to disable the plugin. But I have no issue when I do the same procedure but to enable it.. very strange.Unfortunately I haven't any log of these situations, usually on the home screen I have a yellow bar with a link, but now after the router reboot, it is like nothing happened.
Now I removed pfblocker and eneble the traffic shaper again and I will do some new test with this settings