ARP reports bogons
-
@stephenw10 that is an arp probe from whatever that ASUSTek device is with mac 78:24:af:36:1a:08
What is odd about it? he is asking if anyone is using that IP, then he sends out a dhcp request asking for that IP.
But you need to look to that client to why its acting like it is.. Not pfsense issue with anything, but probes are common, and so are dhcp requests.
Is the client bouncing between networks, say different wifi networks?
Is it a wifi device? Maybe coming out of sleep/standby - a tablet/phone maybe?
-
@johnpoz How is it not odd,
The client is asking for a IP address of a host on the LAN, and being told it is @ 0.0.0.0 - these are bogus ARP requests.
That has nothing to do with DHCP.
Also, it is not just happening to one host, it happens to all hosts.
It is a ethernet client 1a:08 in specific.
-
@deanfourie said in ARP reports bogans:
The client is asking for a IP address of a host on the LAN, and being told it is @ 0.0.0.0 - these are bogus ARP requests.
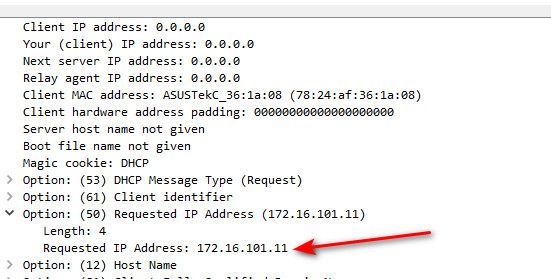
No that is not what is happening at all.. It is sending out a probe, asking if anyone has that 172.16.101.11 address.
It then sends dhcp request asking for the IP..
There is nothing odd in your packet capture at all..
https://www.practicalnetworking.net/series/arp/arp-probe-arp-announcement/
edit: here is my pc sending out a arp probe, when I set its IP - its checking that there are nobody using that IP before it actually uses it. Then it sends out a gratuitous arp, the announcement hey this is the IP I am using, here is my mac - in case you want to talk to me ;)

Here is your capture..
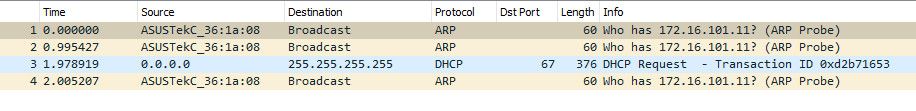
Its asking if anyone using that IP, and then it requests that IP.. etc..
If your seeing floods of these from all your clients - maybe your having an issue with dhcp.. But probes are common on a network. And so are dhcp requests or discovers that would be from a source of 0.0.0.0
-
@johnpoz ok ok it seems I need to go back and study ARP as I thought I had that protocol down. Guess not :(
The next question is, why would I be loosing network and internet access, on then off, on then off. Constantly for like an hour at time?
The client should only request one DHCP lease in the entire night given that it is only connected once to the network correct? So I wouldn't blame DHCP.
Come to think of it, I do remember during the process I was doing a ipconfig and was only getting a link local address.
So something is kicking me off the network and then the DHCP server is unreachable.
-
Yeah, I don't really expect the pfSense ARP table to end up showing all the client MACs as 0.0.0.0. I don't think I've ever seen that before.
It could be that it does go through that when clients send out their DAD probes but it happens so fast that it's never in the table long enough to see.But clients should not be doing that spontaneously when they already had a lease, they should just renew that lease. So, yeah, it looks likely to be some dhcp issue and the most common DHCP issue is some rogue dhcp server on the network.
What do the pfSense dhcp logs show when this is happening?
Steve
-
@deanfourie said in ARP reports bogans:
on then off, on then off. Constantly for like an hour at time?
Well does your client have its gateway in its arp table? Can it query dns? Does it even have an IP?
You sure its not unbound restarting on you - this would mess up internet since dns would be flaky as hell if its restarting ever minute or something. Registering dhcp can do that in your unbound settings.
What is your lease time for your dhcp.. I could see low lease time, lots of clients - they all trying to renew at the same time or near the same time - unbound constantly restarting as clients renew their lease, or get a lease if you have a problem with renewal, etc. etc..
-
@deanfourie Offtopic: would you be so kind and change the subject from "bogans" to "bogons" (helps if someone search something regarding bogons) Thank you!
-
@fireodo changed ;)
-
-
@johnpoz Resolver logs attached. I know that I am updating DNS dynamically with DHCP.
Oct 5 09:46:43 unbound 6151 [6151:0] info: 0.131072 0.262144 20 Oct 5 09:46:43 unbound 6151 [6151:0] info: 0.262144 0.524288 8 Oct 5 09:46:43 unbound 6151 [6151:0] info: 0.524288 1.000000 2 Oct 5 09:46:43 unbound 6151 [6151:0] info: server stats for thread 2: 98 queries, 51 answers from cache, 47 recursions, 0 prefetch, 0 rejected by ip ratelimiting Oct 5 09:46:43 unbound 6151 [6151:0] info: server stats for thread 2: requestlist max 1 avg 0.12766 exceeded 0 jostled 0 Oct 5 09:46:43 unbound 6151 [6151:0] info: average recursion processing time 0.180464 sec Oct 5 09:46:43 unbound 6151 [6151:0] info: histogram of recursion processing times Oct 5 09:46:43 unbound 6151 [6151:0] info: [25%]=0.0770048 median[50%]=0.15401 [75%]=0.231014 Oct 5 09:46:43 unbound 6151 [6151:0] info: lower(secs) upper(secs) recursions Oct 5 09:46:43 unbound 6151 [6151:0] info: 0.000256 0.000512 1 Oct 5 09:46:43 unbound 6151 [6151:0] info: 0.008192 0.016384 1 Oct 5 09:46:43 unbound 6151 [6151:0] info: 0.016384 0.032768 4 Oct 5 09:46:43 unbound 6151 [6151:0] info: 0.032768 0.065536 4 Oct 5 09:46:43 unbound 6151 [6151:0] info: 0.065536 0.131072 10 Oct 5 09:46:43 unbound 6151 [6151:0] info: 0.131072 0.262144 20 Oct 5 09:46:43 unbound 6151 [6151:0] info: 0.262144 0.524288 6 Oct 5 09:46:43 unbound 6151 [6151:0] info: 0.524288 1.000000 1 Oct 5 09:46:43 unbound 6151 [6151:0] info: server stats for thread 3: 127 queries, 66 answers from cache, 61 recursions, 0 prefetch, 0 rejected by ip ratelimiting Oct 5 09:46:43 unbound 6151 [6151:0] info: server stats for thread 3: requestlist max 2 avg 0.131148 exceeded 0 jostled 0 Oct 5 09:46:43 unbound 6151 [6151:0] info: average recursion processing time 0.182965 sec Oct 5 09:46:43 unbound 6151 [6151:0] info: histogram of recursion processing times Oct 5 09:46:43 unbound 6151 [6151:0] info: [25%]=0.0671744 median[50%]=0.159908 [75%]=0.239862 Oct 5 09:46:43 unbound 6151 [6151:0] info: lower(secs) upper(secs) recursions Oct 5 09:46:43 unbound 6151 [6151:0] info: 0.016384 0.032768 6 Oct 5 09:46:43 unbound 6151 [6151:0] info: 0.032768 0.065536 9 Oct 5 09:46:43 unbound 6151 [6151:0] info: 0.065536 0.131072 10 Oct 5 09:46:43 unbound 6151 [6151:0] info: 0.131072 0.262144 25 Oct 5 09:46:43 unbound 6151 [6151:0] info: 0.262144 0.524288 6 Oct 5 09:46:43 unbound 6151 [6151:0] info: 0.524288 1.000000 5 Oct 5 09:46:43 unbound 6151 [6151:0] notice: Restart of unbound 1.15.0. Oct 5 09:46:47 unbound 6151 [6151:0] notice: init module 0: iterator Oct 5 09:46:47 unbound 6151 [6151:0] info: start of service (unbound 1.15.0). Oct 5 09:48:32 unbound 6151 [6151:0] info: service stopped (unbound 1.15.0). Oct 5 09:48:32 unbound 6151 [6151:0] info: server stats for thread 0: 6 queries, 4 answers from cache, 2 recursions, 0 prefetch, 0 rejected by ip ratelimiting Oct 5 09:48:32 unbound 6151 [6151:0] info: server stats for thread 0: requestlist max 0 avg 0 exceeded 0 jostled 0 Oct 5 09:48:32 unbound 6151 [6151:0] info: average recursion processing time 0.134253 sec Oct 5 09:48:32 unbound 6151 [6151:0] info: histogram of recursion processing times Oct 5 09:48:32 unbound 6151 [6151:0] info: [25%]=0 median[50%]=0 [75%]=0 Oct 5 09:48:32 unbound 6151 [6151:0] info: lower(secs) upper(secs) recursions Oct 5 09:48:32 unbound 6151 [6151:0] info: 0.065536 0.131072 1 Oct 5 09:48:32 unbound 6151 [6151:0] info: 0.131072 0.262144 1 Oct 5 09:48:32 unbound 6151 [6151:0] info: server stats for thread 1: 12 queries, 3 answers from cache, 9 recursions, 0 prefetch, 0 rejected by ip ratelimiting Oct 5 09:48:32 unbound 6151 [6151:0] info: server stats for thread 1: requestlist max 1 avg 0.333333 exceeded 0 jostled 0 Oct 5 09:48:32 unbound 6151 [6151:0] info: average recursion processing time 0.136354 sec Oct 5 09:48:32 unbound 6151 [6151:0] info: histogram of recursion processing times Oct 5 09:48:32 unbound 6151 [6151:0] info: [25%]=0.0709973 median[50%]=0.120149 [75%]=0.24576 Oct 5 09:48:32 unbound 6151 [6151:0] info: lower(secs) upper(secs) recursions Oct 5 09:48:32 unbound 6151 [6151:0] info: 0.000512 0.001024 1 Oct 5 09:48:32 unbound 6151 [6151:0] info: 0.032768 0.065536 1 Oct 5 09:48:32 unbound 6151 [6151:0] info: 0.065536 0.131072 3 Oct 5 09:48:32 unbound 6151 [6151:0] info: 0.131072 0.262144 2 Oct 5 09:48:32 unbound 6151 [6151:0] info: 0.262144 0.524288 2 Oct 5 09:48:32 unbound 6151 [6151:0] info: server stats for thread 2: 5 queries, 1 answers from cache, 4 recursions, 0 prefetch, 0 rejected by ip ratelimiting Oct 5 09:48:32 unbound 6151 [6151:0] info: server stats for thread 2: requestlist max 0 avg 0 exceeded 0 jostled 0 Oct 5 09:48:32 unbound 6151 [6151:0] info: average recursion processing time 0.227218 sec Oct 5 09:48:32 unbound 6151 [6151:0] info: histogram of recursion processing times Oct 5 09:48:32 unbound 6151 [6151:0] info: [25%]=0.065536 median[50%]=0.098304 [75%]=0.131072 Oct 5 09:48:32 unbound 6151 [6151:0] info: lower(secs) upper(secs) recursions Oct 5 09:48:32 unbound 6151 [6151:0] info: 0.032768 0.065536 1 Oct 5 09:48:32 unbound 6151 [6151:0] info: 0.065536 0.131072 2 Oct 5 09:48:32 unbound 6151 [6151:0] info: 0.524288 1.000000 1 Oct 5 09:48:32 unbound 6151 [6151:0] info: server stats for thread 3: 12 queries, 5 answers from cache, 7 recursions, 0 prefetch, 0 rejected by ip ratelimiting Oct 5 09:48:32 unbound 6151 [6151:0] info: server stats for thread 3: requestlist max 1 avg 0.142857 exceeded 0 jostled 0 Oct 5 09:48:32 unbound 6151 [6151:0] info: average recursion processing time 0.233964 sec Oct 5 09:48:32 unbound 6151 [6151:0] info: histogram of recursion processing times Oct 5 09:48:32 unbound 6151 [6151:0] info: [25%]=0.08192 median[50%]=0.120149 [75%]=0.212992 Oct 5 09:48:32 unbound 6151 [6151:0] info: lower(secs) upper(secs) recursions Oct 5 09:48:32 unbound 6151 [6151:0] info: 0.032768 0.065536 1 Oct 5 09:48:32 unbound 6151 [6151:0] info: 0.065536 0.131072 3 Oct 5 09:48:32 unbound 6151 [6151:0] info: 0.131072 0.262144 2 Oct 5 09:48:32 unbound 6151 [6151:0] info: 0.524288 1.000000 1 Oct 5 09:48:32 unbound 6151 [6151:0] notice: Restart of unbound 1.15.0. Oct 5 09:48:36 unbound 6151 [6151:0] notice: init module 0: iterator Oct 5 09:48:36 unbound 6151 [6151:0] info: start of service (unbound 1.15.0). Oct 5 10:27:24 unbound 6151 [6151:0] info: service stopped (unbound 1.15.0). Oct 5 10:27:25 unbound 6151 [6151:0] info: server stats for thread 0: 146 queries, 50 answers from cache, 96 recursions, 0 prefetch, 0 rejected by ip ratelimiting Oct 5 10:27:25 unbound 6151 [6151:0] info: server stats for thread 0: requestlist max 2 avg 0.114583 exceeded 0 jostled 0 Oct 5 10:27:25 unbound 6151 [6151:0] info: average recursion processing time 0.260150 sec Oct 5 10:27:25 unbound 6151 [6151:0] info: histogram of recursion processing times Oct 5 10:27:25 unbound 6151 [6151:0] info: [25%]=0.0786432 median[50%]=0.180224 [75%]=0.323825 Oct 5 10:27:25 unbound 6151 [6151:0] info: lower(secs) upper(secs) recursions Oct 5 10:27:25 unbound 6151 [6151:0] info: 0.000256 0.000512 1 Oct 5 10:27:25 unbound 6151 [6151:0] info: 0.016384 0.032768 8 Oct 5 10:27:25 unbound 6151 [6151:0] info: 0.032768 0.065536 12 Oct 5 10:27:25 unbound 6151 [6151:0] info: 0.065536 0.131072 15 Oct 5 10:27:25 unbound 6151 [6151:0] info: 0.131072 0.262144 32 Oct 5 10:27:25 unbound 6151 [6151:0] info: 0.262144 0.524288 17 Oct 5 10:27:25 unbound 6151 [6151:0] info: 0.524288 1.000000 7 Oct 5 10:27:25 unbound 6151 [6151:0] info: 1.000000 2.000000 3 Oct 5 10:27:25 unbound 6151 [6151:0] info: 2.000000 4.000000 1 Oct 5 10:27:25 unbound 6151 [6151:0] info: server stats for thread 1: 236 queries, 102 answers from cache, 134 recursions, 0 prefetch, 0 rejected by ip ratelimiting Oct 5 10:27:25 unbound 6151 [6151:0] info: server stats for thread 1: requestlist max 2 avg 0.11194 exceeded 0 jostled 0 Oct 5 10:27:25 unbound 6151 [6151:0] info: average recursion processing time 0.221942 sec -
@deanfourie so that is not very long, you have 2 restarts of unbound in what 2 minutes, and a total time of 41 minutes.
And looks like you just cut off the 3rd restart, since I see a stop.
So 3 restarts in 40 minutes? That doesn't bode well for any sort of cache, since its flushed when it restarts. And while its restarting any dns query would fail, etc.
Mine on the other hand, which the last restart was me doing on purpose because adding a host override for a thread here has been up for 36 hours.
[22.05-RELEASE][admin@sg4860.local.lan]/root: unbound-control -c /var/unbound/unbound.conf status
version: 1.15.0
verbosity: 1
threads: 4
modules: 2 [ validator iterator ]
uptime: 130866 seconds
options: control(ssl)
unbound (pid 77646) is running...
130k seconds is like 36+ hours.
I would turn off registration of your dhcp leases, and see if your internet issues go away.
-
Not a huge number of restarts there. Was there an incident of this sort during that period?
-
@stephenw10 no this seems to be the norm.
-
@stephenw10 so can anyone explain these then? Why is arpwatch reporting bogons on these macs?
I see now also that there are some autoconfiguration ips in there too.
Oct 5 13:13:53 arpwatch 13361 bogon 0.0.0.0 c0:33:5e:31:9e:87 Oct 5 13:13:54 arpwatch 13361 bogon 0.0.0.0 c0:33:5e:31:9e:87 Oct 5 13:13:55 arpwatch 13361 bogon 0.0.0.0 c0:33:5e:31:9e:87 Oct 5 14:00:00 php 71752 [pfBlockerNG] Starting cron process. Oct 5 14:00:06 php 71752 [pfBlockerNG] No changes to Firewall rules, skipping Filter Reload Oct 5 14:46:03 arpwatch 13361 bogon 0.0.0.0 c0:33:5e:31:9e:87 Oct 5 14:46:04 arpwatch 13361 bogon 0.0.0.0 c0:33:5e:31:9e:87 Oct 5 14:46:05 arpwatch 13361 bogon 0.0.0.0 c0:33:5e:31:9e:87 Oct 5 14:46:06 arpwatch 13361 bogon 169.254.179.66 c0:33:5e:31:9e:87 Oct 5 14:46:06 arpwatch 13361 bogon 169.254.179.66 c0:33:5e:31:9e:87 Oct 5 14:46:07 arpwatch 13361 bogon 169.254.179.66 c0:33:5e:31:9e:87 Oct 5 15:00:00 php 78045 [pfBlockerNG] Starting cron process. Oct 5 15:00:07 php 78045 [pfBlockerNG] No changes to Firewall rules, skipping Filter Reload Oct 5 15:11:21 arpwatch 13361 bogon 0.0.0.0 c0:33:5e:31:9e:87 Oct 5 15:11:21 arpwatch 13361 bogon 169.254.179.66 c0:33:5e:31:9e:87 Oct 5 15:11:21 arpwatch 13361 bogon 169.254.179.66 c0:33:5e:31:9e:87 Oct 5 15:11:22 arpwatch 13361 bogon 0.0.0.0 c0:33:5e:31:9e:87 Oct 5 15:11:23 arpwatch 13361 bogon 0.0.0.0 c0:33:5e:31:9e:87 Oct 5 15:11:24 arpwatch 13361 bogon 169.254.179.66 c0:33:5e:31:9e:87 Oct 5 15:37:27 arpwatch 13361 bogon 0.0.0.0 c4:9d:ed:b2:2e:ea Oct 5 15:37:28 arpwatch 13361 bogon 0.0.0.0 c4:9d:ed:b2:2e:ea Oct 5 15:37:29 arpwatch 13361 bogon 0.0.0.0 c4:9d:ed:b2:2e:ea -
That is almost certainly a host running a dhcp client. It's expected to use 0.0.0.0 as the source IP at least initially.
The interesting thing there is that it appears to fail to find a dhcp server because it default to a 169.254 APIPA address that Windows self assigns itself when it can't.Are you using pfSense for DHCP? Do you see anything in the dhcp log at those times from that MAC?
Steve
-
@stephenw10 yea I've checked that.
I see nothing in the pfSense DHCP logs (yes using pfSense to hand out DHCP).
I am also using a wifi ap running OpenWRT broadcasting 2 SSIDs on 2 separate VLANs, the wifi AP has a DHCP server on the one VLAN which is not accessible by the LAN, and no DHCP server on the LAN VLAN as this is handled by pfSense so I doubt this is it.
It was hapenning again last night.
Should I not see DHCP offers in a capture if it was a rogue DHCP server?
-
@deanfourie that also reflects the behavior as during the time it goes down, if I try ipconfig /renew it fails to contact a dhcp server
-
@deanfourie said in ARP reports bogons:
if I try ipconfig /renew it fails to contact a dhcp server
Well yeah if your devices loose their ips nothing is going to work. And as they get closer to their lease expire they will start screaming for renew.. faster and faster.. Until it finally expires, then they will send out a discover..
-
You wouldn't see offers in pfSense because they are sent to the clients dircetly.
However you would expect to see something on the client. Even if it was from the wrong server.
This starts to feel more like something blocking DHCP or possibly blocking broadcasts. Though the initial dhcp renewal would not be broadcast.
Are you only seeing this on the subnet accessed via the OpenWRT AP?
Do you have any additional packages running on the AP?
Check the logs in OpenWRT for anything odd at that time.
Steve
-
@stephenw10 In my logs I am seeing a LOT of DHCP traffic.
I am seeing a lot of DHCP ACS's and REQUESTS, but very few OFFERS. Normal?
