pfSense GUI damn(!) slow due to ^Firewall Logs^ widget
-
@louis2 The most time consuming / performance hungy widget in our experience are firewall logs (that don't make sense for me on a dashboard as theres less info then necessary for me to look at) and the traffic graphs. Removing those widgets were always a huge performance boost and all nagging about "pfsense / the firewall being super slow" vanished instantly.
So would be interesting in your case to remove them both and check the speed of the dashboard again?
Cheers
-
Since I am investigating, I am sitting behind the pc, and did test it instantly.
But it is not true, it is really the firewall log widget ! Removing the traffic graphs has no or little impact
-
I am analyzing the widget. From what I think to know now.
Layout ^filter.log^
<134>1
2022-11-17 # date
T11:03:43.334983+01:00 # time
pfSense.lan # # pfsense domain
filterlog 72303 - - # ?
963, # ?
, # ?
, # ?
1558685482, # ?
lagg1.18, # vlan
match, # mached a rule
block, # result = block
in, # ?
4, # ?
0x0, # ?
, # ?
1, # ?
62353, # ?
0, # ?
none, # ?
103, # ?
pim, # protocol ?
46, # ?
192.168.18.1, # source
224.0.0.13, # destination
datalength=26 # package lengthColumns shown in widget
Act Time IF Source Destination$user_settings # the user defined settings
$nentries # seems to define the filter based on user settings
$iface_descr_arr # used to convert technical interface name to ^IF^
$filterfieldsarray # ?? During filling of the the array interface technical names are converted to interface names using the $filterfieldsarray
$filterlog # ??? Filerlog is filled using >>conv_log_filter<< which is using the $filter_logfile and $filterfieldsarray and also the user defined $nentries
$filterent # Seems to be an element of $filterlog
$filterent # Seems to be an array as well haveing the following fields: 'rulenum' 'tracker' 'act' 'time' 'interface' 'srcIP' 'dstIP' 'dstport'
There seems to be an option for an reverse DNS-lookupAmong other things for better understanding:
- need the definition of the logfile
- need the code / of "conv_log_filter"
ANd it would be nice to have a function to lookup the firewall rule attributes among them "description" ion order to add that to the widget layout !!!

-
@louis2 said in pfSense GUI damn(!) slow due to ^Firewall Logs^ widget:
But it is not true, it is really the firewall log widget ! Removing the traffic graphs has no or little impact
Interesting. In a few cases that really had more impact than the firewall one, but good to know. Personally I don't see much use for the firewall widget but it shouldn't slow the dash down so much, sure.
Nevertheless we never got much use out of that small widget concerning rulesets as either there's too much to display (too many pps that are displayed for it to make sense) or if there IS an interesting hit, it can go away too quickly or doesn't display the information needed. So I have to hop to the firewall log screen anyway. -
If I log into the FW for some reason, to add or change something, I am not always going to check the logs.
However the first thing I do after a login, is look at e.g. that Firewall widget to see if there is something strange.
For a deeper investigation, I use the logs and or perhaps even more often wireshark
-
@louis2 said in pfSense GUI damn(!) slow due to ^Firewall Logs^ widget:
However the first thing I do after a login, is look at e.g. that Firewall widget to see if there is something strange.
Just curious: How long is your widget to display? I have a great number of customers where that wouldn't do anything to help me see "anything strange" as the default blocking on WAN is simply too much noise and disabling it you don't see the stuff that hits you anymore. But in bigger setups those logs are shipped off the firewall to log/monitoring systems (like graylog etc.) to correlate with other systems anyway.
-
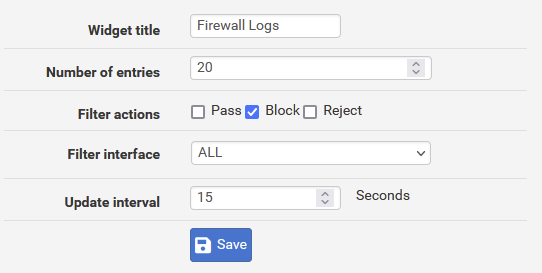
I defined 20 entrys refresh 15 seconds. It just give a first impression. But IHMO not unimportant.
For private use you normally do not have a syslog/greylog server. The local log is mostly enough.
However since 2.7 or at least since that time frame, my IPV6 gateway widget turns red. After some investigation I know, that despite the "interface being red" it is working

For that reason I installed an greylog instance on my NAS, but up to now I could not find a course. In fact I stopped my investigation effort hoping that the problem would be gone with the introduction of FreeBSD 14-current. However the issue is still there

-
Do you see the same delay when the widget refreshes?
Or rather you've set the update to 15s but it creates a similar length delay when you load the page. Does it result in a 30s refresh?
Steve
-
If I am on looking at the Dashboard page, I do not notice any strange thing. The traffic graphs are very nicely constantly updated etc, without any falter.
If I change the refresh interval e.g. to two seconds, the behavoir does not change
-
Hmm, and the firewall logs widget does update?
If so that implies it only affects the initial load and not the update, which must parse the same data.
-
The fact that I do not see any thing special in regard to the dashboard behavoir, does not say much.
The only thing you can conclude is that the dashboard page is waiting for the widget before it opens.
At the moment the dashboard is there, it is not so easy to say how long it takes the more or less static widget to refresh itself. The more because I did set the refresh time to 15 seconds which is not far apart from the about 16 seconds it takes for the widget to refresh itself
-
Try adding a block rule with logging for something you can generate, a local ping for example. Then you should see that with new hits each time it updates.
That seems pretty key to understanding where the delay is if it can refresh the data there without an issue.
What sort of timing values do you see if you open the dash in a browser profiler?
On a 6100 I see log widget takes almost exactly 2.2s each refresh. That seems slow to me but is much faster than 16s. And it's exactly the same the first time it loads after I refresh the page. -
Nop I did some tests:
- When I try to go to the widgets settings menu, I have immediate
reaction - when putting save it takes ... long
- when I set the refresh time to two seconds and generate alarm, then do not occur any longer !!
We are trying to analyze the problem by looking from the outside. If I could create a package containing the widget code and those of the functions it calls, then I could modify the code and test where it goes wrong and trying to improve that.
I / we need some means to test the equivalent of the widget without having to compile pfSense as a whole
- When I try to go to the widgets settings menu, I have immediate
-
Hmm, failing to update below 5s was a known issue. That should be fixed but I wonder if there has been a regression: https://redmine.pfsense.org/issues/12673
You should add a note there if it fails to update again.Steve
-
I did add the following to the bug log. Should be reopened or a new one created
The problem is clear to me. If the widget processing time > than the refresh time the widget will be re triggered before the screen could be updated. The widget is extremely slow due to design errors.
An obvious one is the fact that it is reading the log and it probably has to read the whole error log due to the possible selection criteria lets take two scenarios:
- the positive one: The selection is ALL in combination with blocked. Lets assume that the probability of a block in an given firewallog is 1:5 and the requested number of messages is 20. In that case processing of 150 log entry's is almost certain enough
- the bad one: I select one out of 15 interfaces and I select an interface with hardly any or no traffic ...... you have to read the multi thousand line firewallog and will perhaps even then not 20 lines matching the scenario
Apart from this principle issue, my feeling is that some code speedup is also possible
-
That should probably be a separate but related bug.
-
I leave the way it is accounted to NetGate however IMHO it is one and the same problem. Design and original 'not fix' are simply not OK.
Note that in my scenario, where I have as selection ALL and a block to pass ratio of about 2, even processing of 50 lines would probably do
Apart form e.g. an selection of max an arbitrary max number of lines to be processed (250 ???), I think the code should be "more effective"
-
I agree. It's odd that it's affecting you so badly though. I can't get anything line that delay on test devices here.
Were you able to profile it in a browser? Are you seeing a longer than 2.2s for the widget? -
Stephen the reason that I did change the widget refresh time from 15 back to 2 seconds is that I tried to check its response on new alarms. You know the result, no updates at all. But also a better understanding from what is happening.
You will never be able to see changes faster that the widget processing time.
I think that code changes can make the widget one or two magnitudes faster.
And If I would have the option to develop a ^new widget^ >> (initially) as a stand alone package as an add on to pfsense << as a command line program or html screen
- based on the actual widget code
- a copy of the related to conv_log_filter,
- the code to retrieve the interface definitions
- and the code to retrieve the definition of a rule based on its key
Perhaps I would perhaps try to do that. I would be surprised if I at the end, would not manage to have the same functionality, with as performance allows adding the rule description in the second line, with significant better performance.
However it must be doable from the effort point of view and that is for sure only possible, if you can develop it a separate ^add in^.
-
@louis2 said in pfSense GUI damn(!) slow due to ^Firewall Logs^ widget:
You will never be able to see changes faster that the widget processing time.
That's why I Use these settings :
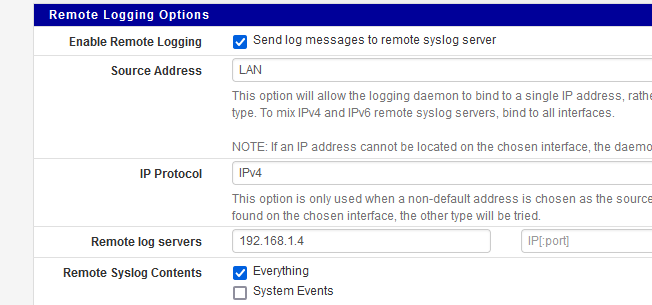
I see the logs immediately when they come in, using a syslog 'server' tool on my NAS.
I don't use pfSense to store the logs, as it its not designed to do so (disk space).
If something goes wrong with pfSense (disk issue, or worse) I have a trace on another device for post-mortem analyses.
Better filter capabilities.Btw : I'm not even using this view :
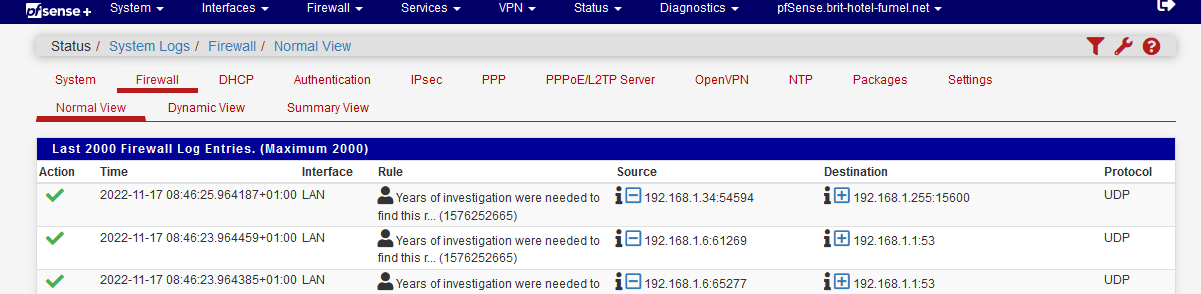
Still wondering why your widget is so slow .....
Mine is working well even when I start to log 'everything'. With a minor dashboard delay, that's for sure.