pfSense GUI damn(!) slow due to ^Firewall Logs^ widget
-
The fact that I do not see any thing special in regard to the dashboard behavoir, does not say much.
The only thing you can conclude is that the dashboard page is waiting for the widget before it opens.
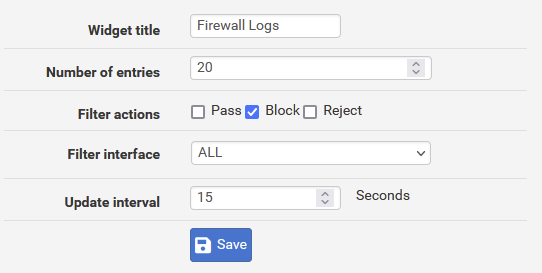
At the moment the dashboard is there, it is not so easy to say how long it takes the more or less static widget to refresh itself. The more because I did set the refresh time to 15 seconds which is not far apart from the about 16 seconds it takes for the widget to refresh itself
-
Try adding a block rule with logging for something you can generate, a local ping for example. Then you should see that with new hits each time it updates.
That seems pretty key to understanding where the delay is if it can refresh the data there without an issue.
What sort of timing values do you see if you open the dash in a browser profiler?
On a 6100 I see log widget takes almost exactly 2.2s each refresh. That seems slow to me but is much faster than 16s. And it's exactly the same the first time it loads after I refresh the page. -
Nop I did some tests:
- When I try to go to the widgets settings menu, I have immediate
reaction - when putting save it takes ... long
- when I set the refresh time to two seconds and generate alarm, then do not occur any longer !!
We are trying to analyze the problem by looking from the outside. If I could create a package containing the widget code and those of the functions it calls, then I could modify the code and test where it goes wrong and trying to improve that.
I / we need some means to test the equivalent of the widget without having to compile pfSense as a whole
- When I try to go to the widgets settings menu, I have immediate
-
Hmm, failing to update below 5s was a known issue. That should be fixed but I wonder if there has been a regression: https://redmine.pfsense.org/issues/12673
You should add a note there if it fails to update again.Steve
-
I did add the following to the bug log. Should be reopened or a new one created
The problem is clear to me. If the widget processing time > than the refresh time the widget will be re triggered before the screen could be updated. The widget is extremely slow due to design errors.
An obvious one is the fact that it is reading the log and it probably has to read the whole error log due to the possible selection criteria lets take two scenarios:
- the positive one: The selection is ALL in combination with blocked. Lets assume that the probability of a block in an given firewallog is 1:5 and the requested number of messages is 20. In that case processing of 150 log entry's is almost certain enough
- the bad one: I select one out of 15 interfaces and I select an interface with hardly any or no traffic ...... you have to read the multi thousand line firewallog and will perhaps even then not 20 lines matching the scenario
Apart from this principle issue, my feeling is that some code speedup is also possible
-
That should probably be a separate but related bug.
-
I leave the way it is accounted to NetGate however IMHO it is one and the same problem. Design and original 'not fix' are simply not OK.
Note that in my scenario, where I have as selection ALL and a block to pass ratio of about 2, even processing of 50 lines would probably do

Apart form e.g. an selection of max an arbitrary max number of lines to be processed (250 ???), I think the code should be "more effective"
-
I agree. It's odd that it's affecting you so badly though. I can't get anything line that delay on test devices here.
Were you able to profile it in a browser? Are you seeing a longer than 2.2s for the widget? -
Stephen the reason that I did change the widget refresh time from 15 back to 2 seconds is that I tried to check its response on new alarms. You know the result, no updates at all. But also a better understanding from what is happening.
You will never be able to see changes faster that the widget processing time.
I think that code changes can make the widget one or two magnitudes faster.
And If I would have the option to develop a ^new widget^ >> (initially) as a stand alone package as an add on to pfsense << as a command line program or html screen
- based on the actual widget code
- a copy of the related to conv_log_filter,
- the code to retrieve the interface definitions
- and the code to retrieve the definition of a rule based on its key
Perhaps I would perhaps try to do that. I would be surprised if I at the end, would not manage to have the same functionality, with as performance allows adding the rule description in the second line, with significant better performance.
However it must be doable from the effort point of view and that is for sure only possible, if you can develop it a separate ^add in^.
-
@louis2 said in pfSense GUI damn(!) slow due to ^Firewall Logs^ widget:
You will never be able to see changes faster that the widget processing time.
That's why I Use these settings :

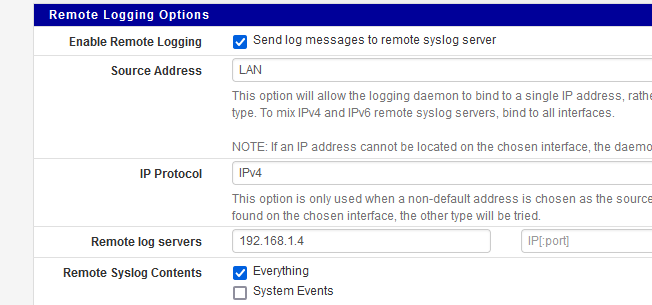
I see the logs immediately when they come in, using a syslog 'server' tool on my NAS.
I don't use pfSense to store the logs, as it its not designed to do so (disk space).
If something goes wrong with pfSense (disk issue, or worse) I have a trace on another device for post-mortem analyses.
Better filter capabilities.Btw : I'm not even using this view :

Still wondering why your widget is so slow .....
Mine is working well even when I start to log 'everything'. With a minor dashboard delay, that's for sure. -
I did create my own version of the widget, which was a lot easier than I expected, due to the fact that every things seems to be PHP and Ajax. So no needed to compile or link something.
So I copied all the related files and started the widget under a new name. Before doing that, I had added time log statements in the code, to be able to identify the problem.
Initially my verdict was the php code especially the "conv_log_filter". Despite mixed feelings related to the filter mechanism, the main problem turned out to be elsewhere.
.... in the widget / html framework.No Idea what .. something for Netgate to investigate. For more details see my comments added to the
https://redmine.pfsense.org/issues/12673
-
I solved the problem. My own version of the widget is > 15 times faster. What a pity is, that I had to sacrifice my idea of adding the firewall description in the second line.
The problem turned out to be the rule-lookup and that is the one I would need for that functionality
-
@louis2 so your saying in your code need to just // a line, or in the current widget can just // a line and speed it up?
"What ever for now I fixed it by simply adding "//" in front of the rule line."
-
Yep sometimes :) Look at what I have added to the redmine ticket https://redmine.pfsense.org/issues/12673
I had to disable the rule lookup, which is a pity, since I had in mind to use the rule description. And of course also the question "is it not possible to speedup the rule lookup"
But further on have look at the ticket and if you want, I did attach my code (on my machine 150 times faster)
-
@louis2 yeah I saw that - but was not clear if you just commented out a line your code, or the original code?
-
I wonder if it is related to this https://forum.netgate.com/topic/176011/php-fpm-consumes-100-one-cpu-core
-
John, that change 'remove the line' which was in the actual version as far as I could see useless, did the job.
I made some other changes, because I thought that it might help e.g. I did split the "php + html" loop in two loops, with the idea that switching n-times could cause overhead issues (I do not know to which extend).
I also raised the number of logitems to be investigated form 50 to 100 since 50 is too low in my feeling, I I could performance wise afford to do that.
Whats ever in the zip I attached you can find the original version and my version. So if you take a tool like Beyond Compare, you can exactly see what I changed and how I tested.
-
@louis2 hehe - yeah I could do that, but I was more hoping all you did really was comment one line in the widget - was to point out exactly what file, you seem to have already mentioned the line in the redmine.
Then I could make a very simple change on mine and see if it speeds anything up ;)
-
@louis2 said in pfSense GUI damn(!) slow due to ^Firewall Logs^ widget:
And of course also the question "is it not possible to speedup the rule lookup"
According to your redmine :
conclusion is that the line "$rule = find_rule_by_number($filterent['rulenum'], $filterent['tracker'], $filterent['act']); is causing the problem.
The function find_rule_by_number() is nothing special, but ..... we find our "pfctl".
Read this :
Strange error: There were error(s) loading the rules: pfctl: pfctl_rulesThere is a known issue with "pfctl", this issue is known for "22.05" kernel versions (12.3) and a patch kernel is available. (afaik : for the 12.3 FreeBSD version)
The thing is, you are using "2.7.0" so you should have the patched kernel ?!
What is your kernel (FreeBSD) version ?Right know, using 22.05 on a SG 4100 :

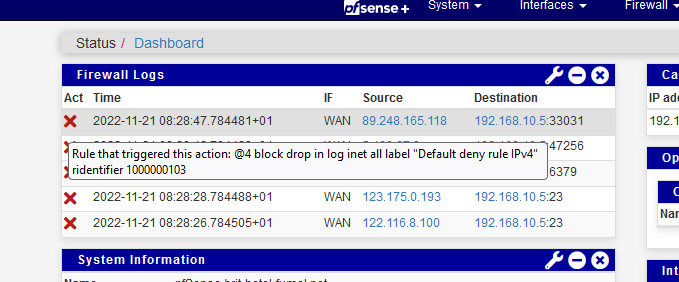
I hovered the mouse over the red cross, and a popup with - valid I guess - info popped up.
Rule 1000000103 is one of the 4 default BLOCK rules.Or it's something else : the logged line changed format a bot, and grepping into it fails.
If you could log this line (/etc/inc/syslog.inc - in function find_rule_by_number($rulenum, $trackernum, $type="block") ) :
$_gb = exec("/sbin/pfctl -vvPsr | /usr/bin/egrep " . escapeshellarg($lookup_pattern), $buffer);The timing,
The parameters, as feeding a grep with 'wrong' parameters would explain a lot!For example :
Executing/sbin/pfctl -vvPsron my 22.05 this command list all my firewall rules. Didn't saw any delays.
Knowing that that "1000000103" is the ID of one of my rules, I can also run :
/sbin/pfctl -vvPsr | /usr/bin/egrep '1000000103'
Like :
[22.05-RELEASE][admin@pfSense.mylocalstuff.net]/etc/inc: /sbin/pfctl -vvPsr | /usr/bin/egrep '1000000103' @4 block drop in log inet all label "Default deny rule IPv4" ridentifier 1000000103 -
I noticed that my version of the widget, is not 100% (in relation to screen updates), I will look after that probably later today.
