pfSense and IPSEC lan to lan: a big doubt about the correct implementation
-
@stephenw10 said in pfSense and IPSEC lan to lan: a big doubt about the correct implementation:
Ok, that looks good.
Earlier though you said those pings did not appear in a pcap in pfSense on the Access interface. Is that still the case?it is no longer happening.
With that rule if they are arriving it should definitely create at least a state on the Access interface. And since the P2 matches it it should go out over the tunnel creating a state on IPSec too.
I just repeated the test pinging 192.168.118.1 from PC with IP 192.168.120.10.
Ping is not working and the states for ACCESS interface are 0.
Attaching the virtual Wireshark to the em0 port of RouterA I see these lines :
168 2022-12-01 11:35:34.467546 192.168.120.10 192.168.118.1 ICMP 146 Echo (ping) request id=0x004b, seq=956/48131, ttl=63 (no response found!)
169 2022-12-01 11:35:34.468024 192.168.122.230 192.168.122.180 ICMP 174 Destination unreachable (Protocol unreachable) -
Ok, the states exist though and on both ACESS and IPSec. You can see both show 193 packets outbound and no replies.
So check the packet counters in the IPSec status again.
I would not expect to be able to see that traffic on the WAN dircetly, it should be encrypted.
However that 193 packet AH state on WAN looks suspicious. Do you have the Phase 2 protocol set to AH instead of ESP at one end?
It should always be ESP there, AH is unencrypted. -
@stephenw10 said in pfSense and IPSEC lan to lan: a big doubt about the correct implementation:
Ok, the states exist though and on both ACESS and IPSec. You can see both show 193 packets outbound and no replies.
So check the packet counters in the IPSec status again.
I would not expect to be able to see that traffic on the WAN dircetly, it should be encrypted.Yes, you are right.
However that 193 packet AH state on WAN looks suspicious. Do you have the Phase 2 protocol set to AH instead of ESP at one end?
It should always be ESP there, AH is unencrypted.P2 protocol was the same on both endpoints (it was AH, you are right).
Anyway, everything works as expected now. It was a Nat problem on the RouterA.
Many thanks for your help. You are a genius :)As soon as possible I will share what was happening. right now I'm travelling
-
Hello Steve, @stephenw10
a last question for you about this case.
I was able to deploy the IPSEC Lan to Lan successfully (thanks to you).
Now it works using the transport network as you suggested. It is almost done.Anyway, the throughput is a little bit slow (280Mbits/s but 1Gb/s link is available). I noticed that, during the previous tests between two PFsense 2.6CE instances, the throughput was about 900 Mbits/s. The test instances had each one a public IP.
Now, as in the previous test, AES-NI is enabled on both the endpoints, but the pfsense CE versions are different (2.6 and 2.5.2).
Do you think that this could be the reason of the poor performance?In one of my previous post, a user said:
" If AES_NI is in the game pfSense since 2.6 CE or Plus version will benefit from that"
Thanks
-
It's probably just a factor of the latency between the sites. I imagine it's significantly higher than in your test setup?
How are you testing the throughput?
Steve
-
Good Morning Steve,
here some additional info about the test and real scenario.
TEST environment details:
- n. 2 virtual machines with pfSense 2.6 CE with public IPs on WAN interfaces (let's say, 1.1.1.1/25 and 2.2.2.2/25);
- both the virtual machines have been deployed on two VMware ESXi 6.7 U3 hypervisors (one per site);
- the test has been made in order to test IPSEC feature and connectivity
- both the hypervisors have AES-NI enabled on bios
- both the virtual machines have the NetGate suggested configuration (AES-GCM, and so on).
- the throughput has been checked using iperf2 (iperf2 client running in the LAN at site A, iperf2 server running in the LAN at site B)
- the throughput is very near the 1Gb/s link capacity.
REAL/PRODUCTION environment:
- n. 2 virtual machines, one with pfSense 2.6 CE and the other with 2.5.2 CE;
- only one pfsense (at site B) has a public IPs on WAN interface (let's say, 2.2.2.3/25). The other one is behind the router (please, refer to the schema above).
- both the virtual machines have been deployed on two VMware ESXi 6.7 U3 hypervisors (one per site) - the same hypervisors mentioned above;
- both the hypervisors have AES-NI enabled on bios
- both the virtual machines have the NetGate suggested configuration (AES-GCM, and so on).
- the throughput has been checked using iperf2 (iperf2 client running in the LAN at site A, iperf2 server running in the LAN at site B)
- the throughput is about 280Mbits/s.
- please, note that the iperf test between the router WAN interface (1.1.1.2/25) at site A and the pfsense Wan interface (2.2.2.3/25) at site B returns 890 Mbits/s.
Do you think that the router at site A is doing something bad? Or it is really due to the different versions of pfSense?
Thank you,
Mauro -
Are those two environments actually between the same sites?
What is the latency across the tunnel in each case? Or just between the WANs outside the tunnel?
What were the iperf test conditions? Single TCP stream?
If you can pass close to 900Mbps outside the tunnel I would expect to see better inside it. That test does not include pfSense at all though at site A? The router at site A could be restricting something.
Is there any reason one of those VMs is still running 2.5.2?
Steve
-
@stephenw10 said in pfSense and IPSEC lan to lan: a big doubt about the correct implementation:
Are those two environments actually between the same sites?
Yes, the two environments are between the same sites (site A and site B) and I'm using the same hypervisors on each site.
What is the latency across the tunnel in each case? Or just between the WANs outside the tunnel?
I made a ping between one host in the LAN at site A (192.168.118.13/24) and one host in the LAN at site B (192.168.120.114/24) and viceversa.
ping from 192.168.118.13 and 192.168.120.114
PING 192.168.120.114 (192.168.120.114) 56(84) bytes of data.
64 bytes from 192.168.120.114: icmp_seq=1 ttl=61 time=1.93 ms
64 bytes from 192.168.120.114: icmp_seq=2 ttl=61 time=1.57 ms
64 bytes from 192.168.120.114: icmp_seq=3 ttl=61 time=1.67 msping from 192.168.120.114 and 192.168.118.13
PING 192.168.118.13 (192.168.118.13) 56(84) bytes of data.
64 bytes from 192.168.118.13: icmp_seq=1 ttl=61 time=1.46 ms
64 bytes from 192.168.118.13: icmp_seq=2 ttl=61 time=1.86 ms
64 bytes from 192.168.118.13: icmp_seq=3 ttl=61 time=1.59 msOr just between the WANs outside the tunnel?
This is the ping output between the WAN interface of the router at site A and the WAN interface of pFSense at site B:
ping x.x.177.2
PING x.x.177.2 (x.x.177.2) 56(84) bytes of data.
64 bytes from x.x.177.2: icmp_seq=1 ttl=57 time=1.06 ms
64 bytes from x.x.177.2: icmp_seq=2 ttl=57 time=1.13 ms
64 bytes from x.x.177.2: icmp_seq=3 ttl=57 time=1.18 ms
64 bytes from x.x.177.2: icmp_seq=4 ttl=57 time=1.25 ms
64 bytes from x.x.177.2: icmp_seq=5 ttl=57 time=0.947 msThis is the ping output between the WAN interface of the pfsense behind the router at site A and the WAN interface of pFSense at site B:
[2.6.0-RELEASE][admin@L2L01.home.arpa]/root: ping x.x.177.2
PING x.x.177.2 (x.x.177.2): 56 data bytes
64 bytes from x.x.177.2: icmp_seq=0 ttl=56 time=1.381 ms
64 bytes from x.x.177.2: icmp_seq=1 ttl=56 time=1.488 ms
64 bytes from x.x.177.2: icmp_seq=2 ttl=56 time=1.465 ms
64 bytes from x.x.177.2: icmp_seq=3 ttl=56 time=1.222 ms
64 bytes from x.x.177.2: icmp_seq=4 ttl=56 time=1.143 msWhat were the iperf test conditions? Single TCP stream?
I made an iperf test (between the same hosts mentioned above) using single TCP stream and multiple TCP stream.
This is the result with a single TCP stream:
iperf2 -c 192.168.120.114
Client connecting to 192.168.120.114, TCP port 5001
TCP window size: 85.3 KByte (default)[ 3] local 192.168.118.13 port 42192 connected with 192.168.120.114 port 5001
[ ID] Interval Transfer Bandwidth
[ 3] 0.0-10.0 sec 286 MBytes 240 Mbits/secAnd these are the results with 4, 8 and 16 parallel processes:
iperf2 -c 192.168.120.114 -P 4
Client connecting to 192.168.120.114, TCP port 5001
TCP window size: 390 KByte (default)[ 5] local 192.168.118.13 port 43148 connected with 192.168.120.114 port 5001
[ 3] local 192.168.118.13 port 43146 connected with 192.168.120.114 port 5001
[ 4] local 192.168.118.13 port 43150 connected with 192.168.120.114 port 5001
[ 6] local 192.168.118.13 port 43152 connected with 192.168.120.114 port 5001
[ ID] Interval Transfer Bandwidth
[ 4] 0.0-10.0 sec 153 MBytes 128 Mbits/sec
[ 5] 0.0-10.0 sec 152 MBytes 127 Mbits/sec
[ 3] 0.0-10.0 sec 154 MBytes 129 Mbits/sec
[ 6] 0.0-10.0 sec 152 MBytes 128 Mbits/sec
[SUM] 0.0-10.0 sec 611 MBytes 512 Mbits/seciperf2 -c 192.168.120.114 -P 8
Client connecting to 192.168.120.114, TCP port 5001
TCP window size: 390 KByte (default)[ 8] local 192.168.118.13 port 43168 connected with 192.168.120.114 port 5001
[ 6] local 192.168.118.13 port 43166 connected with 192.168.120.114 port 5001
[ 7] local 192.168.118.13 port 43164 connected with 192.168.120.114 port 5001
[ 3] local 192.168.118.13 port 43160 connected with 192.168.120.114 port 5001
[ 5] local 192.168.118.13 port 43162 connected with 192.168.120.114 port 5001
[ 9] local 192.168.118.13 port 43172 connected with 192.168.120.114 port 5001
[ 10] local 192.168.118.13 port 43170 connected with 192.168.120.114 port 5001
[ 4] local 192.168.118.13 port 43158 connected with 192.168.120.114 port 5001
[ ID] Interval Transfer Bandwidth
[ 9] 0.0-10.0 sec 61.1 MBytes 51.3 Mbits/sec
[ 4] 0.0-10.0 sec 61.1 MBytes 51.3 Mbits/sec
[ 6] 0.0-10.0 sec 59.0 MBytes 49.4 Mbits/sec
[ 7] 0.0-10.0 sec 61.0 MBytes 51.1 Mbits/sec
[ 3] 0.0-10.0 sec 61.0 MBytes 51.1 Mbits/sec
[ 5] 0.0-10.0 sec 61.0 MBytes 51.1 Mbits/sec
[ 8] 0.0-10.0 sec 61.0 MBytes 51.1 Mbits/sec
[ 10] 0.0-10.0 sec 60.9 MBytes 51.0 Mbits/sec
[SUM] 0.0-10.0 sec 486 MBytes 407 Mbits/seciperf2 -c 192.168.120.114 -P 16
Client connecting to 192.168.120.114, TCP port 5001
TCP window size: 390 KByte (default)[ 18] local 192.168.118.13 port 43204 connected with 192.168.120.114 port 5001
[ 6] local 192.168.118.13 port 43178 connected with 192.168.120.114 port 5001
[ 4] local 192.168.118.13 port 43174 connected with 192.168.120.114 port 5001
[ 7] local 192.168.118.13 port 43182 connected with 192.168.120.114 port 5001
[ 9] local 192.168.118.13 port 43184 connected with 192.168.120.114 port 5001
[ 3] local 192.168.118.13 port 43180 connected with 192.168.120.114 port 5001
[ 5] local 192.168.118.13 port 43176 connected with 192.168.120.114 port 5001
[ 8] local 192.168.118.13 port 43186 connected with 192.168.120.114 port 5001
[ 10] local 192.168.118.13 port 43188 connected with 192.168.120.114 port 5001
[ 14] local 192.168.118.13 port 43196 connected with 192.168.120.114 port 5001
[ 12] local 192.168.118.13 port 43192 connected with 192.168.120.114 port 5001
[ 15] local 192.168.118.13 port 43198 connected with 192.168.120.114 port 5001
[ 13] local 192.168.118.13 port 43194 connected with 192.168.120.114 port 5001
[ 16] local 192.168.118.13 port 43200 connected with 192.168.120.114 port 5001
[ 11] local 192.168.118.13 port 43190 connected with 192.168.120.114 port 5001
[ 17] local 192.168.118.13 port 43202 connected with 192.168.120.114 port 5001
[ ID] Interval Transfer Bandwidth
[ 7] 0.0-10.0 sec 41.0 MBytes 34.4 Mbits/sec
[ 5] 0.0-10.0 sec 41.0 MBytes 34.4 Mbits/sec
[ 14] 0.0-10.0 sec 41.1 MBytes 34.5 Mbits/sec
[ 12] 0.0-10.0 sec 41.1 MBytes 34.5 Mbits/sec
[ 15] 0.0-10.0 sec 41.1 MBytes 34.5 Mbits/sec
[ 4] 0.0-10.0 sec 41.1 MBytes 34.5 Mbits/sec
[ 3] 0.0-10.0 sec 41.2 MBytes 34.5 Mbits/sec
[ 8] 0.0-10.0 sec 41.1 MBytes 34.4 Mbits/sec
[ 13] 0.0-10.0 sec 41.1 MBytes 34.4 Mbits/sec
[ 17] 0.0-10.0 sec 41.1 MBytes 34.4 Mbits/sec
[ 6] 0.0-10.0 sec 41.2 MBytes 34.5 Mbits/sec
[ 9] 0.0-10.0 sec 41.1 MBytes 34.4 Mbits/sec
[ 10] 0.0-10.0 sec 41.2 MBytes 34.5 Mbits/sec
[ 11] 0.0-10.0 sec 41.2 MBytes 34.5 Mbits/sec
[ 18] 0.0-10.0 sec 41.2 MBytes 34.5 Mbits/sec
[ 16] 0.0-10.0 sec 41.2 MBytes 34.5 Mbits/sec
[SUM] 0.0-10.0 sec 658 MBytes 550 Mbits/secPlease, note that the results are not the always the same. Sometimes, It seems to be unstable. The basic value is always about 240/280 Mbits/s.
Sometimes, "write failed: Connection reset by peer" message appears in the iperf2 output when I use parallel streams.
The error message doesn't aappear if I use a single stream, but the bitrate is very low.iperf2 -c 192.168.120.114 -P 16
Client connecting to 192.168.120.114, TCP port 5001
TCP window size: 390 KByte (default)[ 16] local 192.168.118.13 port 43260 connected with 192.168.120.114 port 5001
[ 3] local 192.168.118.13 port 43238 connected with 192.168.120.114 port 5001
[ 8] local 192.168.118.13 port 43242 connected with 192.168.120.114 port 5001
[ 4] local 192.168.118.13 port 43234 connected with 192.168.120.114 port 5001
[ 5] local 192.168.118.13 port 43236 connected with 192.168.120.114 port 5001
[ 9] local 192.168.118.13 port 43246 connected with 192.168.120.114 port 5001
[ 7] local 192.168.118.13 port 43240 connected with 192.168.120.114 port 5001
[ 6] local 192.168.118.13 port 43244 connected with 192.168.120.114 port 5001
[ 11] local 192.168.118.13 port 43250 connected with 192.168.120.114 port 5001
[ 13] local 192.168.118.13 port 43254 connected with 192.168.120.114 port 5001
[ 14] local 192.168.118.13 port 43258 connected with 192.168.120.114 port 5001
[ 15] local 192.168.118.13 port 43256 connected with 192.168.120.114 port 5001
[ 12] local 192.168.118.13 port 43252 connected with 192.168.120.114 port 5001
[ 10] local 192.168.118.13 port 43248 connected with 192.168.120.114 port 5001
[ 18] local 192.168.118.13 port 43264 connected with 192.168.120.114 port 5001
[ 17] local 192.168.118.13 port 43262 connected with 192.168.120.114 port 5001
write failed: Connection reset by peer
write failed: Connection reset by peer
[ ID] Interval Transfer Bandwidth
[ 18] 0.0- 0.0 sec 358 KBytes 229 Mbits/sec
[ 17] 0.0- 0.0 sec 358 KBytes 220 Mbits/sec
[ 16] 0.0-10.7 sec 3.62 MBytes 2.84 Mbits/sec
[ 3] 0.0-10.7 sec 3.64 MBytes 2.86 Mbits/sec
[ 4] 0.0-10.7 sec 3.62 MBytes 2.84 Mbits/sec
[ 5] 0.0-10.7 sec 3.44 MBytes 2.70 Mbits/sec
[ 9] 0.0-10.7 sec 3.62 MBytes 2.84 Mbits/sec
[ 7] 0.0-10.7 sec 3.41 MBytes 2.67 Mbits/sec
[ 6] 0.0-10.7 sec 3.59 MBytes 2.82 Mbits/sec
[ 11] 0.0-10.7 sec 3.62 MBytes 2.83 Mbits/sec
[ 13] 0.0-10.7 sec 3.64 MBytes 2.86 Mbits/sec
[ 14] 0.0-10.7 sec 2.52 MBytes 1.97 Mbits/sec
[ 15] 0.0-10.7 sec 3.62 MBytes 2.84 Mbits/sec
[ 10] 0.0-10.7 sec 3.41 MBytes 2.68 Mbits/sec
[ 8] 0.0-10.7 sec 3.62 MBytes 2.83 Mbits/sec
[ 12] 0.0-10.8 sec 3.46 MBytes 2.69 Mbits/sec
[SUM] 0.0-10.8 sec 49.5 MBytes 38.5 Mbits/secI also tried to change the net.core.somaxconn in sysctl.conf on both the endpoints (as suggested in the link below), but the behaviour didn't change.
https://spyff.github.io/net/2019/07/14/many-tcp-flow-with-iperf/#the-problem-of-small-backlog
If you can pass close to 900Mbps outside the tunnel I would expect to see better inside it.
Yes, it is exactly what I would expect.
That test does not include pfSense at all though at site A?
Yes, some test I made include pfsense at site A (iperf test through the tunnel)
The router at site A could be restricting something.
I hope that the router is not the cause...I'm your hands :)
Is there any reason one of those VMs is still running 2.5.2?
No, it has been created some months ago and it is in production. If you think that it should updated, we will schedule a downtime to do it.
Steve
-
You probably need to do a test between the pfSense instances but outside the tunnel. Doing that would prove you are not being throttled by Router A for some reason. You can run iperf dircetly on pfSense A to test that. The speed to/from iperf running in pfSense will always be lower that through it but it should easily pass >280Mbps across a 2ms link.
-
Thank you for your reply, Steve.
This is the result of the iperf3 test between the pfsense at site A (10.99.0.2) and the pfsense at site B (x.x.177.2/25). It is a test outside the tunnel as you suggested.
[2.6.0-RELEASE][admin@L2L01.home.arpa]/root: iperf3 -c x.x.177.2
Connecting to host x.x.177.2, port 5201
[ 5] local 10.99.0.2 port 24218 connected to 90.147.177.2 port 5201
[ ID] Interval Transfer Bitrate Retr Cwnd
[ 5] 0.00-1.00 sec 83.5 MBytes 701 Mbits/sec 77 283 KBytes
[ 5] 1.00-2.00 sec 104 MBytes 872 Mbits/sec 7 428 KBytes
[ 5] 2.00-3.00 sec 103 MBytes 867 Mbits/sec 4 488 KBytes
[ 5] 3.00-4.00 sec 101 MBytes 847 Mbits/sec 126 381 KBytes
[ 5] 4.00-5.00 sec 105 MBytes 883 Mbits/sec 0 673 KBytes
[ 5] 5.00-6.00 sec 103 MBytes 861 Mbits/sec 9 539 KBytes
[ 5] 6.00-7.00 sec 99.3 MBytes 833 Mbits/sec 12 535 KBytes
[ 5] 7.00-8.00 sec 99.0 MBytes 831 Mbits/sec 35 426 KBytes
[ 5] 8.00-9.00 sec 99.9 MBytes 838 Mbits/sec 0 689 KBytes
[ 5] 9.00-10.00 sec 98.3 MBytes 825 Mbits/sec 0 872 KBytes
[ ID] Interval Transfer Bitrate Retr
[ 5] 0.00-10.00 sec 996 MBytes 836 Mbits/sec 270 sender
[ 5] 0.00-10.01 sec 995 MBytes 834 Mbits/sec receiverIt seems to be a good result.
So, if I'm not wrong, the problem is not the router, right?Thank you,
Mauro -
Correct, certainly not by IP dircetly. Or on the interface pfSense A is using. It could still be throttling IPSec traffic specifically but that seems unlikely.
In which case it must be some difference between the IPSec setups.
One thing that is different is that because one side is behind NAT the tunnel will be coming up with NAT-T enabled. The UDP encapsulation reduces the MTU. So it's possible you're seeing some packet fragmentation issues that don't happen over the test tunnel.
Try running iperf with a smaller mss values set, the-Mflag.Otherwise I would upgrade the 2.5.2 end to 2.6 so you're matching the test tunnel.
Steve
-
Thanks, Steve. We already scheduled a downtime for tomorrow in order to update pfsense from 2.5.2 to 2.6.
Meanwhile, I would like to execute iperf using -M flag as you suggested.
Unfortunately, I'm not an expert of MTU/MSS and I'm still trying to understand the relation between them. I'm looking for some basic guide to be studied.Could you please say me the mss value I should assign to -M flag to do the test?
Thank you in advance,
Mauro -
I'm still reading something about MSS, but, anyway, I tried to execute the iperf as follows:
iperf2 -c 192.168.120.114 -M 1460
WARNING: attempt to set TCP maximum segment size to 1460, but got 536Client connecting to 192.168.120.114, TCP port 5001
TCP window size: 110 KByte (default)[ 3] local 192.168.118.13 port 55226 connected with 192.168.120.114 port 5001
[ ID] Interval Transfer Bandwidth
[ 3] 0.0-10.0 sec 247 MBytes 207 Mbits/secIs the warning saying that something is going wrong?
-
Hmm, that might imply you have a much smaller tunnel MTU for some reason.
Try running some ping tests with large packets and do-not-fragment set to determine the tunnel MTU.
Check the same over the test tunnel. -
@stephenw10 thanks again for your help.
This is the output of the ping test through the tunnel (host in LAN A <-> host in LAN B)
[/root]> ping 192.168.120.114 -c 10 -M do -s 9000
PING 192.168.120.114 (192.168.120.114) 9000(9028) bytes of data.
ping: local error: Message too long, mtu=9000
ping: local error: Message too long, mtu=9000
ping: local error: Message too long, mtu=9000
^C
--- 192.168.120.114 ping statistics ---
5 packets transmitted, 0 received, +5 errors, 100% packet loss, time 3999ms[/root]> ping 192.168.120.114 -c 10 -M do -s 8972
PING 192.168.120.114 (192.168.120.114) 8972(9000) bytes of data.
^C
--- 192.168.120.114 ping statistics ---
7 packets transmitted, 0 received, 100% packet loss, time 6000ms[/root]> ping 192.168.120.114 -c 10 -M do -s 1500
PING 192.168.120.114 (192.168.120.114) 1500(1528) bytes of data.
^C
--- 192.168.120.114 ping statistics ---
6 packets transmitted, 0 received, 100% packet loss, time 4999ms[/root]> ping 192.168.120.114 -c 10 -M do -s 1472
PING 192.168.120.114 (192.168.120.114) 1472(1500) bytes of data.
1480 bytes from 192.168.120.114: icmp_seq=1 ttl=61 time=2.34 ms
1480 bytes from 192.168.120.114: icmp_seq=2 ttl=61 time=2.24 ms
1480 bytes from 192.168.120.114: icmp_seq=3 ttl=61 time=2.54 ms
1480 bytes from 192.168.120.114: icmp_seq=4 ttl=61 time=2.56 ms
^C
--- 192.168.120.114 ping statistics ---
4 packets transmitted, 4 received, 0% packet loss, time 3004ms
rtt min/avg/max/mdev = 2.242/2.424/2.562/0.143 msPLEASE, NOTE THAT: during this test, for a few seconds, also the MTU 8972 has been accepted. It is very strange.
[/root]> ping 192.168.120.114 -c 10 -M do -s 8972
PING 192.168.120.114 (192.168.120.114) 8972(9000) bytes of data.
8980 bytes from 192.168.120.114: icmp_seq=1 ttl=61 time=3.22 ms
8980 bytes from 192.168.120.114: icmp_seq=2 ttl=61 time=2.93 ms
8980 bytes from 192.168.120.114: icmp_seq=3 ttl=61 time=2.59 ms
^C
--- 192.168.120.114 ping statistics ---
3 packets transmitted, 3 received, 0% packet loss, time 2002ms
rtt min/avg/max/mdev = 2.596/2.917/3.223/0.263 msBut, when I tried again after some seconds, ping with 8972 MTU returned no output
[/root]> ping 192.168.120.114 -c 10 -M do -s 8972
PING 192.168.120.114 (192.168.120.114) 8972(9000) bytes of data.
^C
--- 192.168.120.114 ping statistics ---
6 packets transmitted, 0 received, 100% packet loss, time 5002msUnfortunately, I can't do the test in the "test tunnel" because after I saw that IPSEC worked as expected I removed the virtual machines. I'm sorry for that.
I kept all test results of the iperf, but I haven't the results for the ping -M do -s MTUSIZE. -
Hmm, those ping times are close to double what they were. Are you sure it's not fragmenting there? What happens if you set a much smaller value like 100B?
-
@stephenw10 said in pfSense and IPSEC lan to lan: a big doubt about the correct implementation:
Hmm, those ping times are close to double what they were. Are you sure it's not fragmenting there?
I don't know how to check it, sorry :(
What happens if you set a much smaller value like 100B?
This is the output using 100B
ping 192.168.120.114 -c 10 -M do -s 100
PING 192.168.120.114 (192.168.120.114) 100(128) bytes of data.
108 bytes from 192.168.120.114: icmp_seq=1 ttl=61 time=1.63 ms
108 bytes from 192.168.120.114: icmp_seq=2 ttl=61 time=2.05 ms
108 bytes from 192.168.120.114: icmp_seq=3 ttl=61 time=1.82 ms
108 bytes from 192.168.120.114: icmp_seq=4 ttl=61 time=1.74 ms
108 bytes from 192.168.120.114: icmp_seq=5 ttl=61 time=1.71 ms
108 bytes from 192.168.120.114: icmp_seq=6 ttl=61 time=1.59 ms
108 bytes from 192.168.120.114: icmp_seq=7 ttl=61 time=2.06 ms
108 bytes from 192.168.120.114: icmp_seq=8 ttl=61 time=2.06 ms
108 bytes from 192.168.120.114: icmp_seq=9 ttl=61 time=1.98 ms
108 bytes from 192.168.120.114: icmp_seq=10 ttl=61 time=2.13 ms -
Hello Steve,
I have some important news ( I hope ).
Since I noticed that the host in the LAN at site B has a strange behaviour (the MTU value set on the involved interface revert automatically from 9000 to 1500), I decided to create a virtual machine and I assigned it the following IP address 192.168.120.254.So, without change anything else, I started an iperf2 test from the same host at site A to the VM at site B.
The first attempt was not so lucky, I obtained the same bitrate as before:
[/root]> iperf2 -c 192.168.120.254 (from 192.168.118.13)
Client connecting to 192.168.120.254, TCP port 5001
TCP window size: 325 KByte (default)[ 3] local 192.168.118.13 port 50580 connected with 192.168.120.254 port 5001
[ ID] Interval Transfer Bandwidth
[ 3] 0.0-10.0 sec 223 MBytes 187 Mbits/secBut, when I start incrementing the number of parallel process something magic happens:
[/root]> iperf2 -c 192.168.120.254 -P 16
Client connecting to 192.168.120.254, TCP port 5001
TCP window size: 325 KByte (default)[ 18] local 192.168.118.13 port 50952 connected with 192.168.120.254 port 5001
[ 4] local 192.168.118.13 port 50922 connected with 192.168.120.254 port 5001
[ 5] local 192.168.118.13 port 50924 connected with 192.168.120.254 port 5001
[ 6] local 192.168.118.13 port 50926 connected with 192.168.120.254 port 5001
[ 7] local 192.168.118.13 port 50928 connected with 192.168.120.254 port 5001
[ 3] local 192.168.118.13 port 50930 connected with 192.168.120.254 port 5001
[ 9] local 192.168.118.13 port 50934 connected with 192.168.120.254 port 5001
[ 8] local 192.168.118.13 port 50932 connected with 192.168.120.254 port 5001
[ 10] local 192.168.118.13 port 50936 connected with 192.168.120.254 port 5001
[ 12] local 192.168.118.13 port 50938 connected with 192.168.120.254 port 5001
[ 11] local 192.168.118.13 port 50940 connected with 192.168.120.254 port 5001
[ 13] local 192.168.118.13 port 50942 connected with 192.168.120.254 port 5001
[ 14] local 192.168.118.13 port 50944 connected with 192.168.120.254 port 5001
[ 15] local 192.168.118.13 port 50946 connected with 192.168.120.254 port 5001
[ 16] local 192.168.118.13 port 50948 connected with 192.168.120.254 port 5001
[ 17] local 192.168.118.13 port 50950 connected with 192.168.120.254 port 5001
[ ID] Interval Transfer Bandwidth
[ 18] 0.0-10.0 sec 52.9 MBytes 44.3 Mbits/sec
[ 5] 0.0-10.0 sec 57.4 MBytes 48.1 Mbits/sec
[ 10] 0.0-10.0 sec 55.5 MBytes 46.5 Mbits/sec
[ 12] 0.0-10.0 sec 55.8 MBytes 46.7 Mbits/sec
[ 13] 0.0-10.0 sec 57.5 MBytes 48.2 Mbits/sec
[ 15] 0.0-10.0 sec 56.2 MBytes 47.1 Mbits/sec
[ 16] 0.0-10.0 sec 53.8 MBytes 45.1 Mbits/sec
[ 17] 0.0-10.0 sec 60.8 MBytes 50.9 Mbits/sec
[ 4] 0.0-10.0 sec 54.0 MBytes 45.2 Mbits/sec
[ 6] 0.0-10.0 sec 62.2 MBytes 52.1 Mbits/sec
[ 7] 0.0-10.0 sec 58.8 MBytes 49.2 Mbits/sec
[ 3] 0.0-10.0 sec 59.1 MBytes 49.5 Mbits/sec
[ 9] 0.0-10.0 sec 48.8 MBytes 40.8 Mbits/sec
[ 8] 0.0-10.0 sec 52.6 MBytes 44.1 Mbits/sec
[ 11] 0.0-10.0 sec 55.9 MBytes 46.8 Mbits/sec
[ 14] 0.0-10.0 sec 55.5 MBytes 46.5 Mbits/sec
[SUM] 0.0-10.0 sec 897 MBytes 750 Mbits/secAnd this is the output of the ping with MTU 100 and MTU 8972:
[/root]> ping 192.168.120.254 -c 10 -M do -s 100
PING 192.168.120.254 (192.168.120.254) 100(128) bytes of data.
108 bytes from 192.168.120.254: icmp_seq=1 ttl=61 time=1.87 ms
108 bytes from 192.168.120.254: icmp_seq=2 ttl=61 time=1.72 ms
108 bytes from 192.168.120.254: icmp_seq=3 ttl=61 time=1.93 ms[/root]> ping 192.168.120.254 -c 10 -M do -s 8972
PING 192.168.120.254 (192.168.120.254) 8972(9000) bytes of data.
8980 bytes from 192.168.120.254: icmp_seq=1 ttl=61 time=3.09 ms
8980 bytes from 192.168.120.254: icmp_seq=2 ttl=61 time=2.99 ms
8980 bytes from 192.168.120.254: icmp_seq=3 ttl=61 time=3.00 ms
8980 bytes from 192.168.120.254: icmp_seq=4 ttl=61 time=2.81 msI would like to ask you two questions:
- why I need to increment the P value to reach the expected bitrate? Is there something that I can do to obtain a good bitrate with a single stream?
- both the LANs, at each site, are connected to the router (at site A) and to the pfsense (at site B) using a 25Gb/s link. Do you think that it can cause the fragmenting?
- How can I check if it is fragmenting?
I promise that when I will close this task I will not disturb you again :-)
-
I assume that the actual WAN interfaces here are not set to 9000 MTU?
If you are pinging with 9000B packets they must be fragmented.
In your test setup was anything set to 9000 or was it all at the default 1500?
-
@stephenw10 said in pfSense and IPSEC lan to lan: a big doubt about the correct implementation:
I assume that the actual WAN interfaces here are not set to 9000 MTU?
If you are pinging with 9000B packets they must be fragmented.
In your test setup was anything set to 9000 or was it all at the default 1500?@stephenw10 said in pfSense and IPSEC lan to lan: a big doubt about the correct implementation:
I assume that the actual WAN interfaces here are not set to 9000 MTU?
Yes, it is set to 1500 MTU
If you are pinging with 9000B packets they must be fragmented.
Ok, thanks
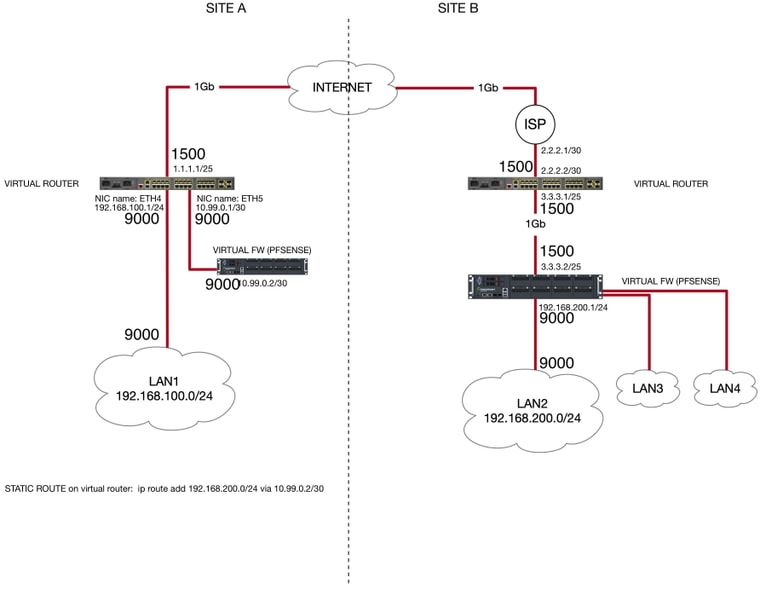
In your test setup was anything set to 9000 or was it all at the default 1500?
Yes, in my previous test setup LAN 1 at site A and LAN at site B were at 9000.
You can find below the schema with the MTU settings for each involved interface