23.1 using more RAM
-
@stephenw10 said in 23.1 using more RAM:
@defenderllc said in 23.1 using more RAM:
the memory will start in the mid-teens and slowly creep its way back up to nearly 40% with the exact same configuration on my 6100 MAX within about 18 hours.
Does it just keep climbing if you do not reboot?
Is it actually causing a problem or just seems unexpected?
Steve
Yes it does exactly that, but it is very slow increment. Once it gets close to 40%, it never seems to go down much. It might go down 1% or 2% here and there, but never returns to the original state of 18% to 20%. It’s worth noting it’s not causing any problems, but when the memory utilization doubles overnight, it just concerns me that there might be a memory leak. I’m going to let it run for a few days without rebooting it to see what it does.
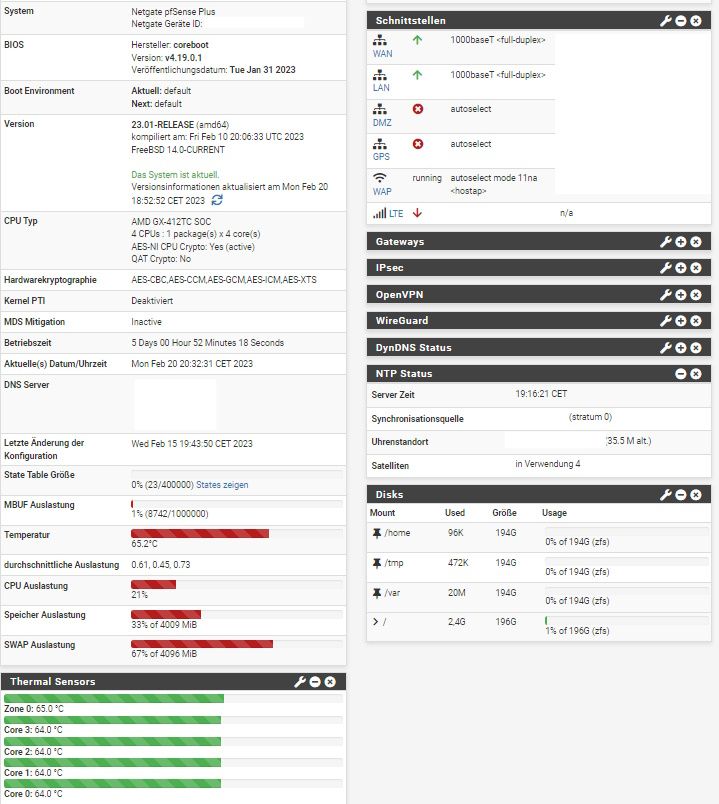
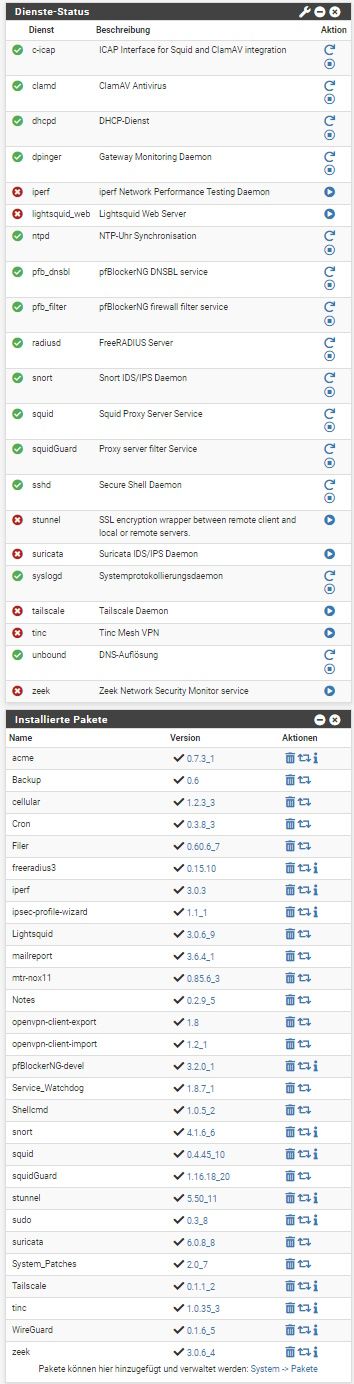
I’m using my 6100 strictly as a DMZ firewall only and for primary DNS with pfBlocker. I have a UDM behind it that manages the clients, but the 6100 is the network-wide primary DNS. I do have Suricata installed, but it’s not really doing anything at the moment. Unbound and ntop seem to always be using a lot of RAM since upgrading to 23.01.
-
Me too. For sure I use a slower hardware then you, but after upgrading and rebooting several times (setting backup playing in, ....) It went "normal" for my setup, but that said with a small higher CPU usage RAM usage and Swap usage too.
running on APU4D4
- with tuned CPU from 600MHz - 1000MHz to
1000MHz - 1400MHz
running as UTM - Snort, Squid, SquidGuard, ClamAV and pfBlocker-NG
After a while, it becomes more stable and using "less" ram, cpu and swap but more as before together with 22.05!
- with tuned CPU from 600MHz - 1000MHz to
-
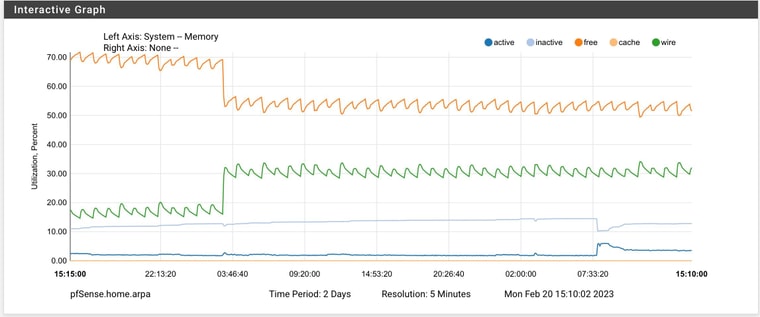
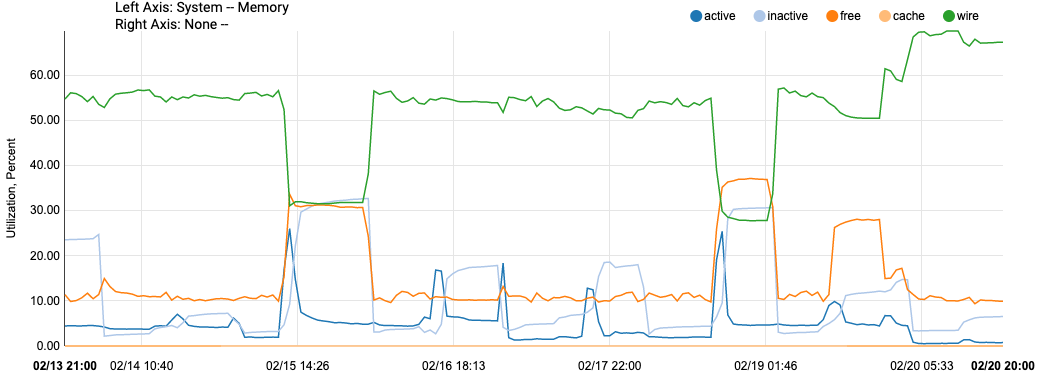
Looks like my spikes begin at 3AM and never return to normal. A few others shared this exact same issue (and at the exact same time). This is my memory utilization for the past 2 days and is the same each morning after a reboot the night before:
-
Check the cron table for what is triggered at that time?
I'd guess it's a pfBlocker or Snort update.
-
FWIW (I realise the memory change is only since you upgraded) I run telegraf & pfblocker (not Suricata), but my telegraf config differs from yours only by:
from_beginning = falseYou could try changing that as I haven't noticed any memory difference since upgrading.
Maybe telegraf is keeping more of that data in memory than it used to and not releasing it. -
@stephenw10 said in 23.1 using more RAM:
Check the cron table for what is triggered at that time?
I'd guess it's a pfBlocker or Snort update.
I don’t run snort and my pfBlocker lists update every hour. I’ll take a look. What’s the best way for me to figure out what’s running at 3AM without having to stay up to watch it? Thanks.
FYI, I rebooted at 4 PM today. I will share tomorrow morning’s graph where I expect the behavior will be exactly the same.
-
Check the cron table. You can install the cron package to do that easily.
Check the system logs at that time, what was logged?
Steve
-
@stephenw10 Now that I've looked I see it too, on a 2100. However it only happened once and not the second day.
- 3:00 am
- 5:15 am next day, pfBlocker update

No pfSense system log entries between 01:01 and 04:30.
# /etc/crontab - root's crontab for FreeBSD
#
# $FreeBSD$
#
SHELL=/bin/sh
PATH=/sbin:/bin:/usr/sbin:/usr/bin:/usr/local/sbin:/usr/local/bin
#
#minute	hour	mday	month	wday	who	command
#
# Save some entropy so that /dev/random can re-seed on boot.
*/11	*	*	*	*	operator /usr/libexec/save-entropy
#
# Rotate log files every hour, if necessary.
0	*	*	*	*	root	newsyslog
#
# Perform daily/weekly/monthly maintenance.
1	3	*	*	*	root	periodic daily
15	4	*	*	6	root	periodic weekly
30	5	1	*	*	root	periodic monthly
#
# Adjust the time zone if the CMOS clock keeps local time, as opposed to
# UTC time.  See adjkerntz(8) for details.
1,31	0-5	*	*	*	root	adjkerntz -a
#
# pfSense specific crontab entries
# Created: February 18, 2023, 8:19 pm
#

1,31	0-5	*	*	*	root	/usr/bin/nice -n20 adjkerntz -a
1	3	1	*	*	root	/usr/bin/nice -n20 /etc/rc.update_bogons.sh
1	1	*	*	*	root	/usr/bin/nice -n20 /etc/rc.dyndns.update
*/60	*	*	*	*	root	/usr/bin/nice -n20 /usr/local/sbin/expiretable -v -t 3600 virusprot
30	12	*	*	*	root	/usr/bin/nice -n20 /etc/rc.update_urltables
1	0	*	*	*	root	/usr/bin/nice -n20 /etc/rc.update_pkg_metadata
*/1	*	*	*	*	root	/usr/sbin/newsyslog
1	3	*	*	*	root	/etc/rc.periodic daily
15	4	*	*	6	root	/etc/rc.periodic weekly
30	5	1	*	*	root	/etc/rc.periodic monthly
0	*/4	*	*	*	root	/etc/rc.backup_rrd.sh
0	*/4	*	*	*	root	/etc/rc.backup_dhcpleases.sh
0	*/1	*	*	*	root	/etc/rc.backup_logs.sh
0	6	*	*	5	root	/usr/local/bin/php /usr/local/www/pfblockerng/pfblockerng.php dcc >> /var/log/pfblockerng/extras.log 2>&1
15	5	*	*	*	root	/usr/local/bin/php /usr/local/www/pfblockerng/pfblockerng.php cron >> /var/log/pfblockerng/pfblockerng.log 2>&1
#
# If possible do not add items to this file manually.
# If done so, this file must be terminated with a blank line (e.g. new line)
#
No particular memory hogs though?
Mem: 157M Active, 235M Inact, 1129M Wired, 1780M Free
ARC: 781M Total, 638M MFU, 71M MRU, 280K Anon, 9429K Header, 61M Other
     650M Compressed, 1401M Uncompressed, 2.16:1 Ratio

  PID USERNAME    PRI NICE   SIZE    RES STATE    C   TIME    WCPU COMMAND
16983 unbound      21    0   141M   120M kqread   1   0:11   2.04% /usr/local/sbin/unbound -c /var/unbound/unbound.conf
16983 unbound      20    0   141M   120M kqread   0   0:06   0.01% /usr/local/sbin/unbound -c /var/unbound/unbound.conf
26241 root         68    0   148M    52M accept   0   0:29   0.00% php-fpm: pool nginx (php-fpm){php-fpm}
  495 root         68    0   148M    52M accept   0   0:23   0.00% php-fpm: pool nginx (php-fpm){php-fpm}
15289 root         68    0   148M    52M accept   0   0:37   0.00% php-fpm: pool nginx (php-fpm){php-fpm}
  757 root         68    0   148M    51M accept   1   0:36   0.00% php-fpm: pool nginx (php-fpm){php-fpm}
  494 root         29    0   149M    51M accept   0   0:37   0.00% php-fpm: pool nginx (php-fpm){php-fpm}
90123 root         68    0   144M    51M accept   1   0:22   0.00% php-fpm: pool nginx (php-fpm)
  752 root         68    0   144M    51M accept   0   0:23   0.00% php-fpm: pool nginx (php-fpm)
  493 root         20    0   111M    29M kqread   0   0:08   0.00% php-fpm: master process (/usr/local/lib/php-fpm.conf
47310 dhcpd        20    0    24M    13M select   1   0:00   0.01% /usr/local/sbin/dhcpd -user dhcpd -group _dhcp -chro
49371 dhcpd        20    0    22M    10M select   0   0:00   0.01% /usr/local/sbin/dhcpd -6 -user dhcpd -group _dhcp -c
60576 root         20    0    30M    10M kqread   1   0:06   0.00% nginx: worker process (nginx)
66552 root         20    0    20M  9840K select   1   0:00   0.02% sshd: admin@pts/0 (sshd)
60427 root         20    0    30M  9768K kqread   0   0:00   0.00% nginx: worker process (nginx)
59743 root         20    0    20M  8796K kqread   0  13:58   0.00% /usr/local/sbin/lighttpd_pfb -f /var/unbound/pfb_dns
18148 root         21    0    20M  8404K select   1   0:00   0.00% sshd: /usr/sbin/sshd [listener] 0 of 10-100 startups
60229 root         48    0    28M  7808K pause    0   0:00   0.00% nginx: master process /usr/local/sbin/nginx -c /var/
59735 root         20    0    21M  7000K select   1   0:29   0.01% /usr/local/sbin/ntpd -g -c /var/etc/ntpd.conf -p /va
Edit: Would "/etc/rc.periodic daily" be doing something to trigger ZFS memory usage, that wouldn't release? (since the release notes say it won't after upgrading but that's normal and it will eventually release as needed)
Only install packages for your version, or risk breaking it. Select your branch in System/Update/Update Settings.
When upgrading, allow 10-15 minutes to reboot, or more depending on packages, CPU, and/or disk speed.
Upvote 👍 helpful posts! -
S SteveITS referenced this topic on
-
@jimp said in 23.1 using more RAM:
top -aS -o res
I have suricata, pfBlockerNG and uptime over 5 days
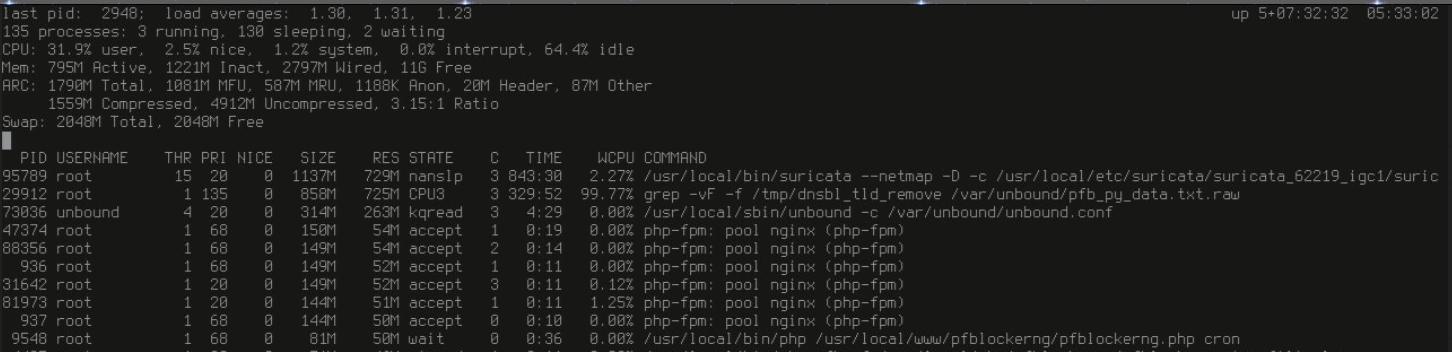
So far did not notice any side effect…
-
@steveits Same on my 1100. RAM increases btw 3-4 am. Wired memory jumps from 28-31% to 55-70%.
pfBlocker updates once a day at 2am and acme certificates runs at 3:16am every day. My cert is less than 60 days old so its not trying to renew and I don't see the PID still running. (doubt it would use that much RAM just checking the age of the cert)
Feb 20 03:16:00 ACME 55754 Renewal number of days not yet reached.
Feb 20 03:16:00 ACME 55754 Checking if renewal is needed for: ahking-Cert-Andrew
-
Just jumping in...
Update to 23.01 was done Thursday, 16th Feb. 2023, so its running only a short time.
Actually I do not see major issues, but curious about the memory threads I did a reboot yesterday and so it looks this morning: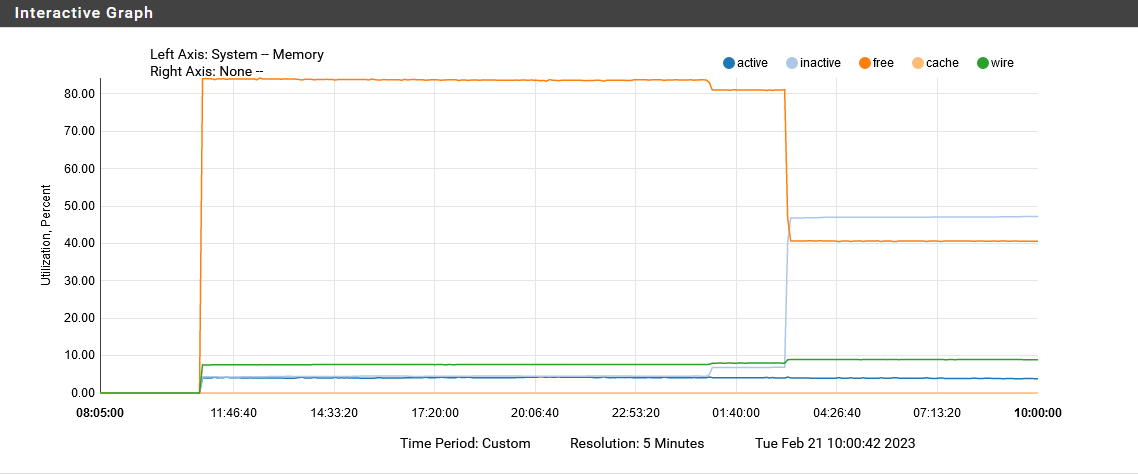
Investigating in cron the periodic_daily and pfBlockerNG running at 3.00am.
Appliance is a SG-3100 (no ZFS).
Will monitor this in the next days...Regards
-
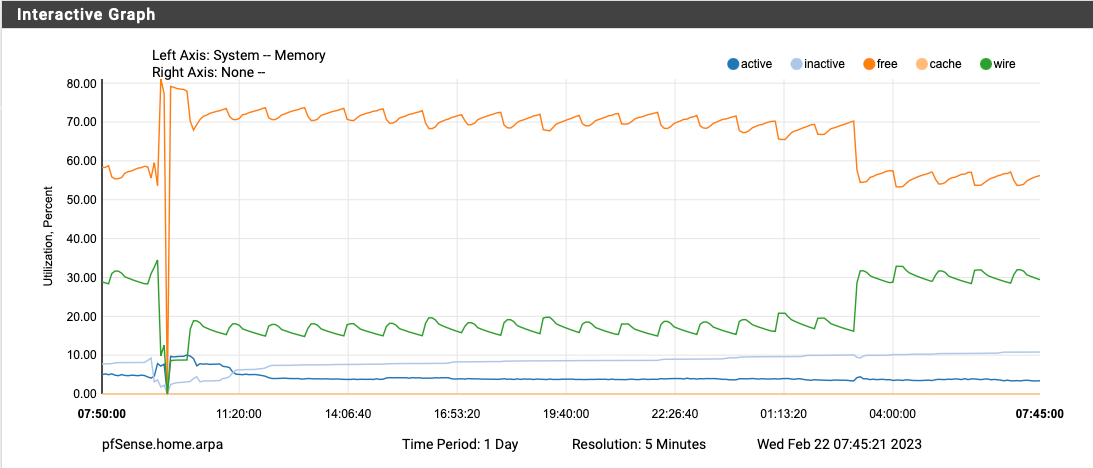
Rebooted at 4PM yesterday. Memory doubled at exactly 3AM. The only cron job running at 3PM is the periodic daily job. There is nothing in the system logs that jumps out at me either. Note that my pfBlocker lists update at the top of every hour, so this is the the same in the logs:
Feb 21 02:54:00 sshguard 64916 Exiting on signal.
Feb 21 02:54:00 sshguard 42003 Now monitoring attacks.
Feb 21 03:00:00 php 29385 [pfBlockerNG] Starting cron process.
Feb 21 03:00:02 php 29385 [pfBlockerNG] No changes to Firewall rules, skipping Filter Reload
Feb 21 03:22:00 sshguard 42003 Exiting on signal.
Feb 21 03:22:00 sshguard 73966 Now monitoring attacks.
Feb 21 03:50:00 sshguard 73966 Exiting on signal.
Feb 21 03:50:00 sshguard 54191 Now monitoring attacks.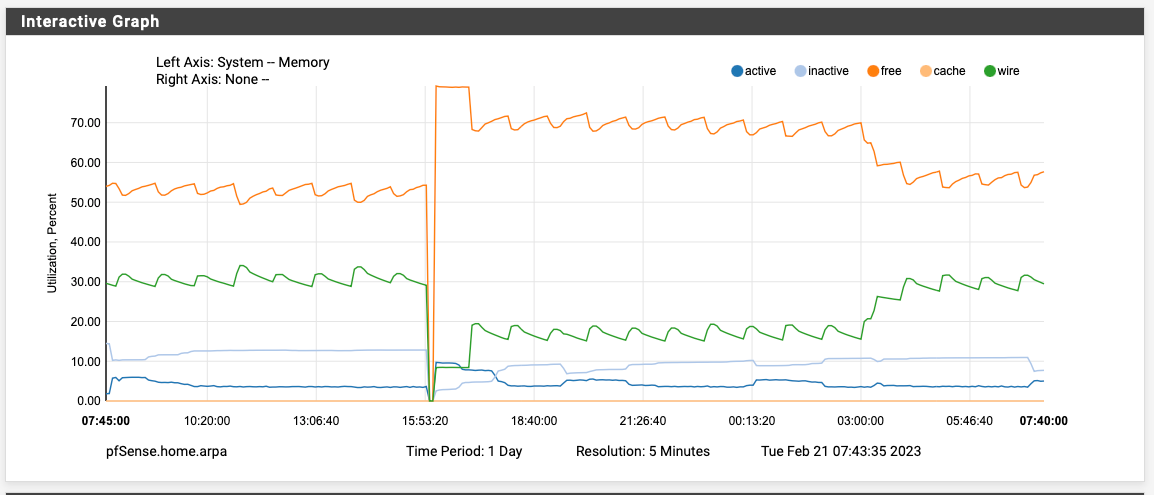
-
FYI, there's now package updates available for pfBlockerNG and Suricata. Perhaps this will help.
-
S SteveITS referenced this topic on
-
S SteveITS referenced this topic on
-
S SteveITS referenced this topic on
-
@defenderllc said in 23.1 using more RAM:
FYI, there's now package updates available for pfBlockerNG and Suricata. Perhaps this will help.
Installed both and rebooting... I will report back tomorrow morning so see if it resolved the 3AM spike.
-
At least this night no more memory usage:
So it seems to be a one-time-shot, as others are reporting.
Regards
-
F FSC830 referenced this topic on
-
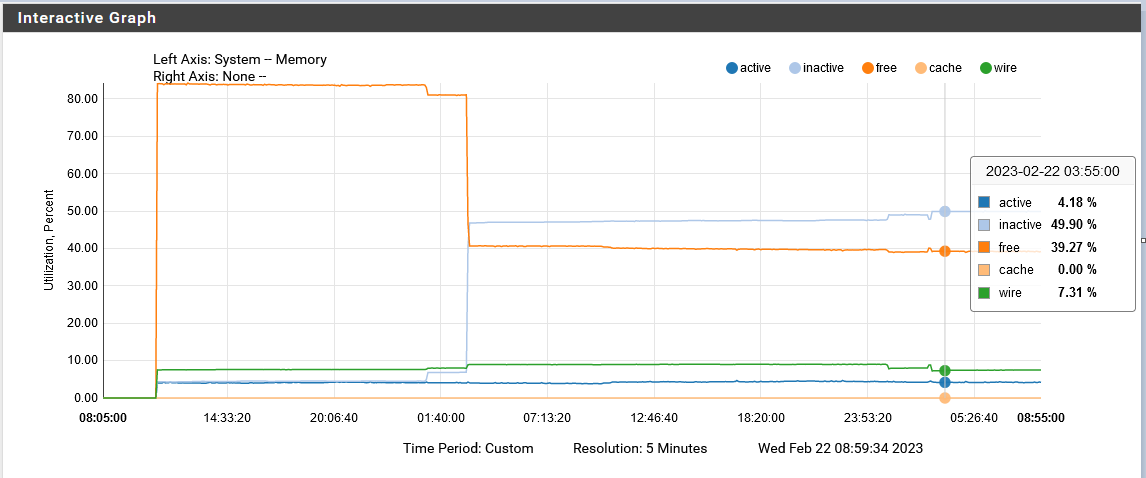
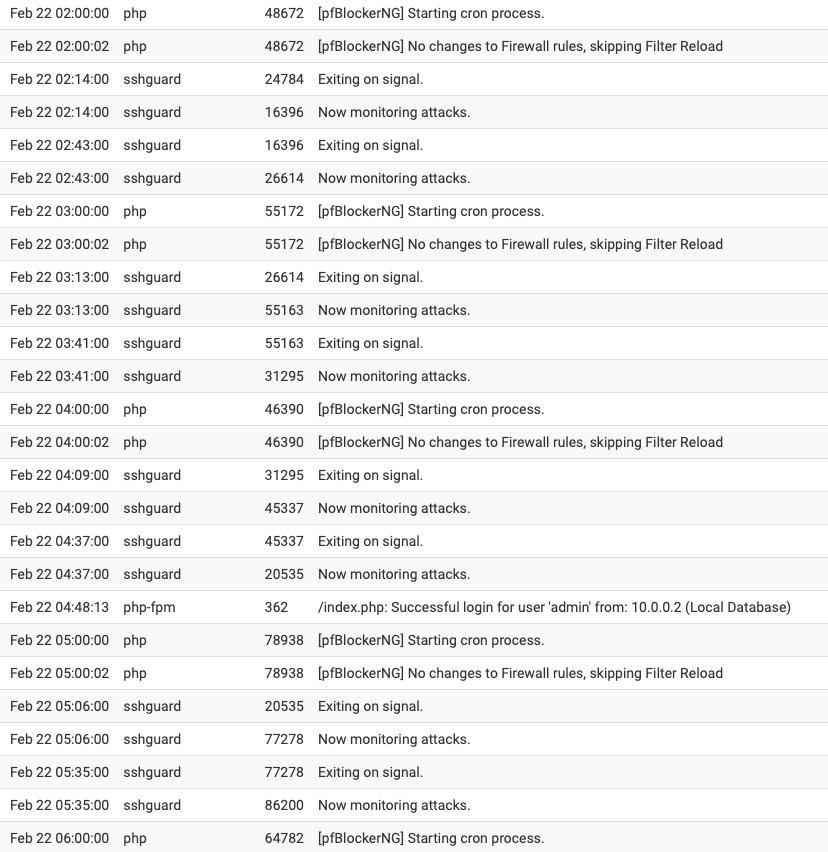
Upgraded to pfBlockerNG 3.2.0_2 yesterday, disabled Suricata completely, and rebooted around 9:30 AM yesterday morning. The memory utilization doubled again at exactly 3AM. The only cron job running at 3AM is the daily periodical and hourly pfBlocker updates (which there wasn't any lists to update today at 3AM).
I've also attached my system log from 2AM to 6AM and there is nothing worthwhile in there to explain what is happening at 3AM besides the daily periodical.
-
I'd have to look over the code but one thing it does during the daily periodic script is check if ZFS pools need to be scrubbed. I wouldn't expect that to trigger high memory usage in general, but it's possible. That wouldn't explain why some people see it and others don't, though.
Someone could reboot and then run periodic script by hand to see if doing so also triggers the increase in memory usage. Or even just try
zpool scrub pfSenseand check before/after that finishes. You can runzpool status pfSenseto check on the status of an active scrub operation.Remember: Upvote with the 👍 button for any user/post you find to be helpful, informative, or deserving of recognition!
Need help fast? Netgate Global Support!
Do not Chat/PM for help!
-
@jimp said in 23.1 using more RAM:
I'd have to look over the code but one thing it does during the daily periodic script is check if ZFS pools need to be scrubbed. I wouldn't expect that to trigger high memory usage in general, but it's possible. That wouldn't explain why some people see it and others don't, though.
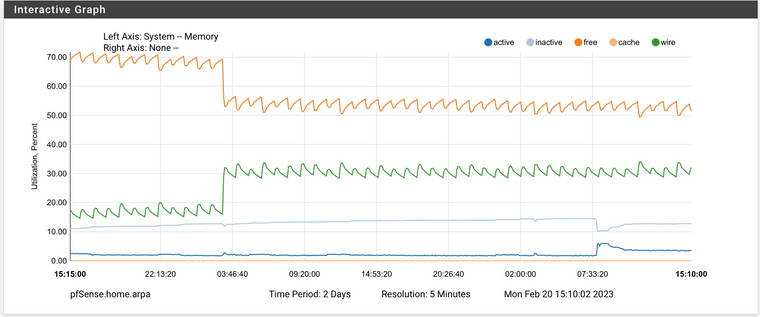
Someone could reboot and then run periodic script by hand to see if doing so also triggers the increase in memory usage. Or even just try
zpool scrub pfSenseand check before/after that finishes. You can runzpool status pfSenseto check on the status of an active scrub operation.Hi Jim, I will try that when I get some free time today. This is a daily occurrence on my 6100 MAX. Here's 2-day graph from a few days ago. The memory never gets returned after the spike occurs.
-
@jimp : Me too having that memory jump and do not use ZFS!??

Regards
-
If it's ZFS ARC usage that's what I'd expect to see. It won't give it up right away but if something else needs the RAM the kernel should reduce the cache as needed under memory pressure. That doesn't mean it would never swap, but it should mean it doesn't fill up swap.
You could also experiment with setting an upper bound on the ARC size (
vfs.zfs.arc_max=<bytes>as a tunable, doesn't need to be a loader tunable) for example, but the exact value for that depends a lot on your system (RAM size/Kernel memory, disk size, etc.). There are likely other ZFS parameters that could be tuned if that does turn out to be related.If you aren't using ZFS then we'll need to keep digging into what exactly is happening at that time that might also be contributing.