1100 upgrade, 22.05->23.01, high mem usage
-
@jrey So, its not acme, its not ZFS (because UFS system is also affected), its not pfblockerng/snort/suricata since I don't have those installed and I'm facing the same problem around the same time as you guys.
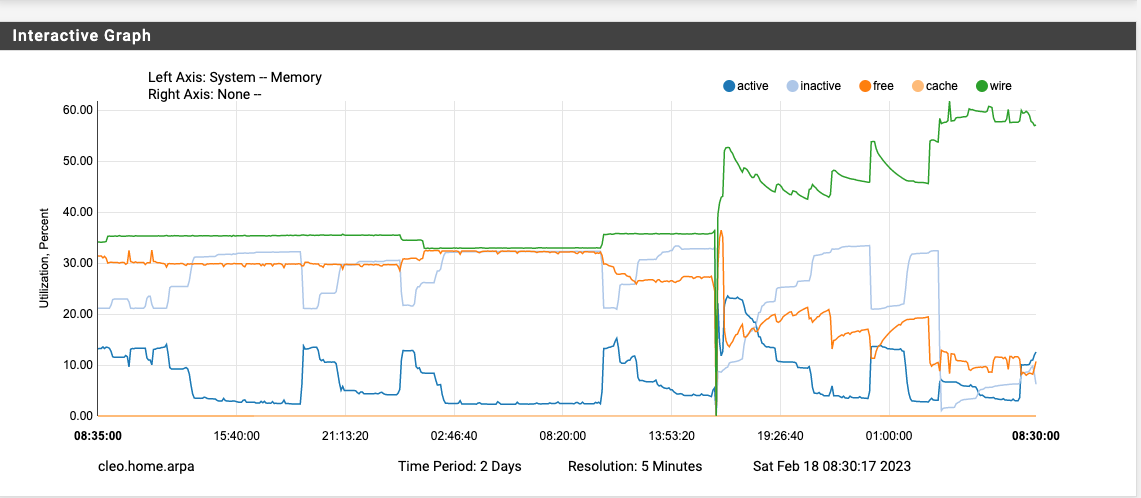
I'm not sure if this is related to logs since I'm not writing anything to the disk (remote syslog):
-
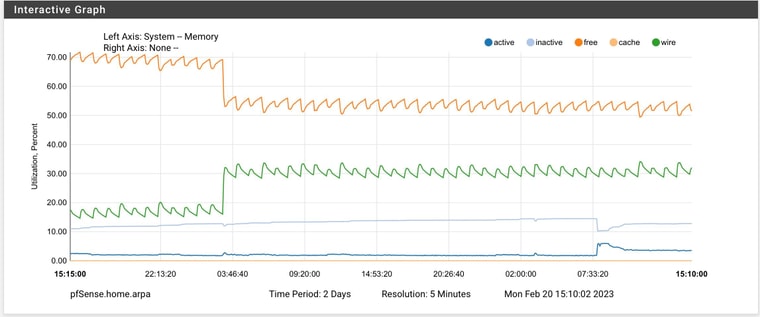
After leaving things alone for a couple of days, the mem usage jumps to about 63% at 3 AM and slowly drops over the next 24 hours to about 53%, then jumps back to 63%. So it is "stable" between these two numbers. I have had no ill effects of this new memory usage since going to 23.01.
Thinking that "unbound" might be holding more DNS cache info than it needs, and that it might be a DNS cache timeout issue, I looked around there in Services->DNS Resolver->Advanced. My "TTL for host cache entries" is 15 minutes, and the "Max TTL for RRsets" is one day. Hmmm. I wonder if I reduced the Max TTL if anything good or bad would happen. I nervous about futzing with anything here.
-
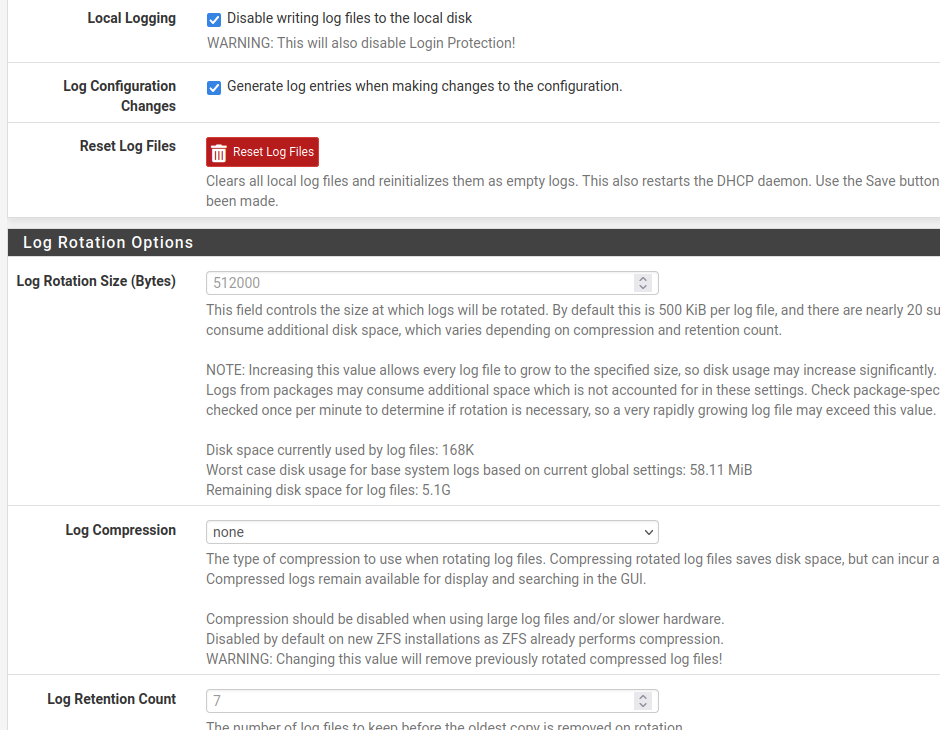
Only difference I have in those settings is the local logging is unchecked for me. Even though I also send to a syslog
Log rotation is generally such a trivial task, I can't see it running for the 10 minutes (in my case)
to me the periodic daily are more likely the cause of the slow, one time over the 10 minutes memory burn.
Now, if left alone at this point it won't change anymore. It will just stay at these new levels. (pretty flat line 1-2% bumps up/down here and there, but nothing near the level of the first 3am after a restart)
based on the before/after upgrade graph or even after a reboot
a) the system isn't very memory stressed (I only have about 45-50 devices behind it)
b) this has only started since the upgrade and is consistent at only happening the first 3am cycle after a restart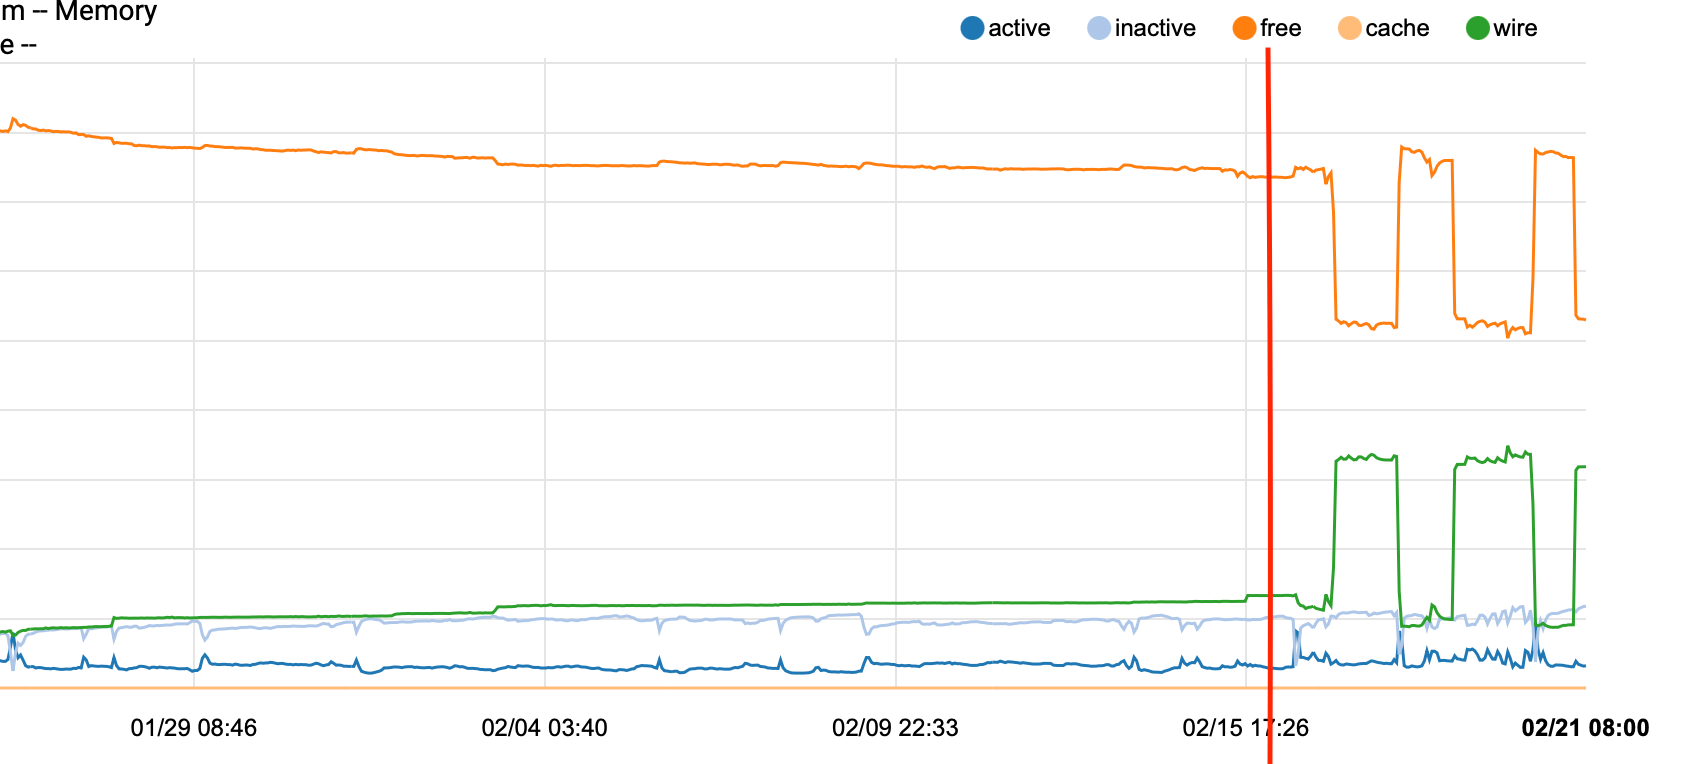
Red line left of is 22.05 to the right is 23.01
pretty obvious when this was introduced. -
I would think if this were DNS related, memory would fluctuate more often and be less flatline, as has been shown at least in my case where the change is only at first 3am after a reboot.
For the record I don't run DHCP on this NG, that is handled by one of the internal systems for all devices on the network. All devices on LAN point to it for DNS (primarily for pfBlockerNG) but the NG forwards all missing requests to 2 (AD paired DNS systems, both of which have the ability to reach "outside" if they don't have the answer. But neither of the 2 DNS servers accept queries coming in.I'm supporting about 45-50 systems behind the 2100. and typically the memory is 10-15% until at 3am it jumps to 37%-%40 typically after the restart yesterday it was at 12% this morning 39% and it will stay right about there until the next restart.
Not concerned, just more of an observation.
JR -
FYI, there's now package updates available for pfBlockerNG and Suricata. Perhaps this will help.
-
@beerguzzle I posted in similar thread https://forum.netgate.com/topic/177886/23-1-using-more-ram/41. Based on my second day it should not increase again, it's just the first day after reboot from what I see.
-
Unlikely, pfBlockerNG does nothing at 3am and I don't run Suricata. As others have also noted.
-
@jrey I totally agree, but this would also not be the first time that pfBlocker had a memory leak after an update and that package was definitely updated during the upgrade to 23.01. I'll know for sure tomorrow morning!
-
I just applied the pfblockerng update, going from 3.2.0.1 to 3.2.0.2. I did not reboot. The wired mem usage jumped from 55% to 63%.
-
question will be, after the new version settles in, does that new memory come down?
is it's not 3am where you are is it?
The specific (and only) increase I have ever seen, is always and only at 3am, like clockwork.
At that time it jumps up a good 20% and then stays there until the next system restart. Regardless of other activity on the system. Look at the graph I posted memory is a pretty flat line. If the memory usage were a heart rhythm I'd be worried it is so flat.Granted I also see some posts where others have memory usage with really wild fluctuations, they are usually running a lot more stuff on the box than I.
In my case I don't think it has anything to do with Acme, or pfBlockerNG for the reasons and timing of the events i've previously reported.
-
@keyser -- the main reason I went with netgate hardware was this firewall was going to be located 750 miles and 3 states away from me and I was led to believe netgate would be testing all new releases on their different hardware platforms prior to releasing new versions.
That clearly doesn't appear to be the case as my SG-1100 is a "Plain Jane" as you could possibly find and there is a major flaw in 23.01 on their hardware!
Roy...
-
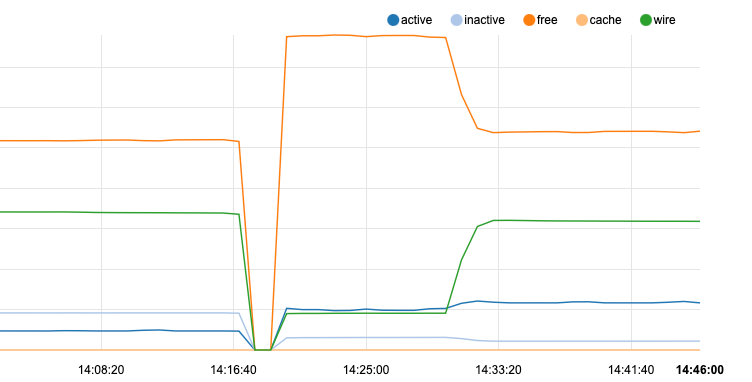
So here you go. in my case the issue is 100% cause by "periodic daily" that runs at 3:00am
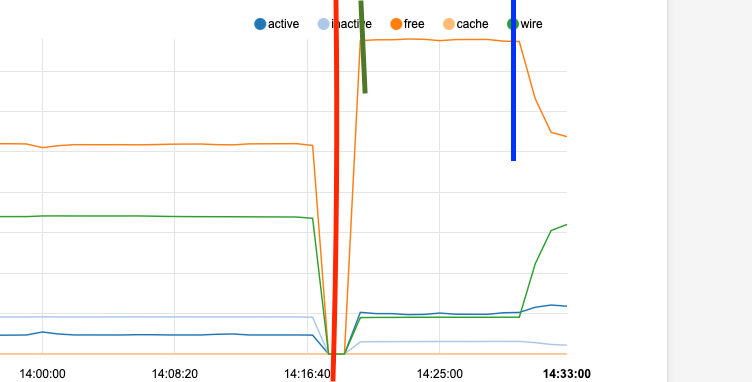
left of the red line is where it was after last night's spike, and represents the point at which I restarted the system now.
Green line mark is showing the re-establishing of what I would consider the "normal base line" after a reboot and before the next 3:00am cycle
Blue line is me "pretending" it is currently 3:00am and running "period daily" from an ssh session...there goes the memory.
periodic daily is the default "periodic" provided by freebsd (I don't see any comments with to say that pfsense has modified it)
the other /etc/rc.periodic that also normally runs at 3:00 seems to be the pfsense specific stuff. I didn't even run it in this tests be well the memory is already consumed !Sorry I may have captured and marked up the first screen capture too soon to show the flat line after periodic daily completed
-
@jrey Same here on my 6100. That's the only cron job that kicks off at 3AM besides the hourly pfBlocker updates.
-
@jrey Given that Cached memory goes "equally" down, could it be a performance optimization i FreeBSD 14 that evaluates the free memory available in the box and decides to increase wired memory use to increase performance instead of touching disk (and maybe/maybe not hitting cache memory) again and again?
-
Very possible in my case - because the system is very flat lined with regards to memory. I was just providing the information for those that have a more scattered memory with huge swings. This "feature" would mask what is going on for some of them, because they are potentially seeing this huge swing on top of their systems "normal" up and downs.
I've said all along that my system is not stressed with regards to memory in the current configuration and I'm not concerned. I should have also said "likely normal" (my bad)
Thanks, JR
-
@jrey said in 1100 upgrade, 22.05->23.01, high mem usage:
Very possible in my case - because the system is very flat lined with regards to memory. I was just providing the information for those that have a more scattered memory with huge swings. This "feature" would mask what is going on for some of them, because they are potentially seeing this huge swing on top of their systems "normal" up and downs.
I've said all along that my system is not stressed with regards to memory in the current configuration and I'm not concerned. I should have also said "likely normal" (my bad)
Thanks, JR
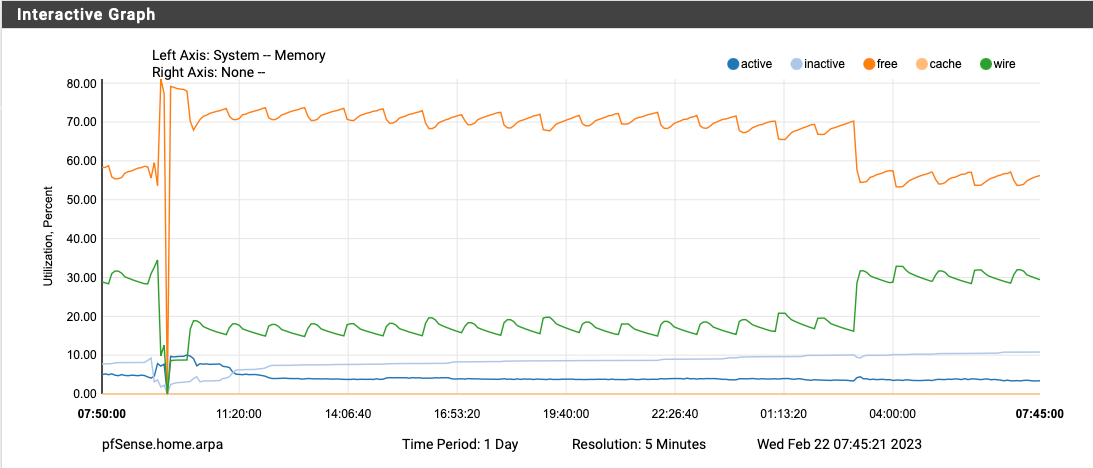
it's not your device. My 6100 MAX is doing the EXACT same thing at the EXACT same time since upgrading to 23.01. This is what I see after a clean reboot and at 3AM:
-
S SteveITS referenced this topic on
-
@keyser said in 1100 upgrade, 22.05->23.01, high mem usage:
Given that Cached memory goes "equally" down
check again, is not cached memory going down, it is the free memory that goes down by an "equal" amount - cache is actually zero in my case.
Still could be "optimization" as part of the "periodic daily", just not optimization of cache as suggested.
Thanks
Edit: I wonder if..
when I ran the periodic daily manually in my test it complained that mail was not available.
"By default, the output from running the periodic scripts is emailed to the root user on the local system"
this can't happen on the NetGate. So makes me think the memory might be the reports that it wants to mail, but can't. The reason it then never consumes more memory, is the reports themselves take the same "footprint" everyday.
There is a configuration setting in periodic's conf to tell the system not to mail these reports at all. Checking this now, if they are on, I'll turn them off and re-test or redirect them with conf option
email is likely a poor choice but they can go to a path as well
daily_output=”some_address@someplacevalid.com"
might be an option if this is in fact what is going on. -
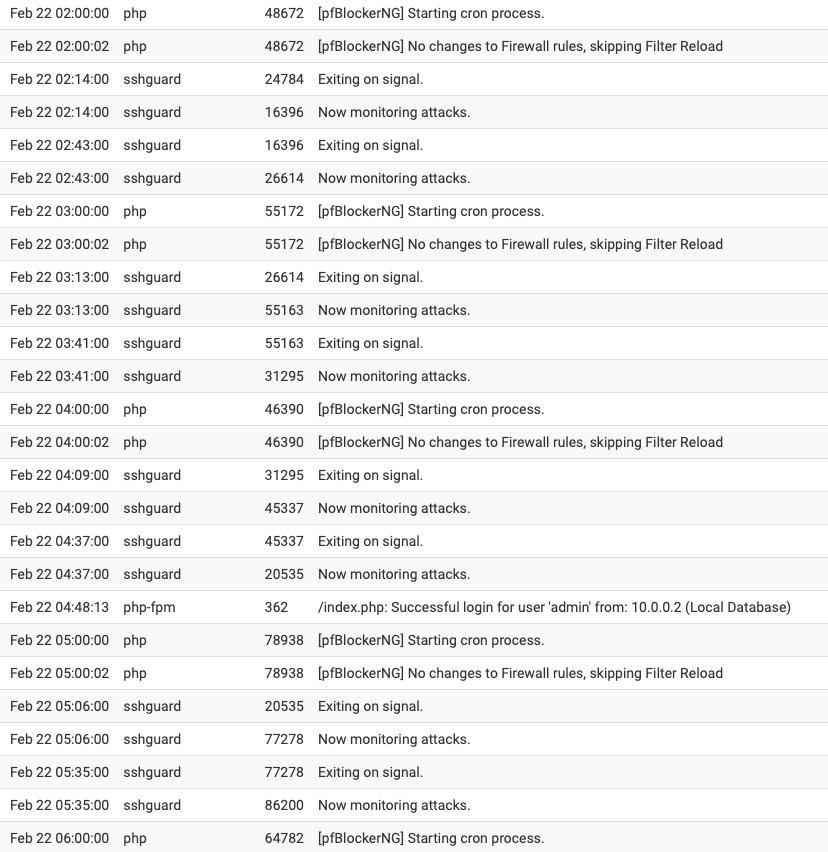
Upgraded to pfBlockerNG 3.2.0_2 yesterday, disabled Suricata completely, and rebooted around 9:30 AM yesterday morning. The memory utilization doubled again at exactly 3AM. The only cron job running at 3AM is the daily periodical and hourly pfBlocker updates (which there wasn't any lists to update today at 3AM).
I've also attached my system log from 2AM to 6AM and there is nothing worthwhile in there to explain what is happening at 3AM besides the daily periodical.
-
S SteveITS referenced this topic on
-
S SteveITS referenced this topic on
-
it is not pfB, my tasks for that don't run at 3am and another user on here doesn't even have it installed. So I think safe to rule that out.
I've been going back through "periodic daily" it is clearly something in there.
going on the theory that out of box is set to email the daily, weekly, monthly (and security) reports and but can't - this is the result of testing in that regard.I've done the following test since my previous post earlier today.
create a file /etc/periodic.conf.localin that file place these 6 lines
daily_output=/var/log/daily.log
daily_status_security_output=/var/log/daily_security.log
weekly_output=/var/log/weekly.log
weekly_status_security_output=/var/log/weekly_security.log
monthly_output=/var/log/monthly.log
monthly_status_security_output=/var/log/monthly_security.login the first test I only had the 3 lines for normal output(not security)
wanted to see if it was one or the other (ie normal or security logs that might in play..
then the second test (with security logs also redirected to files),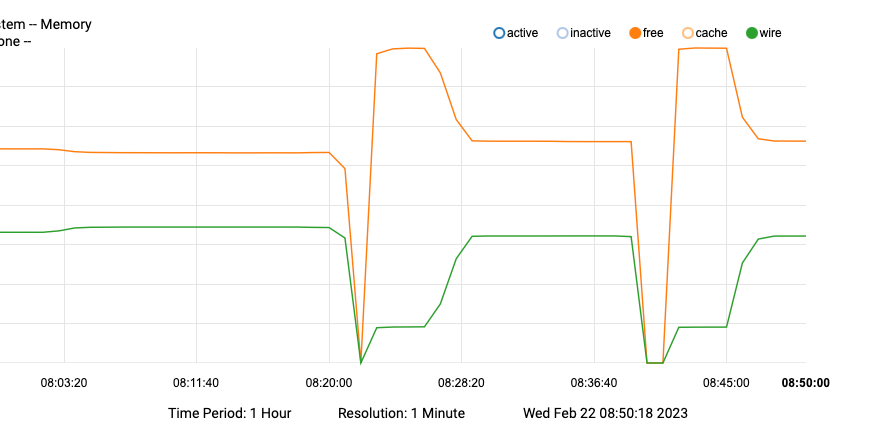
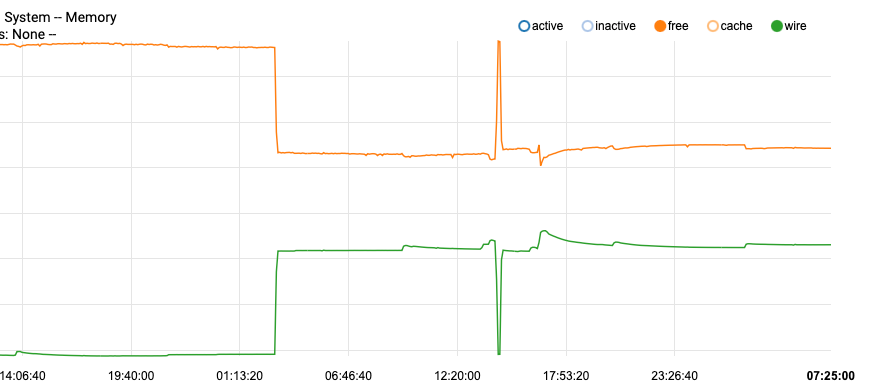
graph shows only free and wire
making this change did have a minor impact on the footprint but not enough to worry about. but at least now I can look at these reports if needed, not a bad thing.
since the "periodic daily" just runs a bunch of scripts and each can be disable (and a lot are disabled by default) I now looking at the conf "enabled" ones to see if there is "one that is most likely to"..
-
@jrey said in 1100 upgrade, 22.05->23.01, high mem usage:
it is not pfB, my tasks for that don't run at 3am and another user on here doesn't even have it installed. So I think safe to rule that out.
I've been going back through "periodic daily" it is clearly something in there.
going on the theory that out of box is set to email the daily, weekly, monthly (and security) reports and but can't - this is the result of testing in that regard.I've done the following test since my previous post earlier today.
create a file /etc/periodic.conf.localin that file place these 6 lines
daily_output=/var/log/daily.log
daily_status_security_output=/var/log/daily_security.log
weekly_output=/var/log/weekly.log
weekly_status_security_output=/var/log/weekly_security.log
monthly_output=/var/log/monthly.log
monthly_status_security_output=/var/log/monthly_security.login the first test I only had the 3 lines for normal output(not security)
wanted to see if it was one or the other (ie normal or security logs that might in play..
then the second test (with security logs also redirected to files),graph shows only free and wire
making this change did have a minor impact on the footprint but not enough to worry about. but at least now I can look at these reports if needed, not a bad thing.
since the "periodic daily" just runs a bunch of scripts and each can be disable (and a lot are disabled by default) I now looking at the conf "enabled" ones to see if there is "one that is most likely to"..
Check out the newest entries in this thread. They are trying to figure out what is happening during the daily periodic...
https://forum.netgate.com/topic/177886/23-1-using-more-ram/56?_=1677011443983