23.1 using more RAM
-
Rebooted at 4PM yesterday. Memory doubled at exactly 3AM. The only cron job running at 3PM is the periodic daily job. There is nothing in the system logs that jumps out at me either. Note that my pfBlocker lists update at the top of every hour, so this is the the same in the logs:
Feb 21 02:54:00 sshguard 64916 Exiting on signal.
Feb 21 02:54:00 sshguard 42003 Now monitoring attacks.
Feb 21 03:00:00 php 29385 [pfBlockerNG] Starting cron process.
Feb 21 03:00:02 php 29385 [pfBlockerNG] No changes to Firewall rules, skipping Filter Reload
Feb 21 03:22:00 sshguard 42003 Exiting on signal.
Feb 21 03:22:00 sshguard 73966 Now monitoring attacks.
Feb 21 03:50:00 sshguard 73966 Exiting on signal.
Feb 21 03:50:00 sshguard 54191 Now monitoring attacks.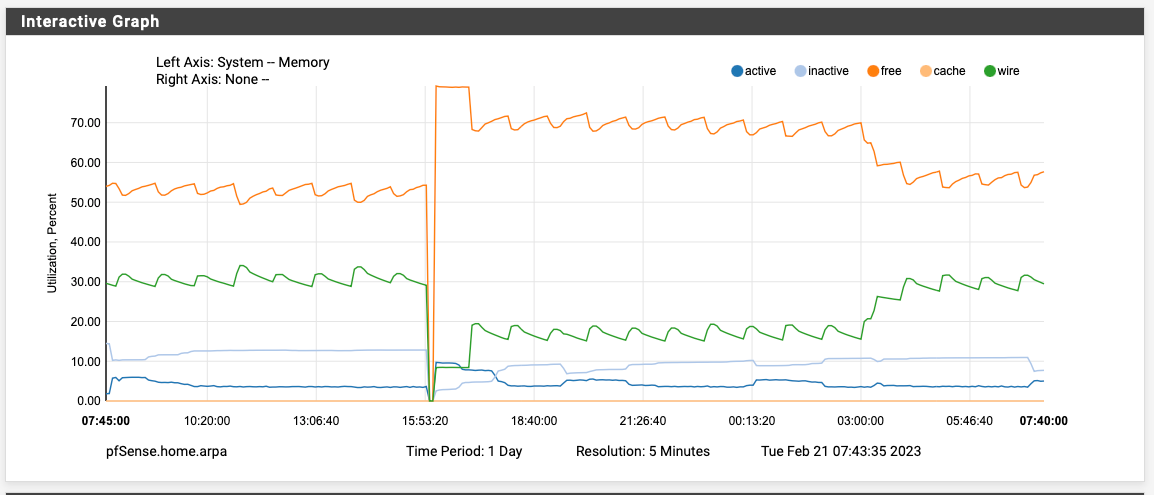
-
FYI, there's now package updates available for pfBlockerNG and Suricata. Perhaps this will help.
-
S SteveITS referenced this topic on
-
S SteveITS referenced this topic on
-
S SteveITS referenced this topic on
-
@defenderllc said in 23.1 using more RAM:
FYI, there's now package updates available for pfBlockerNG and Suricata. Perhaps this will help.
Installed both and rebooting... I will report back tomorrow morning so see if it resolved the 3AM spike.
-
At least this night no more memory usage:
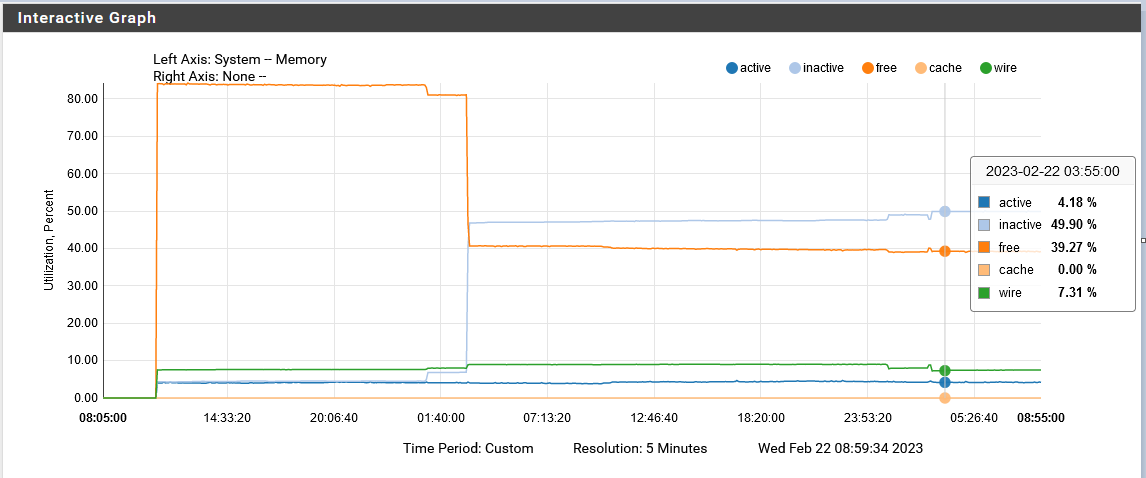
So it seems to be a one-time-shot, as others are reporting.
Regards
-
F FSC830 referenced this topic on
-
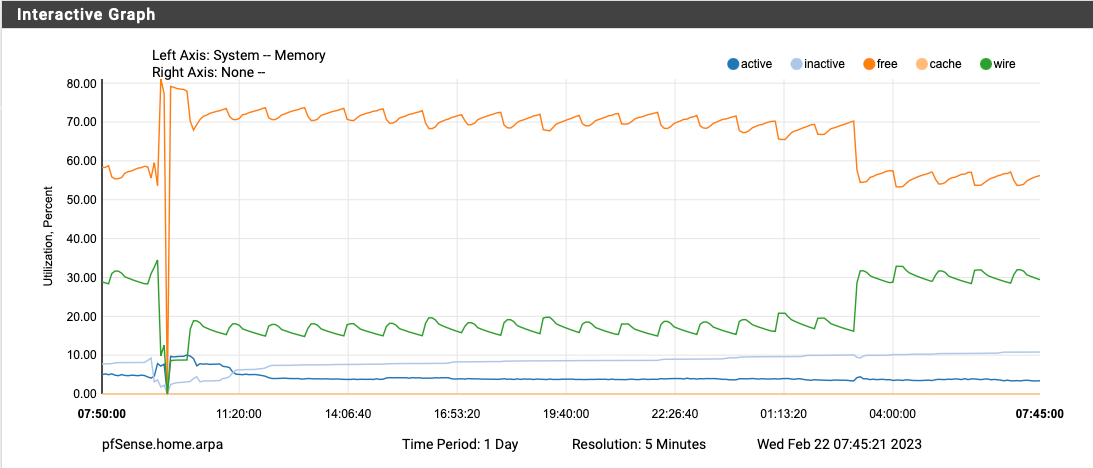
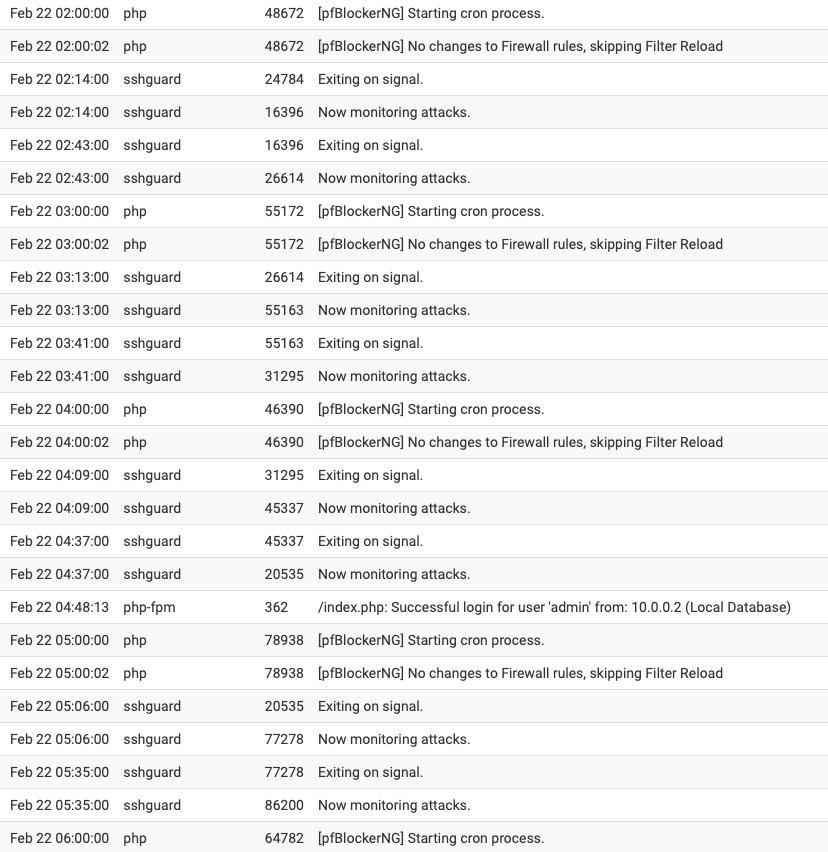
Upgraded to pfBlockerNG 3.2.0_2 yesterday, disabled Suricata completely, and rebooted around 9:30 AM yesterday morning. The memory utilization doubled again at exactly 3AM. The only cron job running at 3AM is the daily periodical and hourly pfBlocker updates (which there wasn't any lists to update today at 3AM).
I've also attached my system log from 2AM to 6AM and there is nothing worthwhile in there to explain what is happening at 3AM besides the daily periodical.
-
I'd have to look over the code but one thing it does during the daily periodic script is check if ZFS pools need to be scrubbed. I wouldn't expect that to trigger high memory usage in general, but it's possible. That wouldn't explain why some people see it and others don't, though.
Someone could reboot and then run periodic script by hand to see if doing so also triggers the increase in memory usage. Or even just try
zpool scrub pfSenseand check before/after that finishes. You can runzpool status pfSenseto check on the status of an active scrub operation. -
@jimp said in 23.1 using more RAM:
I'd have to look over the code but one thing it does during the daily periodic script is check if ZFS pools need to be scrubbed. I wouldn't expect that to trigger high memory usage in general, but it's possible. That wouldn't explain why some people see it and others don't, though.
Someone could reboot and then run periodic script by hand to see if doing so also triggers the increase in memory usage. Or even just try
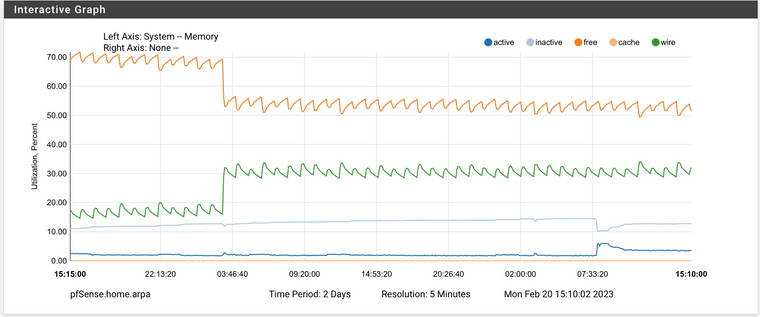
zpool scrub pfSenseand check before/after that finishes. You can runzpool status pfSenseto check on the status of an active scrub operation.Hi Jim, I will try that when I get some free time today. This is a daily occurrence on my 6100 MAX. Here's 2-day graph from a few days ago. The memory never gets returned after the spike occurs.
-
@jimp : Me too having that memory jump and do not use ZFS!??

Regards
-
If it's ZFS ARC usage that's what I'd expect to see. It won't give it up right away but if something else needs the RAM the kernel should reduce the cache as needed under memory pressure. That doesn't mean it would never swap, but it should mean it doesn't fill up swap.
You could also experiment with setting an upper bound on the ARC size (
vfs.zfs.arc_max=<bytes>as a tunable, doesn't need to be a loader tunable) for example, but the exact value for that depends a lot on your system (RAM size/Kernel memory, disk size, etc.). There are likely other ZFS parameters that could be tuned if that does turn out to be related.If you aren't using ZFS then we'll need to keep digging into what exactly is happening at that time that might also be contributing.
-
Its a SG-3100 and I never did setup this appliance with ZFS.
Regards
-
@jimp Running periodic was done in this thread https://forum.netgate.com/topic/178023/1100-upgrade-22-05-23-01-high-mem-usage/30 and triggered it.
-
@fsc830 said in 23.1 using more RAM:
Its a SG-3100 and I never did setup this appliance with ZFS.
The 3100 isn't capable of ZFS anyhow (it's 32-bit ARM). But just to be certain, do you see any messages referring to ZFS in the system log (Status > System Logs, General tab), boot log (Status > System Logs, OS Boot tab), or kernel message buffer (From a shell or Diagnostics > Command, run
dmesg)?Even if the system doesn't use ZFS for its filesystem something may be inadvertently triggering the modules to load.
-
 D DefenderLLC referenced this topic on
-
 D DefenderLLC referenced this topic on
-
 D DefenderLLC referenced this topic on
-
@jimp said in 23.1 using more RAM:
I'd have to look over the code but one thing it does during the daily periodic script is check if ZFS pools need to be scrubbed. I wouldn't expect that to trigger high memory usage in general, but it's possible. That wouldn't explain why some people see it and others don't, though.
Someone could reboot and then run periodic script by hand to see if doing so also triggers the increase in memory usage. Or even just try
zpool scrub pfSenseand check before/after that finishes. You can runzpool status pfSenseto check on the status of an active scrub operation.No change after launching those commands.
-
@jimp : Nothing seen about ZFS in any log.
I am aware that the SG-3100 is not using ZFS, anyhow, I did see some posts here in which people say, they had setup the appliance with ZFS!???But I didnt take care for more investigating in this as I dont not intend to use ZFS.
Regards
-
It would require an extremely unorthodox install to get ZFS on a 3100. I won't say it's impossible because I'm sure someone would prove me wrong! But it would require a significant level of FreeBSD knowledge to even know where to start. So it's probably just a misunderstanding.
-
Looks like from the periodic scripts the
pkgrelated ones in/usr/local/etc/periodic/securityare the ones that seems to trigger it for me. They usepkgto validate parts of the system in various ways, but we don't do anything with the output so it is really unnecessary.Someone who is seeing this, try creating
/etc/periodic.confwith the following content:security_status_baseaudit_enable="NO" security_status_pkg_checksum_enable="NO" security_status_pkgaudit_enable="NO"And then reboot and watch it overnight (or try
periodic dailyfrom a shell prompt, I suppose)You can also knock the ARC usage back down by setting a lower limit than you have now which is almost certainly 0 (unlimited) which is the default. So you can do this to set a 256M limit:
sysctl vfs.zfs.arc_max='268435456'You can set it back to
0to remove the limit after making sure the ARC usage dropped back down.All that said, I still can't reproduce it being a problem source here. I have some small VMs with ~1GB RAM and ZFS and their wired usage is high but drops immediately when the system needs active memory.
-
S SteveITS referenced this topic on
-
S SteveITS referenced this topic on
-
@jimp said in 23.1 using more RAM:
their wired usage is high but drops immediately when the system needs active memory.
I think this is part of the problem to be honest - users hate to see all their memory being used for whatever reason ;) Even if something is using it because nothing else is needing any memory and if that something needs it will be freed up for that something.
Just memory use showing high seems to trigger something is wrong in the users perspective.
-
@johnpoz said in 23.1 using more RAM:
@jimp said in 23.1 using more RAM:
their wired usage is high but drops immediately when the system needs active memory.
I think this is part of the problem to be honest - users hate to see all their memory being used for whatever reason ;) Even if something is using it because nothing else is needing any memory and if that something needs it will be freed up for that something.
Just memory use showing high seems to trigger something is wrong in the users perspective.
Right, "Free RAM is wasted RAM" and all, but some people are implying that it isn't giving up the memory on their systems or it's causing other problems such as interfering with traffic, but it's not clear if there is a direct causal link here yet. But if we can reduce/eliminate the impact of ARC as a potential cause it will at least help narrow down what those others issues might be.
-
@jimp all true..
X doesn't work - oh my memory use is showing 90% that must be it.. When that most likely has nothing to do with X.. But sure if you can reduce it so memory is only showing 10% used and still have X then more likely to look deeper to that is actually causing their X issue.
edit:
Just an attempt to put it another way, not trying to mansplain it to you hehehe ;) ROFL.. -
OMG... you mean...
the memory is sucked by extra terrestrials?
Or why do you refer to the X-files?
SCNR
Regards