10Gbase LAN on 6100

-
I would move one the test hosts to a different VLAN and move data through pfSense to test the actual job of pfSense.
Even if you only use the one 10Gb uplink you will have the bandwidth to test if 5Gb will work. -
@AndyRH said in 10Gbase LAN on 6100:
I would move one the test hosts to a different VLAN and move data through pfSense to test the actual job of pfSense.
Even if you only use the one 10Gb uplink you will have the bandwidth to test if 5Gb will work.Looks like it's not routing at 10GB either. I put my macbook on another VLAN and ran an iPerf back to my flash based NAS,
Connecting to host 192.168.1.30, port 5201
[  6] local 192.168.10.100 port 54067 connected to 192.168.1.30 port 5201
[ ID] Interval           Transfer     Bitrate
[  6]   0.00-1.01   sec   101 MBytes   845 Mbits/sec
[  6]   1.01-2.00   sec   102 MBytes   853 Mbits/sec
[  6]   2.00-3.01   sec   100 MBytes   839 Mbits/sec
[  6]   3.01-4.01   sec   101 MBytes   845 Mbits/sec
[  6]   4.01-5.00   sec  93.9 MBytes   790 Mbits/sec
[  6]   5.00-6.01   sec   102 MBytes   850 Mbits/sec
[  6]   6.01-7.01   sec  99.8 MBytes   837 Mbits/sec
[  6]   7.01-8.00   sec   102 MBytes   856 Mbits/sec
[  6]   8.00-9.01   sec  99.2 MBytes   832 Mbits/sec
[  6]   9.01-10.01  sec  99.4 MBytes   834 Mbits/sec
- - - - - - - - - - - - - - - - - - - - - - - - -
[ ID] Interval           Transfer     Bitrate
[  6]   0.00-10.01  sec   999 MBytes   838 Mbits/sec                  sender
[  6]   0.00-10.01  sec   999 MBytes   838 Mbits/sec                  receiver

iperf Done.
If they are on the same vlan (and on the same switch USW Flex XG) this is what I get,
Connecting to host 192.168.1.30, port 5201 [ 6] local 192.168.1.174 port 54181 connected to 192.168.1.30 port 5201 [ ID] Interval Transfer Bitrate [ 6] 0.00-1.01 sec 1.10 GBytes 9.42 Gbits/sec [ 6] 1.01-2.00 sec 1.09 GBytes 9.41 Gbits/sec [ 6] 2.00-3.00 sec 1.10 GBytes 9.41 Gbits/sec [ 6] 3.00-4.01 sec 1.10 GBytes 9.41 Gbits/sec [ 6] 4.01-5.01 sec 1.10 GBytes 9.41 Gbits/sec [ 6] 5.01-6.01 sec 1.09 GBytes 9.40 Gbits/sec [ 6] 6.01-7.01 sec 1.10 GBytes 9.41 Gbits/sec [ 6] 7.01-8.01 sec 1.10 GBytes 9.41 Gbits/sec [ 6] 8.01-9.01 sec 1.10 GBytes 9.41 Gbits/sec [ 6] 9.01-10.01 sec 1.10 GBytes 9.41 Gbits/sec - - - - - - - - - - - - - - - - - - - - - - - - - [ ID] Interval Transfer Bitrate [ 6] 0.00-10.01 sec 11.0 GBytes 9.41 Gbits/sec sender [ 6] 0.00-10.01 sec 11.0 GBytes 9.41 Gbits/sec receiver iperf Done. -
The test above is invalid, the Flex XG only has a 1GB uplink port. I don't have the hardware to test routing VLan's through the pfSense at 10GB just yet.
-
So the tests where you were seeing <1G were all across a 1G link somewhere?
-
@stephenw10 said in 10Gbase LAN on 6100:
So the tests where you were seeing <1G were all across a 1G link somewhere?
Sorry for the confusion. The VLAN test was invalid as yes there was a 1G link in the middle. The initial iperf3 test from pfsense to my desktop is valid and appears to cap at 1G despite all 10G links in between.
-
Hmm, how exactly dd you run that? Can you see more than 1Gbps using mutiple parallel streams? (-P in iperf3)
-
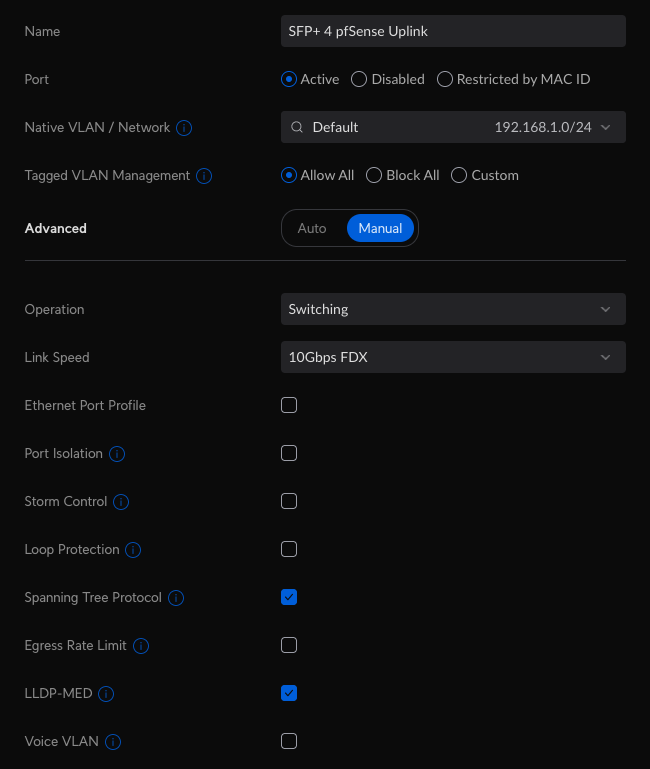
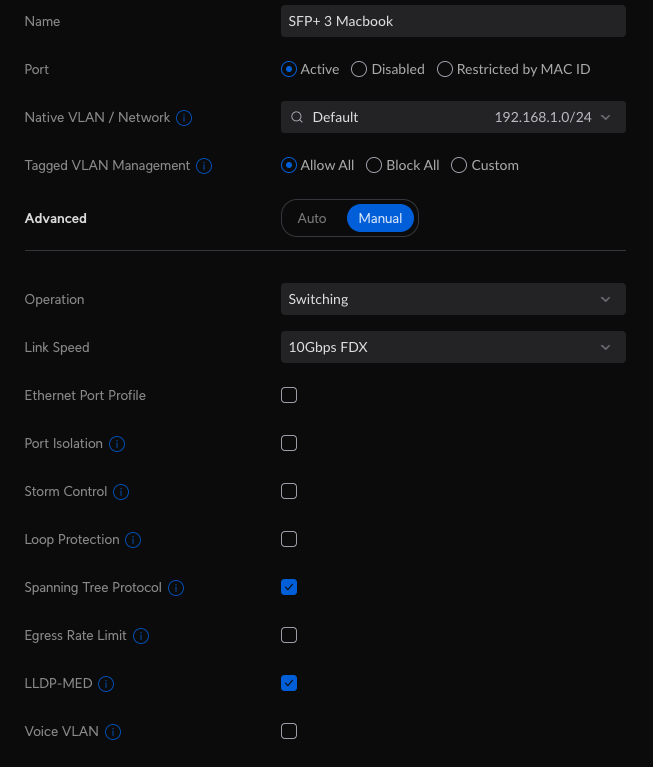
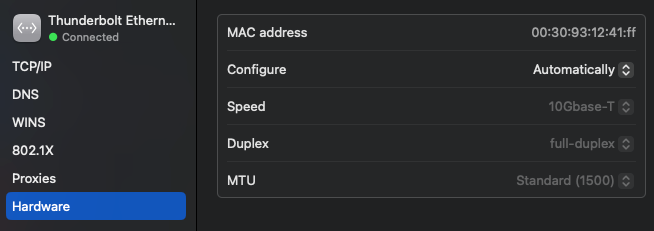
daltonch@MacBook-Pro ~> iperf3 -c pfsense.local -P 2
Connecting to host pfsense.local, port 5201
[  8] local 192.168.1.109 port 52552 connected to 192.168.1.1 port 5201
[ 10] local 192.168.1.109 port 52553 connected to 192.168.1.1 port 5201
[ ID] Interval           Transfer     Bitrate
[  8]   0.00-1.00   sec  81.0 MBytes   679 Mbits/sec
[ 10]   0.00-1.00   sec  81.9 MBytes   687 Mbits/sec
[SUM]   0.00-1.00   sec   163 MBytes  1.37 Gbits/sec
- - - - - - - - - - - - - - - - - - - - - - - - -
[  8]   1.00-2.00   sec  82.1 MBytes   688 Mbits/sec
[ 10]   1.00-2.00   sec  81.8 MBytes   685 Mbits/sec
[SUM]   1.00-2.00   sec   164 MBytes  1.37 Gbits/sec
- - - - - - - - - - - - - - - - - - - - - - - - -
[  8]   2.00-3.00   sec  81.8 MBytes   687 Mbits/sec
[ 10]   2.00-3.00   sec  90.1 MBytes   757 Mbits/sec
[SUM]   2.00-3.00   sec   172 MBytes  1.44 Gbits/sec
- - - - - - - - - - - - - - - - - - - - - - - - -
[  8]   3.00-4.00   sec  81.0 MBytes   679 Mbits/sec
[ 10]   3.00-4.00   sec  91.5 MBytes   767 Mbits/sec
[SUM]   3.00-4.00   sec   172 MBytes  1.45 Gbits/sec
- - - - - - - - - - - - - - - - - - - - - - - - -
[  8]   4.00-5.01   sec  80.9 MBytes   676 Mbits/sec
[ 10]   4.00-5.01   sec  87.6 MBytes   732 Mbits/sec
[SUM]   4.00-5.01   sec   168 MBytes  1.41 Gbits/sec
- - - - - - - - - - - - - - - - - - - - - - - - -
[  8]   5.01-6.01   sec  74.1 MBytes   622 Mbits/sec
[ 10]   5.01-6.01   sec  76.0 MBytes   638 Mbits/sec
[SUM]   5.01-6.01   sec   150 MBytes  1.26 Gbits/sec
- - - - - - - - - - - - - - - - - - - - - - - - -
[  8]   6.01-7.00   sec  84.5 MBytes   710 Mbits/sec
[ 10]   6.01-7.00   sec   512 KBytes  4.20 Mbits/sec
[SUM]   6.01-7.00   sec  85.0 MBytes   714 Mbits/sec
- - - - - - - - - - - - - - - - - - - - - - - - -
[  8]   7.00-8.00   sec  81.5 MBytes   686 Mbits/sec
[ 10]   7.00-8.00   sec   128 KBytes  1.05 Mbits/sec
[SUM]   7.00-8.00   sec  81.6 MBytes   687 Mbits/sec
- - - - - - - - - - - - - - - - - - - - - - - - -
[  8]   8.00-9.01   sec  83.4 MBytes   696 Mbits/sec
[ 10]   8.00-9.01   sec   128 KBytes  1.04 Mbits/sec
[SUM]   8.00-9.01   sec  83.5 MBytes   697 Mbits/sec
- - - - - - - - - - - - - - - - - - - - - - - - -
[  8]   9.01-10.01  sec  78.2 MBytes   656 Mbits/sec
[ 10]   9.01-10.01  sec   896 KBytes  7.34 Mbits/sec
[SUM]   9.01-10.01  sec  79.1 MBytes   664 Mbits/sec
- - - - - - - - - - - - - - - - - - - - - - - - -
[ ID] Interval           Transfer     Bitrate
[  8]   0.00-10.01  sec   808 MBytes   678 Mbits/sec                  sender
[  8]   0.00-10.01  sec   808 MBytes   678 Mbits/sec                  receiver
[ 10]   0.00-10.01  sec   510 MBytes   428 Mbits/sec                  sender
[ 10]   0.00-10.01  sec   510 MBytes   428 Mbits/sec                  receiver
[SUM]   0.00-10.01  sec  1.29 GBytes  1.11 Gbits/sec                  sender
[SUM]   0.00-10.01  sec  1.29 GBytes  1.11 Gbits/sec                  receiver

iperf Done.
daltonch@MacBook-Pro ~>
^ This is from my MacBook SONET 10GB Thunderbolt, Sonet SFP->OM3->UF-MM-10G->Unifi Enterprise 48 POE SFP+ port then to pfSense via Direct Attach Copper, everything shows up as 10GB negotiated.
-
Ok so it will pass >1G. That's running iperf3 in pfSense itself?
It's probably just maxing out a CPU core to do that. Try checking that with
top -HaSPwhen you are testing against it.I would expect to see at least 3-4Gbps through the 6100 if using iperf client and server on different interfaces.
Steve
-
@stephenw10 said in 10Gbase LAN on 6100:
Ok so it will pass >1G. That's running iperf3 in pfSense itself?
It's probably just maxing out a CPU core to do that. Try checking that with
top -HaSPwhen you are testing against it.I would expect to see at least 3-4Gbps through the 6100 if using iperf client and server on different interfaces.
Steve
So I ran a iperf with -P 4 and watched top,
Message from syslogd@pfSense at Dec 20 21:34:48 ...   TIME    WCPU COMMAND
   11pm[1602]: /in187 ki31     0B    64K CPU3     3 147.1H  99.46% [idle{idle: cpu3}]
   11 root        187 ki31     0B    64K CPU0     0 144.8H  99.34% [idle{idle: cpu0}]
   11 root        187 ki31     0B    64K RUN      1 145.8H  98.81% [idle{idle: cpu1}]
   11 root        187 ki31     0B    64K CPU2     2 147.7H  98.37% [idle{idle: cpu2}]
daltonch@MacBook-Pro ~> iperf3 -c pfsense.local.com -P 4 Connecting to host pfsense.2kgt.com, port 5201 [ 8] local 192.168.1.109 port 64613 connected to 192.168.1.1 port 5201 [ 10] local 192.168.1.109 port 64614 connected to 192.168.1.1 port 5201 [ 12] local 192.168.1.109 port 64615 connected to 192.168.1.1 port 5201 [ 14] local 192.168.1.109 port 64616 connected to 192.168.1.1 port 5201 [ ID] Interval Transfer Bitrate [ 8] 0.00-1.00 sec 42.4 MBytes 355 Mbits/sec [ 10] 0.00-1.00 sec 81.1 MBytes 679 Mbits/sec [ 12] 0.00-1.00 sec 40.1 MBytes 336 Mbits/sec [ 14] 0.00-1.00 sec 80.5 MBytes 673 Mbits/sec [SUM] 0.00-1.00 sec 244 MBytes 2.04 Gbits/sec - - - - - - - - - - - - - - - - - - - - - - - - - [ 8] 1.00-2.00 sec 48.1 MBytes 403 Mbits/sec [ 10] 1.00-2.00 sec 78.1 MBytes 655 Mbits/sec [ 12] 1.00-2.00 sec 32.5 MBytes 272 Mbits/sec [ 14] 1.00-2.00 sec 75.0 MBytes 629 Mbits/sec [SUM] 1.00-2.00 sec 234 MBytes 1.96 Gbits/sec - - - - - - - - - - - - - - - - - - - - - - - - - [ 8] 2.00-3.00 sec 48.5 MBytes 408 Mbits/sec [ 10] 2.00-3.00 sec 76.9 MBytes 646 Mbits/sec [ 12] 2.00-3.00 sec 31.8 MBytes 267 Mbits/sec [ 14] 2.00-3.00 sec 75.9 MBytes 638 Mbits/sec [SUM] 2.00-3.00 sec 233 MBytes 1.96 Gbits/sec - - - - - - - - - - - - - - - - - - - - - - - - - [ 8] 3.00-4.00 sec 47.9 MBytes 401 Mbits/sec [ 10] 3.00-4.00 sec 80.9 MBytes 678 Mbits/sec [ 12] 3.00-4.00 sec 31.5 MBytes 264 Mbits/sec [ 14] 3.00-4.00 sec 79.6 MBytes 667 Mbits/sec [SUM] 3.00-4.00 sec 240 MBytes 2.01 Gbits/sec - - - - - - - - - - - - - - - - - - - - - - - - - [ 8] 4.00-5.00 sec 48.2 MBytes 406 Mbits/sec [ 10] 4.00-5.00 sec 80.8 MBytes 679 Mbits/sec [ 12] 4.00-5.00 sec 31.4 MBytes 264 Mbits/sec [ 14] 4.00-5.00 sec 81.9 MBytes 689 Mbits/sec [SUM] 4.00-5.00 sec 242 MBytes 2.04 Gbits/sec - - - - - - - - - - - - - - - - - - - - - - - - - [ 8] 5.00-6.01 sec 47.1 MBytes 393 Mbits/sec [ 10] 5.00-6.01 sec 83.8 MBytes 699 Mbits/sec [ 12] 5.00-6.01 sec 31.1 MBytes 260 Mbits/sec [ 14] 5.00-6.01 sec 82.8 MBytes 691 Mbits/sec [SUM] 5.00-6.01 sec 245 MBytes 2.04 Gbits/sec - - - - - - - - - - - - - - - - - - - - - - - - - [ 8] 6.01-7.01 sec 46.4 MBytes 389 Mbits/sec [ 10] 6.01-7.01 sec 82.1 MBytes 689 Mbits/sec [ 12] 6.01-7.01 sec 30.6 MBytes 257 Mbits/sec [ 14] 6.01-7.01 sec 76.6 MBytes 643 Mbits/sec [SUM] 6.01-7.01 sec 236 MBytes 1.98 Gbits/sec - - - - - - - - - - - - - - - - - - - - - - - - - [ 8] 7.01-8.00 sec 48.1 MBytes 406 Mbits/sec [ 10] 7.01-8.00 sec 79.4 MBytes 669 Mbits/sec [ 12] 7.01-8.00 sec 31.8 MBytes 268 Mbits/sec [ 14] 7.01-8.00 sec 77.5 MBytes 653 Mbits/sec [SUM] 7.01-8.00 sec 237 MBytes 2.00 Gbits/sec - - - - - - - - - - - - - - - - - - - - - - - - - [ 8] 8.00-9.01 sec 46.2 MBytes 386 Mbits/sec [ 10] 8.00-9.01 sec 81.2 MBytes 678 Mbits/sec [ 12] 8.00-9.01 sec 30.0 MBytes 250 Mbits/sec [ 14] 8.00-9.01 sec 81.5 MBytes 680 Mbits/sec [SUM] 8.00-9.01 sec 239 MBytes 2.00 Gbits/sec - - - - - - - - - - - - - - - - - - - - - - - - - [ 8] 9.01-10.01 sec 47.6 MBytes 399 Mbits/sec [ 10] 9.01-10.01 sec 81.6 MBytes 685 Mbits/sec [ 12] 9.01-10.01 sec 31.1 MBytes 261 Mbits/sec [ 14] 9.01-10.01 sec 81.0 MBytes 679 Mbits/sec [SUM] 9.01-10.01 sec 241 MBytes 2.02 Gbits/sec - - - - - - - - - - - - - - - - - - - - - - - - - [ ID] Interval Transfer Bitrate [ 8] 0.00-10.01 sec 471 MBytes 395 Mbits/sec sender [ 8] 0.00-10.01 sec 470 MBytes 394 Mbits/sec receiver [ 10] 0.00-10.01 sec 806 MBytes 676 Mbits/sec sender [ 10] 0.00-10.01 sec 806 MBytes 675 Mbits/sec receiver [ 12] 0.00-10.01 sec 322 MBytes 270 Mbits/sec sender [ 12] 0.00-10.01 sec 322 MBytes 269 Mbits/sec receiver [ 14] 0.00-10.01 sec 792 MBytes 664 Mbits/sec sender [ 14] 0.00-10.01 sec 792 MBytes 664 Mbits/sec receiver [SUM] 0.00-10.01 sec 2.33 GBytes 2.00 Gbits/sec sender [SUM] 0.00-10.01 sec 2.33 GBytes 2.00 Gbits/sec receiver iperf Done.Does this mean the 6100 can't even get to 2.5GB/s? What a waste to put 10G SFP in it if that's the case.
-
That output shows no core is at more than 2% use (98% idle). Which seems very unlikely!
Are you sure it was actually updating that screen when the test was in progress?
I expect it to show something like:
last pid: 82666; load averages: 1.35, 0.62, 0.37 up 7+05:36:38 22:03:24 456 threads: 8 running, 412 sleeping, 1 zombie, 35 waiting CPU 0: 0.8% user, 0.0% nice, 47.8% system, 0.0% interrupt, 51.4% idle CPU 1: 11.4% user, 0.0% nice, 36.9% system, 0.0% interrupt, 51.8% idle CPU 2: 0.0% user, 0.0% nice, 89.4% system, 0.0% interrupt, 10.6% idle CPU 3: 10.2% user, 0.0% nice, 40.4% system, 0.0% interrupt, 49.4% idle Mem: 126M Active, 1120M Inact, 691M Wired, 56K Buf, 5844M Free ARC: 178M Total, 45M MFU, 121M MRU, 792K Anon, 1206K Header, 9739K Other 142M Compressed, 341M Uncompressed, 2.39:1 Ratio Swap: 1024M Total, 1024M Free PID USERNAME PRI NICE SIZE RES STATE C TIME WCPU COMMAND 0 root -60 - 0B 1888K CPU2 2 0:41 88.62% [kernel{if_io_tqg_2}] 77692 root 120 0 19M 8400K CPU3 3 0:32 79.82% iperf3 -s 11 root 187 ki31 0B 64K RUN 0 166.0H 49.41% [idle{idle: cpu0}] 0 root -60 - 0B 1888K CPU0 0 1:36 49.14% [kernel{if_io_tqg_0}] 11 root 187 ki31 0B 64K RUN 1 166.2H 47.66% [idle{idle: cpu1}] 11 root 187 ki31 0B 64K RUN 3 165.4H 43.69% [idle{idle: cpu3}] 15478 root 48 0 314M 218M bpf 3 0:53 28.07% /usr/local/bin/ntopng -d /var/db/ntopng - 11 root 187 ki31 0B 64K RUN 2 165.6H 11.24% [idle{idle: cpu2}] 0 root -64 - 0B 1888K - 0 0:28 0.28% [kernel{dummynet}] -
@stephenw10 said in 10Gbase LAN on 6100:
That output shows no core is at more than 2% use (98% idle). Which seems very unlikely!
Are you sure it was actually updating that screen when the test was in progress?
How about this one,
iperf3 -P 4 t 90last pid: 67660; load averages: 3.77, 1.61, 1.09 up 7+22:07:58 22:03:29 372 threads: 11 running, 332 sleeping, 8 zombie, 21 waiting CPU 0: 30.7% user, 3.5% nice, 61.0% system, 0.0% interrupt, 4.7% idle CPU 1: 7.5% user, 2.0% nice, 19.3% system, 68.1% interrupt, 3.1% idle CPU 2: 0.0% user, 1.2% nice, 97.6% system, 0.0% interrupt, 1.2% idle CPU 3: 9.8% user, 12.6% nice, 70.9% system, 2.8% interrupt, 3.9% idle Mem: 100M Active, 370M Inact, 802M Wired, 6520M Free ARC: 216M Total, 44M MFU, 153M MRU, 7404K Anon, 1779K Header, 8899K Other 172M Compressed, 513M Uncompressed, 2.99:1 Ratio PID USERNAME PRI NICE SIZE RES STATE C TIME WCPU COMMAND 0 root -60 - 0B 1520K CPU2 2 328:20 95.82% [kernel{if_io_tqg_2}] 12 root -56 - 0B 288K CPU1 1 3:06 67.52% [intr{swi1: netisr 3}] 12716 root 119 0 19M 8408K RUN 3 2:22 60.99% /usr/local/bin/iperf3 -s 0 root -60 - 0B 1520K - 3 269:59 48.89% [kernel{if_io_tqg_3}] 23797 root 23 0 742M 62M uwait 3 1:00 7.29% /usr/local/bin/tailscaled -port 41641 -tun tailscale0 -statedir /usr/local/pkg/tailscale/sta 23797 root 24 0 742M 62M uwait 0 1:47 6.10% /usr/local/bin/tailscaled -port 41641 -tun tailscale0 -statedir /usr/local/pkg/tailscale/sta -
Yes, more like it.
In that sort of test the limit is often iperf itself which is deliberately designed to run on a single thread. You can see it's running on Core3 and that is also being used to move packets.
So a test through the 6100 between different interfaces using external iperf nodes should show significantly more.