10Gbase LAN on 6100

-
The test above is invalid, the Flex XG only has a 1GB uplink port. I don't have the hardware to test routing VLan's through the pfSense at 10GB just yet.
-
So the tests where you were seeing <1G were all across a 1G link somewhere?
-
@stephenw10 said in 10Gbase LAN on 6100:
So the tests where you were seeing <1G were all across a 1G link somewhere?
Sorry for the confusion. The VLAN test was invalid as yes there was a 1G link in the middle. The initial iperf3 test from pfsense to my desktop is valid and appears to cap at 1G despite all 10G links in between.
-
Hmm, how exactly dd you run that? Can you see more than 1Gbps using mutiple parallel streams? (-P in iperf3)
-
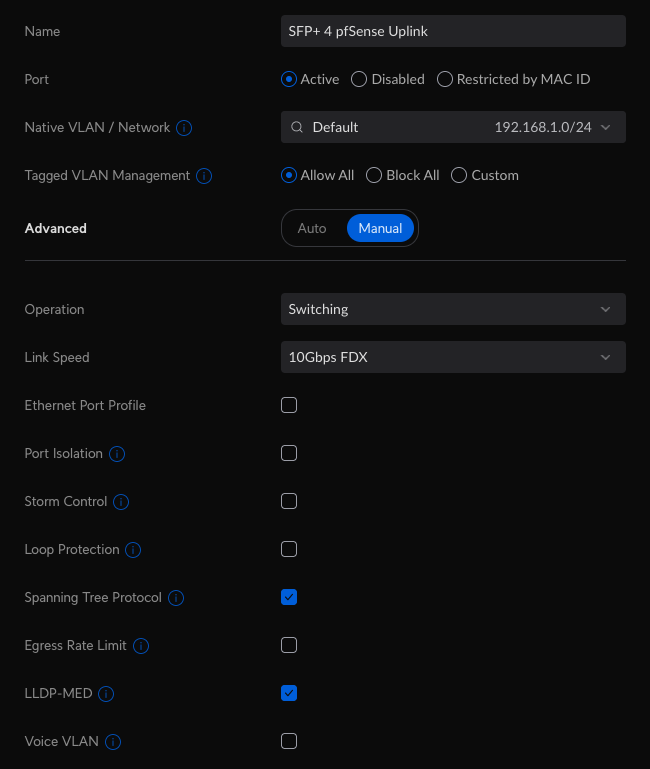
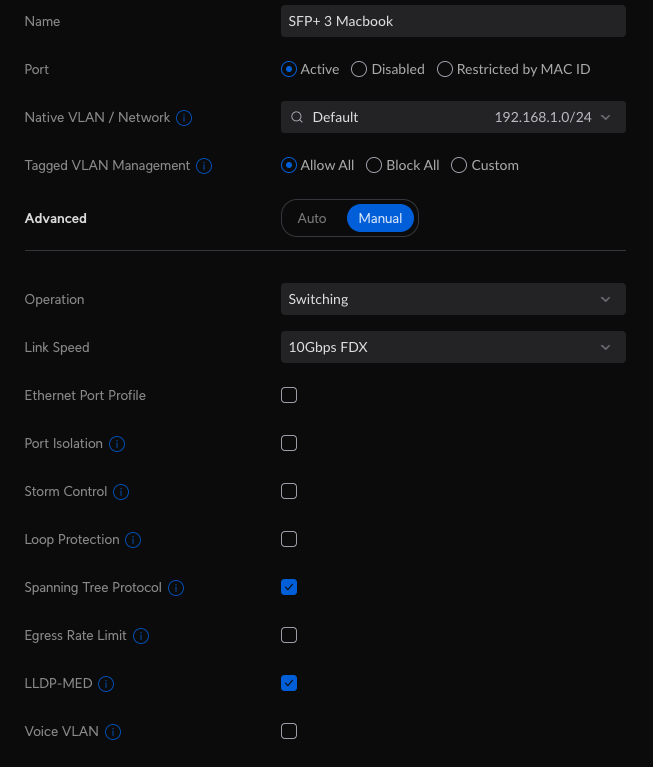
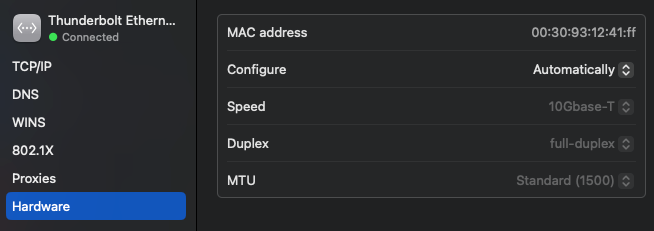
daltonch@MacBook-Pro ~> iperf3 -c pfsense.local -P 2
Connecting to host pfsense.local, port 5201
[  8] local 192.168.1.109 port 52552 connected to 192.168.1.1 port 5201
[ 10] local 192.168.1.109 port 52553 connected to 192.168.1.1 port 5201
[ ID] Interval           Transfer     Bitrate
[  8]   0.00-1.00   sec  81.0 MBytes   679 Mbits/sec
[ 10]   0.00-1.00   sec  81.9 MBytes   687 Mbits/sec
[SUM]   0.00-1.00   sec   163 MBytes  1.37 Gbits/sec
- - - - - - - - - - - - - - - - - - - - - - - - -
[  8]   1.00-2.00   sec  82.1 MBytes   688 Mbits/sec
[ 10]   1.00-2.00   sec  81.8 MBytes   685 Mbits/sec
[SUM]   1.00-2.00   sec   164 MBytes  1.37 Gbits/sec
- - - - - - - - - - - - - - - - - - - - - - - - -
[  8]   2.00-3.00   sec  81.8 MBytes   687 Mbits/sec
[ 10]   2.00-3.00   sec  90.1 MBytes   757 Mbits/sec
[SUM]   2.00-3.00   sec   172 MBytes  1.44 Gbits/sec
- - - - - - - - - - - - - - - - - - - - - - - - -
[  8]   3.00-4.00   sec  81.0 MBytes   679 Mbits/sec
[ 10]   3.00-4.00   sec  91.5 MBytes   767 Mbits/sec
[SUM]   3.00-4.00   sec   172 MBytes  1.45 Gbits/sec
- - - - - - - - - - - - - - - - - - - - - - - - -
[  8]   4.00-5.01   sec  80.9 MBytes   676 Mbits/sec
[ 10]   4.00-5.01   sec  87.6 MBytes   732 Mbits/sec
[SUM]   4.00-5.01   sec   168 MBytes  1.41 Gbits/sec
- - - - - - - - - - - - - - - - - - - - - - - - -
[  8]   5.01-6.01   sec  74.1 MBytes   622 Mbits/sec
[ 10]   5.01-6.01   sec  76.0 MBytes   638 Mbits/sec
[SUM]   5.01-6.01   sec   150 MBytes  1.26 Gbits/sec
- - - - - - - - - - - - - - - - - - - - - - - - -
[  8]   6.01-7.00   sec  84.5 MBytes   710 Mbits/sec
[ 10]   6.01-7.00   sec   512 KBytes  4.20 Mbits/sec
[SUM]   6.01-7.00   sec  85.0 MBytes   714 Mbits/sec
- - - - - - - - - - - - - - - - - - - - - - - - -
[  8]   7.00-8.00   sec  81.5 MBytes   686 Mbits/sec
[ 10]   7.00-8.00   sec   128 KBytes  1.05 Mbits/sec
[SUM]   7.00-8.00   sec  81.6 MBytes   687 Mbits/sec
- - - - - - - - - - - - - - - - - - - - - - - - -
[  8]   8.00-9.01   sec  83.4 MBytes   696 Mbits/sec
[ 10]   8.00-9.01   sec   128 KBytes  1.04 Mbits/sec
[SUM]   8.00-9.01   sec  83.5 MBytes   697 Mbits/sec
- - - - - - - - - - - - - - - - - - - - - - - - -
[  8]   9.01-10.01  sec  78.2 MBytes   656 Mbits/sec
[ 10]   9.01-10.01  sec   896 KBytes  7.34 Mbits/sec
[SUM]   9.01-10.01  sec  79.1 MBytes   664 Mbits/sec
- - - - - - - - - - - - - - - - - - - - - - - - -
[ ID] Interval           Transfer     Bitrate
[  8]   0.00-10.01  sec   808 MBytes   678 Mbits/sec                  sender
[  8]   0.00-10.01  sec   808 MBytes   678 Mbits/sec                  receiver
[ 10]   0.00-10.01  sec   510 MBytes   428 Mbits/sec                  sender
[ 10]   0.00-10.01  sec   510 MBytes   428 Mbits/sec                  receiver
[SUM]   0.00-10.01  sec  1.29 GBytes  1.11 Gbits/sec                  sender
[SUM]   0.00-10.01  sec  1.29 GBytes  1.11 Gbits/sec                  receiver

iperf Done.
daltonch@MacBook-Pro ~>
^ This is from my MacBook SONET 10GB Thunderbolt, Sonet SFP->OM3->UF-MM-10G->Unifi Enterprise 48 POE SFP+ port then to pfSense via Direct Attach Copper, everything shows up as 10GB negotiated.
-
Ok so it will pass >1G. That's running iperf3 in pfSense itself?
It's probably just maxing out a CPU core to do that. Try checking that with
top -HaSPwhen you are testing against it.I would expect to see at least 3-4Gbps through the 6100 if using iperf client and server on different interfaces.
Steve
-
@stephenw10 said in 10Gbase LAN on 6100:
Ok so it will pass >1G. That's running iperf3 in pfSense itself?
It's probably just maxing out a CPU core to do that. Try checking that with
top -HaSPwhen you are testing against it.I would expect to see at least 3-4Gbps through the 6100 if using iperf client and server on different interfaces.
Steve
So I ran a iperf with -P 4 and watched top,
Message from syslogd@pfSense at Dec 20 21:34:48 ...   TIME    WCPU COMMAND
   11pm[1602]: /in187 ki31     0B    64K CPU3     3 147.1H  99.46% [idle{idle: cpu3}]
   11 root        187 ki31     0B    64K CPU0     0 144.8H  99.34% [idle{idle: cpu0}]
   11 root        187 ki31     0B    64K RUN      1 145.8H  98.81% [idle{idle: cpu1}]
   11 root        187 ki31     0B    64K CPU2     2 147.7H  98.37% [idle{idle: cpu2}]
daltonch@MacBook-Pro ~> iperf3 -c pfsense.local.com -P 4 Connecting to host pfsense.2kgt.com, port 5201 [ 8] local 192.168.1.109 port 64613 connected to 192.168.1.1 port 5201 [ 10] local 192.168.1.109 port 64614 connected to 192.168.1.1 port 5201 [ 12] local 192.168.1.109 port 64615 connected to 192.168.1.1 port 5201 [ 14] local 192.168.1.109 port 64616 connected to 192.168.1.1 port 5201 [ ID] Interval Transfer Bitrate [ 8] 0.00-1.00 sec 42.4 MBytes 355 Mbits/sec [ 10] 0.00-1.00 sec 81.1 MBytes 679 Mbits/sec [ 12] 0.00-1.00 sec 40.1 MBytes 336 Mbits/sec [ 14] 0.00-1.00 sec 80.5 MBytes 673 Mbits/sec [SUM] 0.00-1.00 sec 244 MBytes 2.04 Gbits/sec - - - - - - - - - - - - - - - - - - - - - - - - - [ 8] 1.00-2.00 sec 48.1 MBytes 403 Mbits/sec [ 10] 1.00-2.00 sec 78.1 MBytes 655 Mbits/sec [ 12] 1.00-2.00 sec 32.5 MBytes 272 Mbits/sec [ 14] 1.00-2.00 sec 75.0 MBytes 629 Mbits/sec [SUM] 1.00-2.00 sec 234 MBytes 1.96 Gbits/sec - - - - - - - - - - - - - - - - - - - - - - - - - [ 8] 2.00-3.00 sec 48.5 MBytes 408 Mbits/sec [ 10] 2.00-3.00 sec 76.9 MBytes 646 Mbits/sec [ 12] 2.00-3.00 sec 31.8 MBytes 267 Mbits/sec [ 14] 2.00-3.00 sec 75.9 MBytes 638 Mbits/sec [SUM] 2.00-3.00 sec 233 MBytes 1.96 Gbits/sec - - - - - - - - - - - - - - - - - - - - - - - - - [ 8] 3.00-4.00 sec 47.9 MBytes 401 Mbits/sec [ 10] 3.00-4.00 sec 80.9 MBytes 678 Mbits/sec [ 12] 3.00-4.00 sec 31.5 MBytes 264 Mbits/sec [ 14] 3.00-4.00 sec 79.6 MBytes 667 Mbits/sec [SUM] 3.00-4.00 sec 240 MBytes 2.01 Gbits/sec - - - - - - - - - - - - - - - - - - - - - - - - - [ 8] 4.00-5.00 sec 48.2 MBytes 406 Mbits/sec [ 10] 4.00-5.00 sec 80.8 MBytes 679 Mbits/sec [ 12] 4.00-5.00 sec 31.4 MBytes 264 Mbits/sec [ 14] 4.00-5.00 sec 81.9 MBytes 689 Mbits/sec [SUM] 4.00-5.00 sec 242 MBytes 2.04 Gbits/sec - - - - - - - - - - - - - - - - - - - - - - - - - [ 8] 5.00-6.01 sec 47.1 MBytes 393 Mbits/sec [ 10] 5.00-6.01 sec 83.8 MBytes 699 Mbits/sec [ 12] 5.00-6.01 sec 31.1 MBytes 260 Mbits/sec [ 14] 5.00-6.01 sec 82.8 MBytes 691 Mbits/sec [SUM] 5.00-6.01 sec 245 MBytes 2.04 Gbits/sec - - - - - - - - - - - - - - - - - - - - - - - - - [ 8] 6.01-7.01 sec 46.4 MBytes 389 Mbits/sec [ 10] 6.01-7.01 sec 82.1 MBytes 689 Mbits/sec [ 12] 6.01-7.01 sec 30.6 MBytes 257 Mbits/sec [ 14] 6.01-7.01 sec 76.6 MBytes 643 Mbits/sec [SUM] 6.01-7.01 sec 236 MBytes 1.98 Gbits/sec - - - - - - - - - - - - - - - - - - - - - - - - - [ 8] 7.01-8.00 sec 48.1 MBytes 406 Mbits/sec [ 10] 7.01-8.00 sec 79.4 MBytes 669 Mbits/sec [ 12] 7.01-8.00 sec 31.8 MBytes 268 Mbits/sec [ 14] 7.01-8.00 sec 77.5 MBytes 653 Mbits/sec [SUM] 7.01-8.00 sec 237 MBytes 2.00 Gbits/sec - - - - - - - - - - - - - - - - - - - - - - - - - [ 8] 8.00-9.01 sec 46.2 MBytes 386 Mbits/sec [ 10] 8.00-9.01 sec 81.2 MBytes 678 Mbits/sec [ 12] 8.00-9.01 sec 30.0 MBytes 250 Mbits/sec [ 14] 8.00-9.01 sec 81.5 MBytes 680 Mbits/sec [SUM] 8.00-9.01 sec 239 MBytes 2.00 Gbits/sec - - - - - - - - - - - - - - - - - - - - - - - - - [ 8] 9.01-10.01 sec 47.6 MBytes 399 Mbits/sec [ 10] 9.01-10.01 sec 81.6 MBytes 685 Mbits/sec [ 12] 9.01-10.01 sec 31.1 MBytes 261 Mbits/sec [ 14] 9.01-10.01 sec 81.0 MBytes 679 Mbits/sec [SUM] 9.01-10.01 sec 241 MBytes 2.02 Gbits/sec - - - - - - - - - - - - - - - - - - - - - - - - - [ ID] Interval Transfer Bitrate [ 8] 0.00-10.01 sec 471 MBytes 395 Mbits/sec sender [ 8] 0.00-10.01 sec 470 MBytes 394 Mbits/sec receiver [ 10] 0.00-10.01 sec 806 MBytes 676 Mbits/sec sender [ 10] 0.00-10.01 sec 806 MBytes 675 Mbits/sec receiver [ 12] 0.00-10.01 sec 322 MBytes 270 Mbits/sec sender [ 12] 0.00-10.01 sec 322 MBytes 269 Mbits/sec receiver [ 14] 0.00-10.01 sec 792 MBytes 664 Mbits/sec sender [ 14] 0.00-10.01 sec 792 MBytes 664 Mbits/sec receiver [SUM] 0.00-10.01 sec 2.33 GBytes 2.00 Gbits/sec sender [SUM] 0.00-10.01 sec 2.33 GBytes 2.00 Gbits/sec receiver iperf Done.Does this mean the 6100 can't even get to 2.5GB/s? What a waste to put 10G SFP in it if that's the case.
-
That output shows no core is at more than 2% use (98% idle). Which seems very unlikely!
Are you sure it was actually updating that screen when the test was in progress?
I expect it to show something like:
last pid: 82666; load averages: 1.35, 0.62, 0.37 up 7+05:36:38 22:03:24 456 threads: 8 running, 412 sleeping, 1 zombie, 35 waiting CPU 0: 0.8% user, 0.0% nice, 47.8% system, 0.0% interrupt, 51.4% idle CPU 1: 11.4% user, 0.0% nice, 36.9% system, 0.0% interrupt, 51.8% idle CPU 2: 0.0% user, 0.0% nice, 89.4% system, 0.0% interrupt, 10.6% idle CPU 3: 10.2% user, 0.0% nice, 40.4% system, 0.0% interrupt, 49.4% idle Mem: 126M Active, 1120M Inact, 691M Wired, 56K Buf, 5844M Free ARC: 178M Total, 45M MFU, 121M MRU, 792K Anon, 1206K Header, 9739K Other 142M Compressed, 341M Uncompressed, 2.39:1 Ratio Swap: 1024M Total, 1024M Free PID USERNAME PRI NICE SIZE RES STATE C TIME WCPU COMMAND 0 root -60 - 0B 1888K CPU2 2 0:41 88.62% [kernel{if_io_tqg_2}] 77692 root 120 0 19M 8400K CPU3 3 0:32 79.82% iperf3 -s 11 root 187 ki31 0B 64K RUN 0 166.0H 49.41% [idle{idle: cpu0}] 0 root -60 - 0B 1888K CPU0 0 1:36 49.14% [kernel{if_io_tqg_0}] 11 root 187 ki31 0B 64K RUN 1 166.2H 47.66% [idle{idle: cpu1}] 11 root 187 ki31 0B 64K RUN 3 165.4H 43.69% [idle{idle: cpu3}] 15478 root 48 0 314M 218M bpf 3 0:53 28.07% /usr/local/bin/ntopng -d /var/db/ntopng - 11 root 187 ki31 0B 64K RUN 2 165.6H 11.24% [idle{idle: cpu2}] 0 root -64 - 0B 1888K - 0 0:28 0.28% [kernel{dummynet}] -
@stephenw10 said in 10Gbase LAN on 6100:
That output shows no core is at more than 2% use (98% idle). Which seems very unlikely!
Are you sure it was actually updating that screen when the test was in progress?
How about this one,
iperf3 -P 4 t 90last pid: 67660; load averages: 3.77, 1.61, 1.09 up 7+22:07:58 22:03:29 372 threads: 11 running, 332 sleeping, 8 zombie, 21 waiting CPU 0: 30.7% user, 3.5% nice, 61.0% system, 0.0% interrupt, 4.7% idle CPU 1: 7.5% user, 2.0% nice, 19.3% system, 68.1% interrupt, 3.1% idle CPU 2: 0.0% user, 1.2% nice, 97.6% system, 0.0% interrupt, 1.2% idle CPU 3: 9.8% user, 12.6% nice, 70.9% system, 2.8% interrupt, 3.9% idle Mem: 100M Active, 370M Inact, 802M Wired, 6520M Free ARC: 216M Total, 44M MFU, 153M MRU, 7404K Anon, 1779K Header, 8899K Other 172M Compressed, 513M Uncompressed, 2.99:1 Ratio PID USERNAME PRI NICE SIZE RES STATE C TIME WCPU COMMAND 0 root -60 - 0B 1520K CPU2 2 328:20 95.82% [kernel{if_io_tqg_2}] 12 root -56 - 0B 288K CPU1 1 3:06 67.52% [intr{swi1: netisr 3}] 12716 root 119 0 19M 8408K RUN 3 2:22 60.99% /usr/local/bin/iperf3 -s 0 root -60 - 0B 1520K - 3 269:59 48.89% [kernel{if_io_tqg_3}] 23797 root 23 0 742M 62M uwait 3 1:00 7.29% /usr/local/bin/tailscaled -port 41641 -tun tailscale0 -statedir /usr/local/pkg/tailscale/sta 23797 root 24 0 742M 62M uwait 0 1:47 6.10% /usr/local/bin/tailscaled -port 41641 -tun tailscale0 -statedir /usr/local/pkg/tailscale/sta -
Yes, more like it.
In that sort of test the limit is often iperf itself which is deliberately designed to run on a single thread. You can see it's running on Core3 and that is also being used to move packets.
So a test through the 6100 between different interfaces using external iperf nodes should show significantly more.