Netgate Discussion Forum
    • Categories
    • Recent
    • Tags
    • Popular
    • Users
    • Search
    • Register
    • Login

    6100 / 8200 SSD Wearouts

    Scheduled Pinned Locked Moved Official Netgate® Hardware
    21 Posts 6 Posters 2.6k Views 11 Watching
    Loading More Posts
    • Oldest to Newest
    • Newest to Oldest
    • Most Votes
    Reply
    • Reply as topic
    Log in to reply
    This topic has been deleted. Only users with topic management privileges can see it.
    • stephenw10S Online
      stephenw10 Netgate Administrator
      last edited by

      I assume you are using DNS-BL? That requires Unbound.

      1 Reply Last reply Reply Quote 0
      • S Offline
        SteveITS Rebel Alliance @Eria211
        last edited by

        @Eria211 We use pfBlocker and Suricata, and RAM disks, on all but a couple installs. We don’t use DNSBL though fwiw.

        https://forum.netgate.com/topic/180319/pfblockerng-with-ram-disk/2

        Only install packages for your version, or risk breaking it. Select your branch in System/Update/Update Settings.
        When upgrading, allow 10-15 minutes to reboot, or more depending on packages, and device or disk speed.
        Upvote 👍 helpful posts!

        1 Reply Last reply Reply Quote 0
        • stephenw10S Online
          stephenw10 Netgate Administrator
          last edited by

          I use DNS-BL with ram disks but only with a limited list. Just basic ad-blocking.

          1 Reply Last reply Reply Quote 0
          • A Offline
            azdeltawye @Eria211
            last edited by azdeltawye

            @Eria211
            This thread got me curious to check my system. I have a 4100-MAX that has been in service for about 10 months. I ran a SMART test and was alarmed to see that I have already written over 6 TB and used up 7% of the drive life!

            How do I use the top command to find out what is driving all this use?

            
            === START OF SMART DATA SECTION ===
            SMART overall-health self-assessment test result: PASSED
            
            SMART/Health Information (NVMe Log 0x02)
            Critical Warning:                   0x00
            Temperature:                        37 Celsius
            Available Spare:                    100%
            Available Spare Threshold:          1%
            Percentage Used:                    7%
            Data Units Read:                    22,625 [11.5 GB]
            Data Units Written:                 12,966,318 [6.63 TB]
            Host Read Commands:                 317,838
            Host Write Commands:                893,042,733
            Controller Busy Time:               3,974
            Power Cycles:                       38
            Power On Hours:                     6,553
            Unsafe Shutdowns:                   24
            Media and Data Integrity Errors:    0
            Error Information Log Entries:      0
            Warning  Comp. Temperature Time:    0
            Critical Comp. Temperature Time:    0
            Temperature Sensor 1:               56 Celsius
            Temperature Sensor 2:               37 Celsius
            Temperature Sensor 3:               38 Celsius
            Temperature Sensor 4:               37 Celsius
            Thermal Temp. 1 Transition Count:   1
            Thermal Temp. 1 Total Time:         23597
            
            Error Information (NVMe Log 0x01, 16 of 64 entries)
            No Errors Logged
            
            Self-tests not supported
            
            A 1 Reply Last reply Reply Quote 0
            • A Offline
              azdeltawye @azdeltawye
              last edited by azdeltawye

              So experimenting with the top command I tried this:

              top -m io -u unbound
              last pid: 21501; load averages: 0.50, 0.41, 0.33 up 55+18:54:38 13:10:18
              86 processes: 3 running, 83 sleeping
              CPU: 8.7% user, 2.8% nice, 12.0% system, 0.0% interrupt, 76.4% idle
              Mem: 447M Active, 490M Inact, 642M Wired, 56K Buf, 2222M Free
              ARC: 262M Total, 79M MFU, 165M MRU, 6291K Anon, 1563K Header, 10M Other
              209M Compressed, 567M Uncompressed, 2.72:1 Ratio
              Swap: 6144M Total, 6144M Free

              Does this confirm that the unbound process is the cause of the excessive drive activity?

              E 1 Reply Last reply Reply Quote 0
              • E Offline
                Eria211 @azdeltawye
                last edited by Eria211

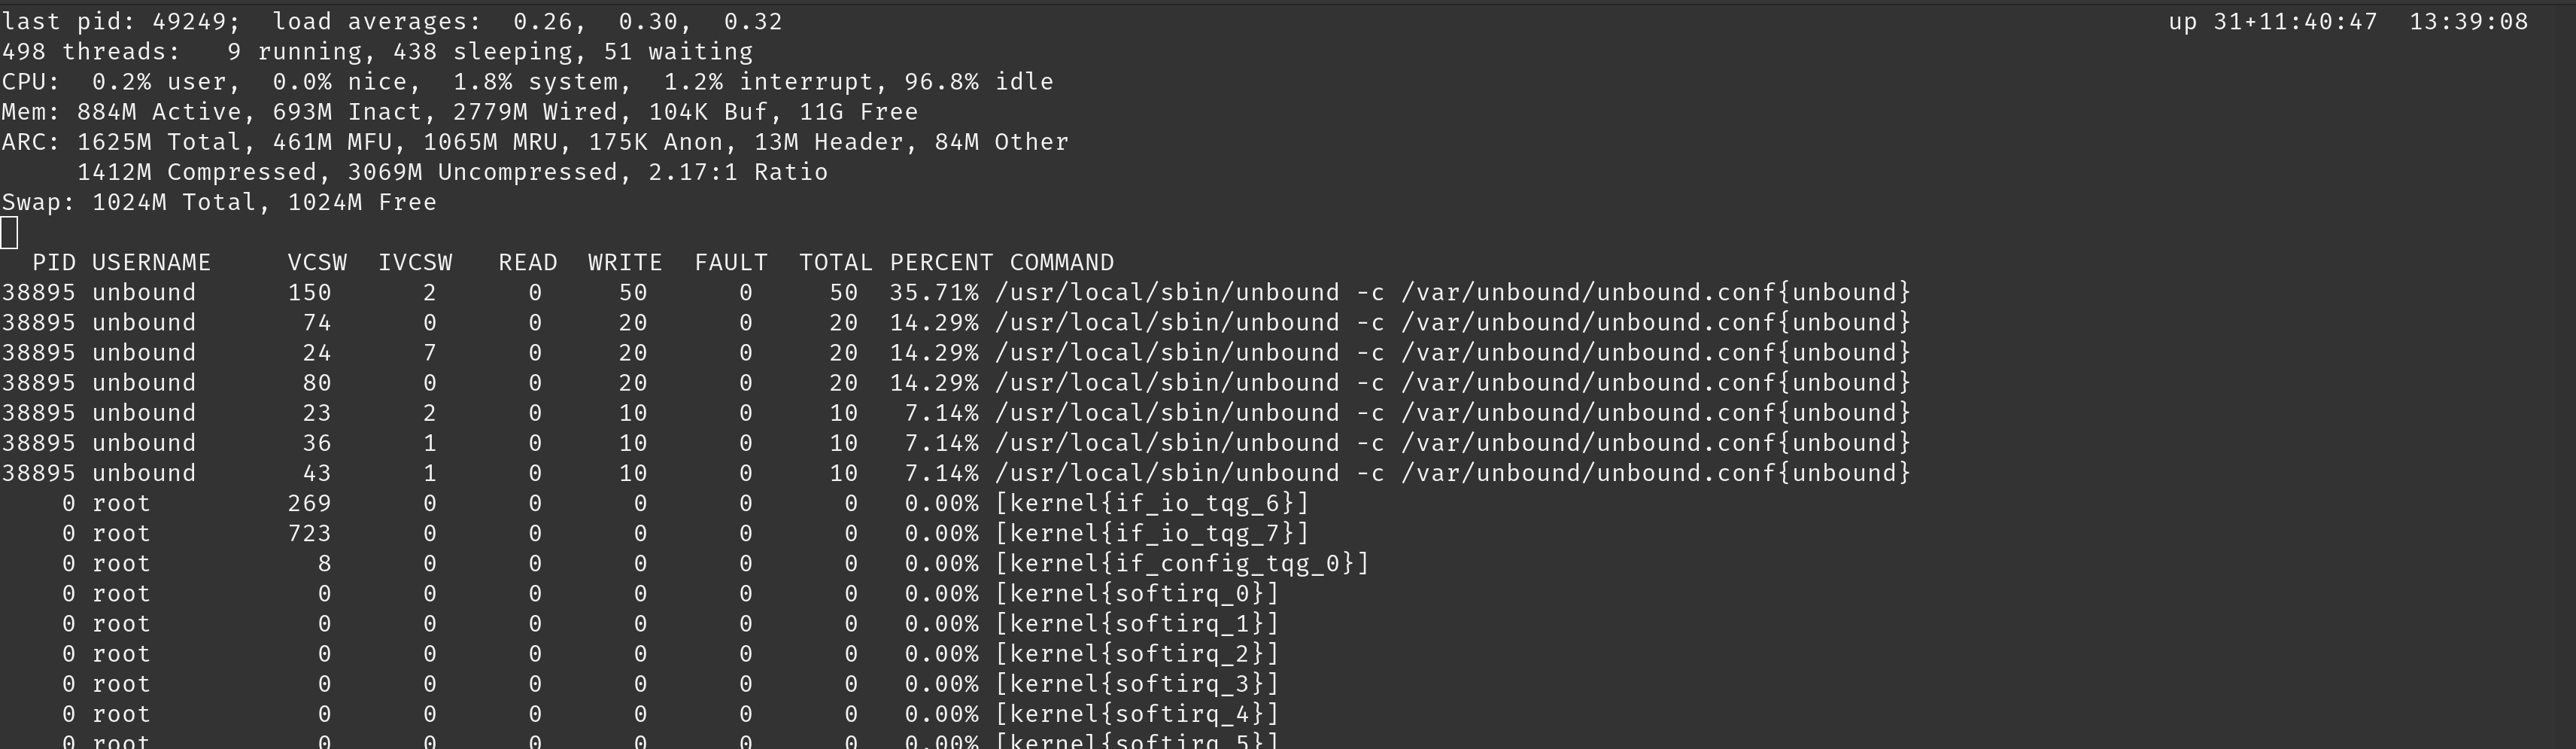
                @azdeltawye I ran top -aSH -m io -o total and took a screenshot

                I think if many more people posted their smart data here, we would probably discover that the wearout is a real problem experienced by many people.

                I wish the included drive had been ~256GB, as at least that would have given a greater capacity to wear out over time and significantly reduced the wear levels we are experiencing. If I had known this would be an issue I would have replaced each SSD before deployment.

                If you google generally in this area, quite a few people seem to have had SSD issues and there appear to have been many identified reasons. Still, most of the posts I've sampled just go quiet without a conclusion being identified (might just be my sample however).

                A post on this forum from 2018 is identical to my issue, which is sad:

                https://forum.netgate.com/post/998181

                A highlighted pair of posts that chime strongly with my experience:

                https://forum.netgate.com/topic/165993/should-i-be-using-unbound-python-mode-is-it-stable/6?_=1706907654864

                https://forum.netgate.com/topic/165993/should-i-be-using-unbound-python-mode-is-it-stable/8?_=1706907654866

                I'm currently reading through it to see if there's anything I can do to stop my wearout situation from getting worse

                M 1 Reply Last reply Reply Quote 0
                • M Offline
                  mcury Rebel Alliance @Eria211
                  last edited by

                  [23.09.1-RELEASE][root@pfsense.home.arpa]/root: iostat -x
                                          extended device statistics  
                  device       r/s     w/s     kr/s     kw/s  ms/r  ms/w  ms/o  ms/t qlen  %b  
                  nda0           0       5      1.1     32.7     0     0     0     0    0   0 
                  pass0          0       0      0.0      0.0     0     0     0     0    0   0 
                  

                  What I found in my SG-4100 is really weird.
                  A few days ago, I enabled DNSBL to check something in another post, a few days after I disabled it.
                  I thought that my IO would go down after that but guess what, it didn't.

                  So, I decided to perform a clean install and restored my configuration file and boom, IO is down again.
                  In this new installation, DNSBL has never been enabled.

                  I suppose there is something wrong with DNSBL right now.. not sure yet, perhaps it was something with previous setup..

                  dead on arrival, nowhere to be found.

                  S 1 Reply Last reply Reply Quote 0
                  • S Offline
                    SteveITS Rebel Alliance @mcury
                    last edited by

                    @mcury you didn’t specify so I’ll ask…did you restart at that point or just go ahead and reinstall?

                    @Eria211 try the RAM disk it should help immensely. Do you have the UT1 or another giant list like that configured?

                    Only install packages for your version, or risk breaking it. Select your branch in System/Update/Update Settings.
                    When upgrading, allow 10-15 minutes to reboot, or more depending on packages, and device or disk speed.
                    Upvote 👍 helpful posts!

                    M 1 Reply Last reply Reply Quote 0
                    • M Offline
                      mcury Rebel Alliance @SteveITS
                      last edited by

                      @SteveITS said in 6100 / 8200 SSD Wearouts:

                      you didn’t specify so I’ll ask…did you restart at that point or just go ahead and reinstall?

                      you mean, a restart after disabling DNSBL ? Not that I remember.
                      What I'm sure about is that when I checked iostat output, the device was UP for days..

                      dead on arrival, nowhere to be found.

                      S 1 Reply Last reply Reply Quote 0
                      • S Offline
                        SteveITS Rebel Alliance @mcury
                        last edited by

                        @mcury Yes, just wondering out loud if a restart would have cleared that condition. If not, that would imply something was changed/bad that wasn’t in the configuration, yet is persistent.

                        Only install packages for your version, or risk breaking it. Select your branch in System/Update/Update Settings.
                        When upgrading, allow 10-15 minutes to reboot, or more depending on packages, and device or disk speed.
                        Upvote 👍 helpful posts!

                        1 Reply Last reply Reply Quote 0
                        • First post
                          Last post
                        Copyright 2025 Rubicon Communications LLC (Netgate). All rights reserved.