2.7.2-RELEASE (amd64) Panic - Page fault
-
Hmm, nothing shown there to speak of.
You might want to stop logging those ARP movements if that's a lagg or some other known shared IP.
https://docs.netgate.com/pfsense/en/latest/troubleshooting/logs-arp-moved.htmlIs anything shown in the system log immediately before the panic?
-
I need to dig into why that unifi PDU unit (4.41) is causing that arp change, but I did just set that arp monitor to 0.
In the system log before it happen this time it shows
Feb 9 10:39:32 kernel ---<<BOOT>>---
Feb 9 10:39:32 kernel KDB: enter: panic
Feb 9 10:39:32 kernel time = 1707493096
Feb 9 10:39:32 kernel cpuid = 0
Feb 9 10:39:32 kernel panic: page fault
Feb 9 10:39:32 kernel trap number = 12
Feb 9 10:39:32 kernel r13: 0000000000004fe1 r14: 0000000000004fe1 r15: fffff8017895b400
Feb 9 10:39:32 kernel r10: 0000000000000000 r11: fffffe01001be700 r12: fffff80396696180
Feb 9 10:39:32 kernel rax: fffff801b48db700 rbx: fffff803dbfd3700 rbp: fffffe00ff544d00
Feb 9 10:39:32 kernel rcx: 0000000000000000 r8: fffff8017895b400 r9: 0000000000000000
Feb 9 10:39:32 kernel rdi: ffffffff82d62a40 rsi: ffffffff82d62a40 rdx: 0000000000010200
Feb 9 10:39:32 kernel current process = 48153 (isc-net-0002)
Feb 9 10:39:32 kernel processor eflags = interrupt enabled, resume, IOPL = 0
Feb 9 10:39:32 kernel = DPL 0, pres 1, long 1, def32 0, gran 1
Feb 9 10:39:32 kernel code segment = base 0x0, limit 0xfffff, type 0x1b
Feb 9 10:39:32 kernel frame pointer = 0x28:0xfffffe00ff544d00
Feb 9 10:39:32 kernel stack pointer = 0x28:0xfffffe00ff544c80
Feb 9 10:39:32 kernel instruction pointer = 0x20:0xffffffff80f44220
Feb 9 10:39:32 kernel fault code = supervisor read data, page not present
Feb 9 10:39:32 kernel fault virtual address = 0xb8
Feb 9 10:39:32 kernel cpuid = 2; apic id = 02
Feb 9 10:39:32 kernel Fatal trap 12: page fault while in kernel mode
Feb 9 10:39:32 syslogd kernel boot file is /boot/kernel/kernel
Feb 9 10:20:26 kernel arp: 172.16.4.41 moved from 1c:69:7a:03:2c:27 to 70:a7:41:f8:17:53 on em1
Feb 9 10:20:24 kernel arp: 172.16.4.41 moved from 70:a7:41:f8:17:53 to 1c:69:7a:03:2c:27 on em1
Feb 9 10:19:50 kernel arp: 172.16.4.41 moved from 1c:69:7a:03:2c:27 to 70:a7:41:f8:17:53 on em1
Feb 9 10:19:49 kernel arp: 172.16.4.41 moved from 70:a7:41:f8:17:53 to 1c:69:7a:03:2c:27 on em1
Feb 9 10:09:00 sshguard 38760 Now monitoring attacks.
Feb 9 10:09:00 sshguard 88357 Exiting on signal.
Feb 9 09:45:37 kernel arp: 172.16.4.41 moved from 1c:69:7a:03:2c:27 to 70:a7:41:f8:17:53 on em1
Feb 9 09:45:25 kernel arp: 172.16.4.41 moved from 70:a7:41:f8:17:53 to 1c:69:7a:03:2c:27 on em1
Feb 9 09:41:01 php 97072 /usr/local/sbin/acbupload.php: End of configuration backup to https://acb.netgate.com/save (success).
Feb 9 09:41:00 php 97072 /usr/local/sbin/acbupload.php: End of configuration backup to https://acb.netgate.com/save (success).
Feb 9 09:40:03 php-fpm 37391 /pkg_edit.php: Beginning configuration backup to https://acb.netgate.com/save
Feb 9 09:40:03 check_reload_status 447 Syncing firewall
Feb 9 09:40:03 php-fpm 37391 /pkg_edit.php: Configuration Change: admin@172.16.5.69 (Local Database): BIND: Saved resulting config file for zone in xml
Feb 9 09:40:02 php-fpm 37391 /pkg_edit.php: Beginning configuration backup to https://acb.netgate.com/save
Feb 9 09:40:02 check_reload_status 447 Syncing firewall
Feb 9 09:40:02 php-fpm 37391 /pkg_edit.php: Configuration Change:
Feb 9 09:39:30 php-fpm 95011 /index.php: Successful login for user 'admin' from: 172.16.5.69 (Local Database)
Feb 9 09:39:27 php-fpm 95011 /index.php: Session timed out for user 'admin' from: 172.16.5.69 (Local Database)
Feb 9 09:33:00 sshguard 88357 Now monitoring attacks. -
@carter69 said in 2.7.2-RELEASE (amd64) Panic - Page fault:
syslogd kernel boot file is /boot/kernel/kernel
Hmm, looks like syslogd restarted then. Do you have an external syslog server configured configured? Using IPv6?
-
System logs / settings / : Enable Remote Logging is Off if that is what you are asking about.
IPv6 on each interface is set to None.
-
Hmm, so you have no v6 IPs on any interface? That backtrace sure looks like something's trying to use it. Did you ever have IPv6 configured on that install?
-
Unless there is something somewhere else, I just went through Em0, em1, em2, em3, em4, em5 and confirmed that IPV6 Configuration Type is set to None. IPv4 Configuration type set to Static Ipv4. To the best of my knowledge, I have never had IPV6 configured since Frontier never supported it here. Should I try setting each of them to IPV6 DHCP, save and then set back to none ?
-
Run
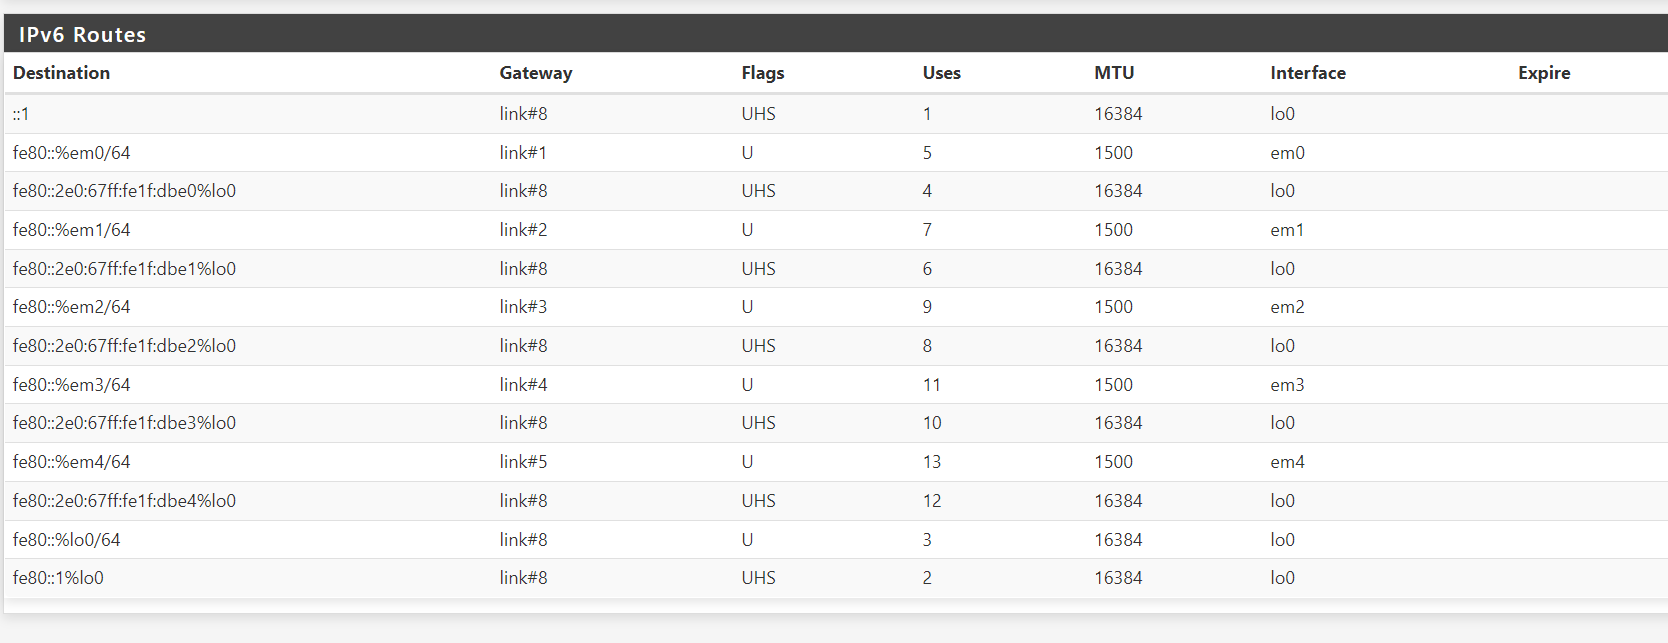
ifconfig -vaand check there in case something unassigned has somehow got one.Check Diag > Routes. There should only be link-local IPv6 addresses there.
-
@stephenw10
ifconfig
em0: flags=1008943<UP,BROADCAST,RUNNING,PROMISC,SIMPLEX,MULTICAST,LOWER_UP> metric 0 mtu 1500
	description: WANFrontier
	options=4e120bb<RXCSUM,TXCSUM,VLAN_MTU,VLAN_HWTAGGING,JUMBO_MTU,VLAN_HWCSUM,WOL_MAGIC,VLAN_HWFILTER,RXCSUM_IPV6,TXCSUM_IPV6,HWSTATS,MEXTPG>
	ether 00:e0:67:1f:db:e0
	inet6 fe80::2e0:67ff:fe1f:dbe0%em0 prefixlen 64 scopeid 0x1
	media: Ethernet autoselect (1000baseT <full-duplex>)
	status: active
	nd6 options=21<PERFORMNUD,AUTO_LINKLOCAL>
em1: flags=1008843<UP,BROADCAST,RUNNING,SIMPLEX,MULTICAST,LOWER_UP> metric 0 mtu 1500
	description: LAN
	options=4e120bb<RXCSUM,TXCSUM,VLAN_MTU,VLAN_HWTAGGING,JUMBO_MTU,VLAN_HWCSUM,WOL_MAGIC,VLAN_HWFILTER,RXCSUM_IPV6,TXCSUM_IPV6,HWSTATS,MEXTPG>
	ether 00:e0:67:1f:db:e1
	inet 172.16.7.254 netmask 0xfffffc00 broadcast 172.16.7.255
	inet6 fe80::2e0:67ff:fe1f:dbe1%em1 prefixlen 64 scopeid 0x2
	media: Ethernet autoselect (1000baseT <full-duplex>)
	status: active
	nd6 options=21<PERFORMNUD,AUTO_LINKLOCAL>
em2: flags=1008843<UP,BROADCAST,RUNNING,SIMPLEX,MULTICAST,LOWER_UP> metric 0 mtu 1500
	description: Servers
	options=4e120bb<RXCSUM,TXCSUM,VLAN_MTU,VLAN_HWTAGGING,JUMBO_MTU,VLAN_HWCSUM,WOL_MAGIC,VLAN_HWFILTER,RXCSUM_IPV6,TXCSUM_IPV6,HWSTATS,MEXTPG>
	ether 00:e0:67:1f:db:e2
	inet 172.16.3.254 netmask 0xfffffc00 broadcast 172.16.3.255
	inet6 fe80::2e0:67ff:fe1f:dbe2%em2 prefixlen 64 scopeid 0x3
	media: Ethernet autoselect (1000baseT <full-duplex>)
	status: active
	nd6 options=21<PERFORMNUD,AUTO_LINKLOCAL>
em3: flags=1008843<UP,BROADCAST,RUNNING,SIMPLEX,MULTICAST,LOWER_UP> metric 0 mtu 1500
	description: UbiquityOut
	options=4e120bb<RXCSUM,TXCSUM,VLAN_MTU,VLAN_HWTAGGING,JUMBO_MTU,VLAN_HWCSUM,WOL_MAGIC,VLAN_HWFILTER,RXCSUM_IPV6,TXCSUM_IPV6,HWSTATS,MEXTPG>
	ether 00:e0:67:1f:db:e3
	inet 192.168.52.254 netmask 0xffffff00 broadcast 192.168.52.255
	inet6 fe80::2e0:67ff:fe1f:dbe3%em3 prefixlen 64 scopeid 0x4
	media: Ethernet autoselect (1000baseT <full-duplex>)
	status: active
	nd6 options=21<PERFORMNUD,AUTO_LINKLOCAL>
em4: flags=1008843<UP,BROADCAST,RUNNING,SIMPLEX,MULTICAST,LOWER_UP> metric 0 mtu 1500
	description: DMZ1
	options=4e120bb<RXCSUM,TXCSUM,VLAN_MTU,VLAN_HWTAGGING,JUMBO_MTU,VLAN_HWCSUM,WOL_MAGIC,VLAN_HWFILTER,RXCSUM_IPV6,TXCSUM_IPV6,HWSTATS,MEXTPG>
	ether 00:e0:67:1f:db:e4
	inet 192.168.50.254 netmask 0xffffff00 broadcast 192.168.50.255
	inet6 fe80::2e0:67ff:fe1f:dbe4%em4 prefixlen 64 scopeid 0x5
	media: Ethernet autoselect (1000baseT <full-duplex>)
	status: active
	nd6 options=21<PERFORMNUD,AUTO_LINKLOCAL>
em5: flags=8802<BROADCAST,SIMPLEX,MULTICAST> metric 0 mtu 1500
	options=4e120bb<RXCSUM,TXCSUM,VLAN_MTU,VLAN_HWTAGGING,JUMBO_MTU,VLAN_HWCSUM,WOL_MAGIC,VLAN_HWFILTER,RXCSUM_IPV6,TXCSUM_IPV6,HWSTATS,MEXTPG>
	ether 00:e0:67:1f:db:e5
	media: Ethernet autoselect
	status: no carrier
	nd6 options=21<PERFORMNUD,AUTO_LINKLOCAL>
enc0: flags=1000041<UP,RUNNING,LOWER_UP> metric 0 mtu 1536
	options=0
	groups: enc
	nd6 options=21<PERFORMNUD,AUTO_LINKLOCAL>
lo0: flags=1008049<UP,LOOPBACK,RUNNING,MULTICAST,LOWER_UP> metric 0 mtu 16384
	options=680003<RXCSUM,TXCSUM,LINKSTATE,RXCSUM_IPV6,TXCSUM_IPV6>
	inet 127.0.0.1 netmask 0x0
	inet 169.254.44.110 netmask 0xfffffffc
	inet 169.254.44.230 netmask 0xfffffffc
	inet 169.254.47.194 netmask 0xfffffffc
	inet 169.254.45.42 netmask 0xfffffffc
	inet 169.254.46.70 netmask 0xfffffffc
	inet 169.254.45.114 netmask 0xfffffffc
	inet 169.254.57.170 netmask 0xfffffffc
	inet 169.254.57.178 netmask 0xfffffffc
	inet 169.254.57.246 netmask 0xfffffffc
	inet 169.254.56.158 netmask 0xfffffffc
	inet6 ::1 prefixlen 128
	inet6 fe80::1%lo0 prefixlen 64 scopeid 0x8
	groups: lo
	nd6 options=21<PERFORMNUD,AUTO_LINKLOCAL>
pflog0: flags=100<PROMISC> metric 0 mtu 33152
	options=0
	groups: pflog
pfsync0: flags=0 metric 0 mtu 1500
	options=0
	maxupd: 128 defer: off version: 1400
	syncok: 1
	groups: pfsync
Routes
-
Mmm, nothing current then.
How often do you see those panics? Is there any sort of pattern to them? Any action that triggers it?
-
@stephenw10
It stayed up all weekend, then this morning 8:15am it crashed again.db:0:kdb.enter.default> bt
Tracing pid 80056 tid 103031 td 0xfffffe00fe961e40
kdb_enter() at kdb_enter+0x32/frame 0xfffffe00fea73960
vpanic() at vpanic+0x163/frame 0xfffffe00fea73a90
panic() at panic+0x43/frame 0xfffffe00fea73af0
trap_fatal() at trap_fatal+0x40c/frame 0xfffffe00fea73b50
trap_pfault() at trap_pfault+0x4f/frame 0xfffffe00fea73bb0
calltrap() at calltrap+0x8/frame 0xfffffe00fea73bb0
--- trap 0xc, rip = 0xffffffff80f44220, rsp = 0xfffffe00fea73c80, rbp = 0xfffffe00fea73d00 ---
in6_pcbbind() at in6_pcbbind+0x360/frame 0xfffffe00fea73d00
udp6_bind() at udp6_bind+0x13c/frame 0xfffffe00fea73d60
sobind() at sobind+0x32/frame 0xfffffe00fea73d80
kern_bindat() at kern_bindat+0x96/frame 0xfffffe00fea73dc0
sys_bind() at sys_bind+0x9b/frame 0xfffffe00fea73e00
amd64_syscall() at amd64_syscall+0x109/frame 0xfffffe00fea73f30
fast_syscall_common() at fast_syscall_common+0xf8/frame 0xfffffe00fea73f30
--- syscall (104, FreeBSD ELF64, bind), rip = 0x828045cea, rsp = 0x82beadaf8, rbp = 0x82beadbc0 ---I have been going through trying to see any correlation but have not figured out any. There are 9 IPsec tunnels to AWS. They are not all always active since some of them shut down after period of inactivity so I had initially thought it might be that but randomly went into the ipsec status and told it to start up ones that were disconnected just to see if that was the cause but could not get it to crash. I removed any extra packages that I did not need in case any of those happened to have a problem. The only ones currently installed are Acme, backup, bind, cron, mailreport , notes, rrd summary, status traffic totals.
-
Hmm, can you disable bind as a test?
Or if you can't do you have it configured to 'Listen on all interfaces'? Can you set that to the required interfaces only?
Is it set to IPv4+IPv6? Can you set it to IPv4 only?
-
Has stayed up for 2 days 7 hours so knock on wood. But I did set BIND to IPF4 only. It was only set for 2 interfaces (lan and servers).
So will see what happens. Appreciate the suggestions.
-
Still up for 4 days now and I do have Bind set to only IPV4 for past 2 days.
-
Hmm, that seems quite likely then. Not sure why it wouldn't be able to listen on the link-local or localhost v6 addresses though.
-
No issues for 9 days now, guess I will leave it in this configuration. Thanks for the suggestions.