WAN interface interrupts

-
@Antibiotic said in WAN interface interrupts:
top -HaSP command, is it normally?
PID USERNAME PRI NICE SIZE RES STATE C TIME WCPU COMMAND
11 root 187 ki31 0B 64K CPU3 3 94:09 100.00% [idle{idle: cpu3}]
11 root 187 ki31 0B 64K CPU2 2 94:01 100.00% [idle{idle: cpu2}]
11 root 187 ki31 0B 64K CPU0 0 94:12 99.93% [idle{idle: cpu0}]
11 root 187 ki31 0B 64K RUN 1 93:59 99.74% [idle{idle: cpu1}]Your CPU, 4 cores, is doing 'nothing' is close to 100 % being idle = doing nothing.
Your hardware is waaaay over scaled

Not normal, but this happens a lot.@Antibiotic said in WAN interface interrupts:
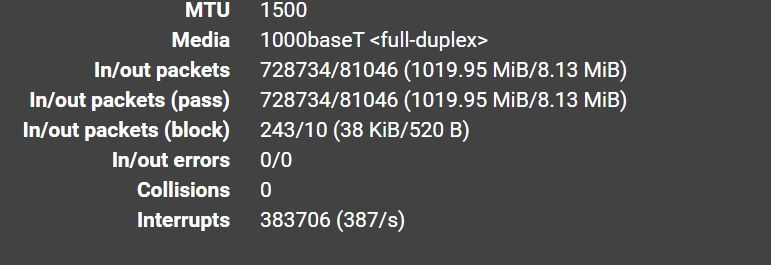
But have almost 400
400 interrupts.
To start to understand what this means, have a look at the 6502 series of Ben Eater (Youtube).
Packets are "1500" bytes, as shown, and every time a packet has been send or received one, the interface (chip) fires an interrupt to signal the kernel : "Are there more packets to handle ?"
( 400 x 1500 ) = about a 4 mega bits per second stream, in the two directions (!)It's very easy to bring this '400' interrupts down : disconnect all your LAN connections and recheck You will have to use the console interface to check.
-
@Gertjan said in WAN interface interrupts:
Your hardware is waaaay over scaled
What do you mean? and what have to do for avoid this?
-
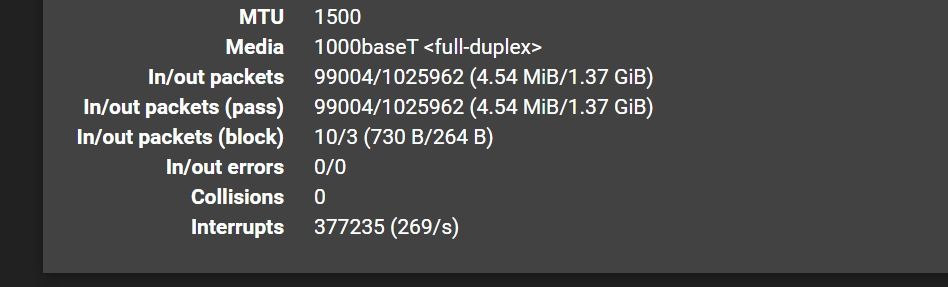
@stephenw10 Passing normally 1gb up/down, but its wasn't this interrupts before, going last a few days
-
@Gertjan said in WAN interface interrupts:
It's very easy to bring this '400' interrupts down : disconnect all your LAN connections and recheck
Yea , but what the reason to use pfsense without LAN)))
-
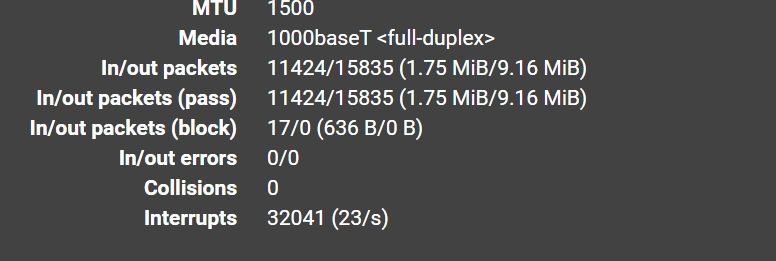
@Gertjan Checked out now, about 150/s.
-
400/s doesn't seem unusual if it's been moving 1Gbps since the stats were reset. And it looks like you data was recently reset which means the average value shown there will be much more affected by spikes in throughput.
-
@stephenw10 As me posted above command: top -HaSP
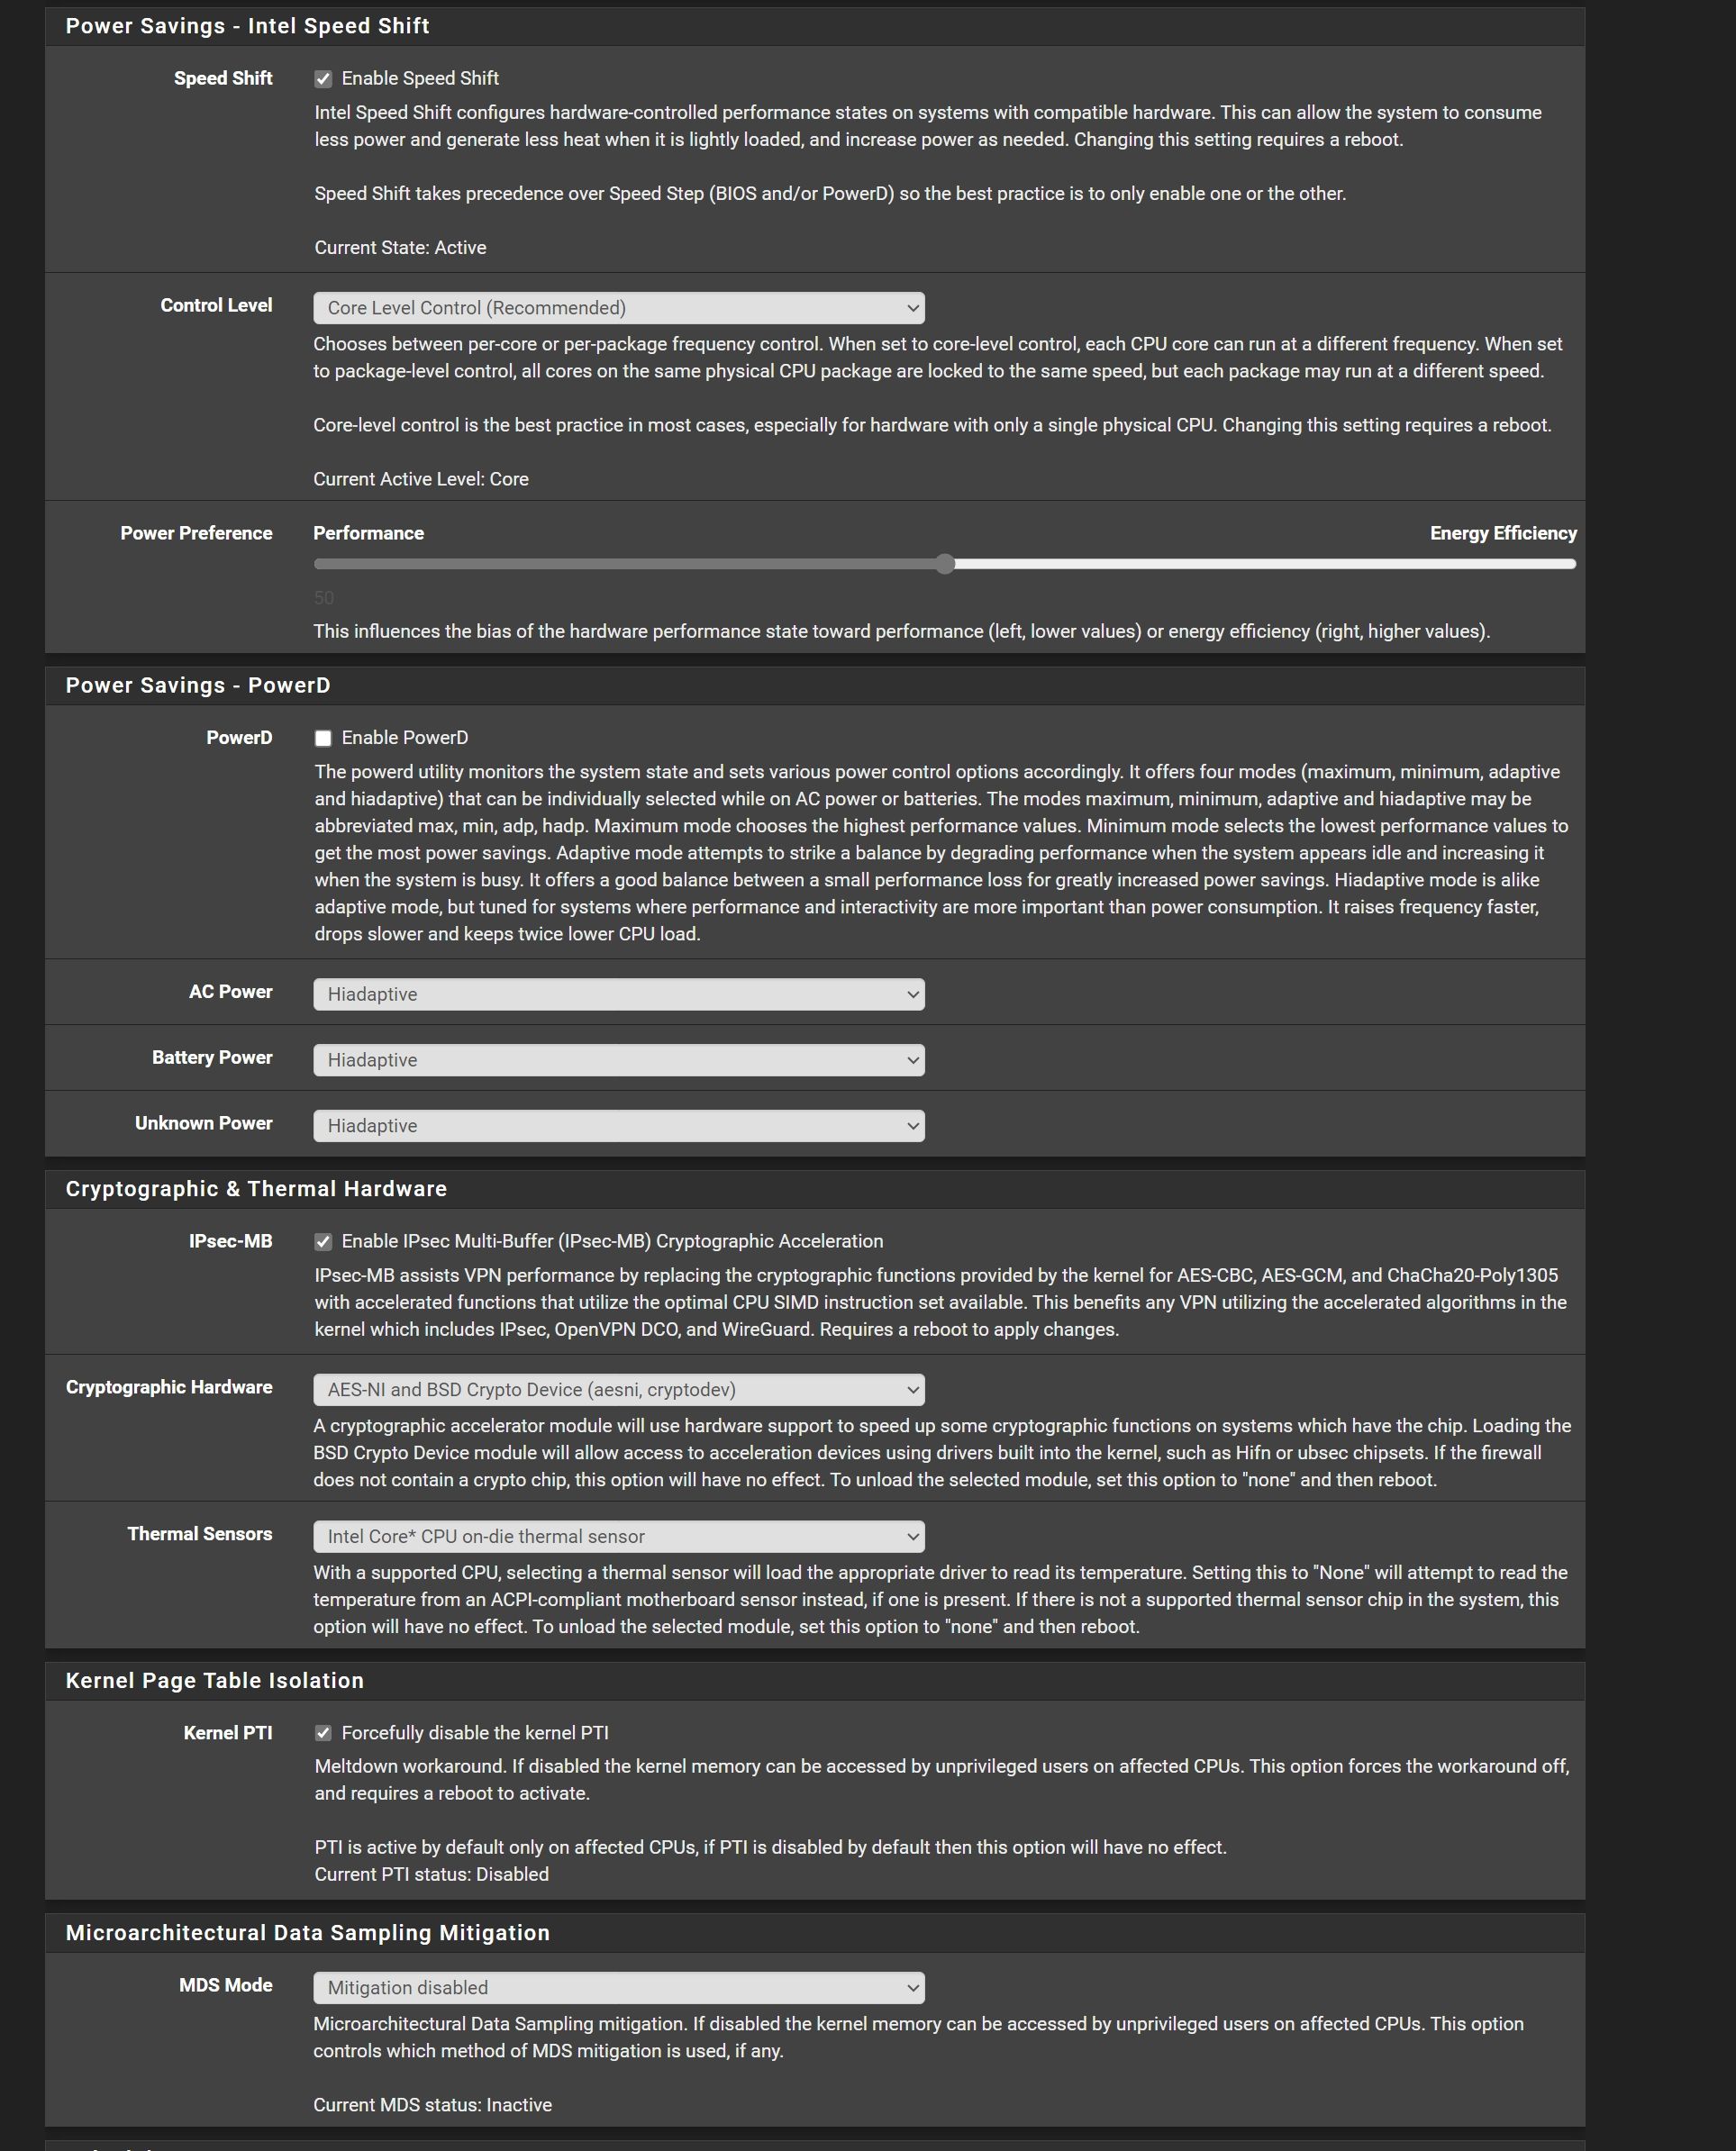
My cpu cores almost idle 100%. Is it possible to test to be sure that pfSense can use all cores? or could me need to set some specific option in /boot/load.conf.local. May be pfSense do not see all cores normally? Colud be need to set PowerD instead Speed Shift?
-
Run
top -HaSPand then test. You'll see how the load is distributed across the cores. -
@stephenw10
Tested with speed test
Core1 about 75-80
Core2 about 90-95
Core3 and Core4 about 95-100During browsering all almost 100 idle
-
OK so loading on all cores. I'm really not seeing a problem here.
-
@stephenw10 Ok, thanks