Extremely slow DNS solved by disabling & re-enabling Python mode (unbound)
-
Yesterday evening DNS started working very slowly.
Example of a nslookup:
> google.com
;; communications error to 192.168.128.1#53: timed out
Server:		192.168.128.1
Address:	192.168.128.1#53

Non-authoritative answer:
Name:	google.com
Address: 74.125.133.101
Name:	google.com
Address: 74.125.133.113
Name:	google.com
Address: 74.125.133.138
Name:	google.com
Address: 74.125.133.100
Name:	google.com
Address: 74.125.133.102
Name:	google.com
Address: 74.125.133.139
;; communications error to 192.168.128.1#53: timed out
;; communications error to 192.168.128.1#53: timed out
Name:	google.com
Address: 2a00:1450:400c:c07::8b
Name:	google.com
Address: 2a00:1450:400c:c07::71
Name:	google.com
Address: 2a00:1450:400c:c07::64
Name:	google.com
Address: 2a00:1450:400c:c07::8a
This morning I investigated this further. I noticed in the resolver logs 15 second recursion times. (Even though I do have DNS Forwarding enabled?)
I tried various things to solve this: restarted the service, rebooted the device, disabled DNS Forwarding + various advanced settings.
The last thing I did was to disable Python mode, after which everything started working again.
I then re-enabled Python mode, and it kept on working fine.
I also noticed CPU usage of unbound dropped from 15% to 5% between the first investigation and the end.
Any idea what could have been going on, and maybe how to prevent this happening again?
Full disclosure: I do use pfblockerng (in case this has anything to do with it).
-
@bernieke An hour or so after I posted this it started happening again. I've disabled python mode for now.
EDIT: It happened again, disabling pfblockerng this time.
-
@bernieke Your issue is most likely related to the restarting of unbound.. Do you have dhcp registration enabled? This restarts unbound on any dhcp event. How often are you having pfblocker redo its stuff.. If you have it doing it every hour or so, and unbound is taking a long to reload then yeah that can cause problems as well.
-
@johnpoz I don't see unbound restarting in the logs though (except for once a day a few minutes after midnight, and my attempts to fix it today)? Or wouldn't that appear in the logs? In which case is there any way of confirming it's restarting?
I don't think dhcp registration exists anymore since the switch to the new dhcp daemon? There's no option for it in my dns resolver settings in any case. (I'm on 24.03-RELEASE)
pfblockerng is set to its default every hour on the hour setting. I could try changing this to once daily?
I'm running a netgate 2100 by the way.
One more thing: before today it's been at least two weeks since I last touched any settings on the firewall. So something must have changed between then and yesterday evening? The only thing I can think of is the automatic pfblockerng updates...
This is an excerpt from the resolver log (from when I restarted the service during one of my attempts today):
Jun 16 10:09:15 cerberus unbound[35808]: [35808:0] info: server stats for thread 0: 13809 queries, 12938 answers from cache, 871 recursions, 0 prefetch, 0 rejected by ip ratelimiting Jun 16 10:09:15 cerberus unbound[35808]: [35808:0] info: server stats for thread 0: requestlist max 26 avg 11.023 exceeded 0 jostled 0 Jun 16 10:09:15 cerberus unbound[35808]: [35808:0] info: average recursion processing time 10.398178 sec Jun 16 10:09:15 cerberus unbound[35808]: [35808:0] info: histogram of recursion processing times Jun 16 10:09:15 cerberus unbound[35808]: [35808:0] info: [25%]=4.19876 median[50%]=9.51682 [75%]=14.7768 Jun 16 10:09:15 cerberus unbound[35808]: [35808:0] info: lower(secs) upper(secs) recursions Jun 16 10:09:15 cerberus unbound[35808]: [35808:0] info: 0.000000 0.000001 13 Jun 16 10:09:15 cerberus unbound[35808]: [35808:0] info: 0.016384 0.032768 1 Jun 16 10:09:15 cerberus unbound[35808]: [35808:0] info: 0.065536 0.131072 25 Jun 16 10:09:15 cerberus unbound[35808]: [35808:0] info: 0.131072 0.262144 44 Jun 16 10:09:15 cerberus unbound[35808]: [35808:0] info: 0.262144 0.524288 38 Jun 16 10:09:15 cerberus unbound[35808]: [35808:0] info: 1.000000 2.000000 29 Jun 16 10:09:15 cerberus unbound[35808]: [35808:0] info: 2.000000 4.000000 57 Jun 16 10:09:15 cerberus unbound[35808]: [35808:0] info: 4.000000 8.000000 161 Jun 16 10:09:15 cerberus unbound[35808]: [35808:0] info: 8.000000 16.000000 327 Jun 16 10:09:15 cerberus unbound[35808]: [35808:0] info: 16.000000 32.000000 137 Jun 16 10:09:15 cerberus unbound[35808]: [35808:0] info: 32.000000 64.000000 28 Jun 16 10:09:15 cerberus unbound[35808]: [35808:0] info: server stats for thread 1: 13112 queries, 12369 answers from cache, 743 recursions, 0 prefetch, 0 rejected by ip ratelimiting Jun 16 10:09:15 cerberus unbound[35808]: [35808:0] info: server stats for thread 1: requestlist max 26 avg 10.9085 exceeded 0 jostled 0 Jun 16 10:09:15 cerberus unbound[35808]: [35808:0] info: average recursion processing time 12.517736 sec Jun 16 10:09:15 cerberus unbound[35808]: [35808:0] info: histogram of recursion processing times Jun 16 10:09:15 cerberus unbound[35808]: [35808:0] info: [25%]=6.16418 median[50%]=11.1895 [75%]=15.9869 Jun 16 10:09:15 cerberus unbound[35808]: [35808:0] info: lower(secs) upper(secs) recursions Jun 16 10:09:15 cerberus unbound[35808]: [35808:0] info: 0.000000 0.000001 9 Jun 16 10:09:15 cerberus unbound[35808]: [35808:0] info: 0.008192 0.016384 3 Jun 16 10:09:15 cerberus unbound[35808]: [35808:0] info: 0.032768 0.065536 9 Jun 16 10:09:15 cerberus unbound[35808]: [35808:0] info: 1.000000 2.000000 2 Jun 16 10:09:15 cerberus unbound[35808]: [35808:0] info: 2.000000 4.000000 88 Jun 16 10:09:15 cerberus unbound[35808]: [35808:0] info: 4.000000 8.000000 134 Jun 16 10:09:15 cerberus unbound[35808]: [35808:0] info: 8.000000 16.000000 306 Jun 16 10:09:15 cerberus unbound[35808]: [35808:0] info: 16.000000 32.000000 154 Jun 16 10:09:15 cerberus unbound[35808]: [35808:0] info: 32.000000 64.000000 29 Jun 16 10:09:15 cerberus unbound[35808]: [35808:0] info: [pfBlockerNG]: pfb_unbound.py script exiting Jun 16 10:09:18 cerberus unbound[34832]: [34832:0] notice: init module 0: python Jun 16 10:09:19 cerberus unbound[34832]: [34832:0] info: [pfBlockerNG]: pfb_unbound.py script loaded Jun 16 10:09:25 cerberus unbound[34832]: [34832:0] info: [pfBlockerNG]: init_standard script loaded Jun 16 10:09:25 cerberus unbound[34832]: [34832:0] notice: init module 1: iterator Jun 16 10:09:25 cerberus unbound[34832]: [34832:0] info: start of service (unbound 1.19.3). -
@johnpoz said in Extremely slow DNS solved by disabling & re-enabling Python mode (unbound):
If you have it doing it every hour
What is your recommendation for cron job interval?
-
@Antibiotic 12 or 24 hours.. if you schedule it at 24 hours - have it run during the middle of night it shouldn't matter if unbound takes 30 seconds to restart, etc..
Those lists don't update every 2 minutes anyway ;)
-
24 hours ?
No way.
Reloading DNSBL means restarting unbound.
I'm a member of the "don't restart my unbound" club.
Ones a week is good enough for me.Truth is, it happes a bit more often, as I do like to mess around with unbound.
-
@Gertjan very true - it would depend on how much the lists your using might update, but I am not aware of any lists that are constantly updating.. So sure week might be fine as well.. I have mine scheduled for like once a day
-
@bernieke Could be a dns rebind attack. You could try to capture http requests sent to and from unbound.
https://youtu.be/y9-0lICNjOQ?si=61DIfH4BWwwGqGIK
Says that pfSense can have issues
A friend of mine says that some ISPs bad Routing Public Key Infastructure Means people are subject to replay attacks and DNS rebind attacks. And also random interference if someone else out there has the same ipv4 address as you.
Also maybe try running tests on internet.nl see if your dns is encrypting correctly.
https://youtu.be/YKxKnVE5FaE?si=gCvUZ9IOFOVISHf4
Python is weird sometimes too. I do like cins army blocklists on a WAN.
-
Maybe the ISP wants your attention or you to do actual routing with BGP or something. They sometimes downgrade dns
https://youtu.be/jXG8fuJ-fUI?si=zTHyKmZNEy5vlDAC
If you are blocking dns, sometimes the same dns requests will repeat and go all the way around the world until successful.
pfBlocker has sent me to Qatar for google ads while blocking google but using google dns. Plausible too since jitter and whatnot with fq_codel is like zero. You can encrypt DNS extensions and use dns encryption curves and whatnot on some sides of the planet more bearably than others.
1 RSA/MD5 Must Not Implement Must Not Implement
3 DSA/SHA-1 Must Not Implement Must Not2 SHA-256 RFC 4509 Required Required
Also, some dns encryption allows for dnssec and others forbid it. Fiber may employ TR-069 which uses MD5 somewhere and that isn't supposed to show up in dns encryption tests, according to a friend who wrote the internet.nl website.
Their dnssec resolver algorithm test is pretty good.
https://en.m.wikipedia.org/wiki/Domain_Name_System_Security_Extensions
Might be some Big-O stuff I didn't go to school for

-
@HLPPC said in Extremely slow DNS solved by disabling & re-enabling Python mode (unbound):
according to a friend who wrote the internet.nl website.
When you see him next time, show him this :
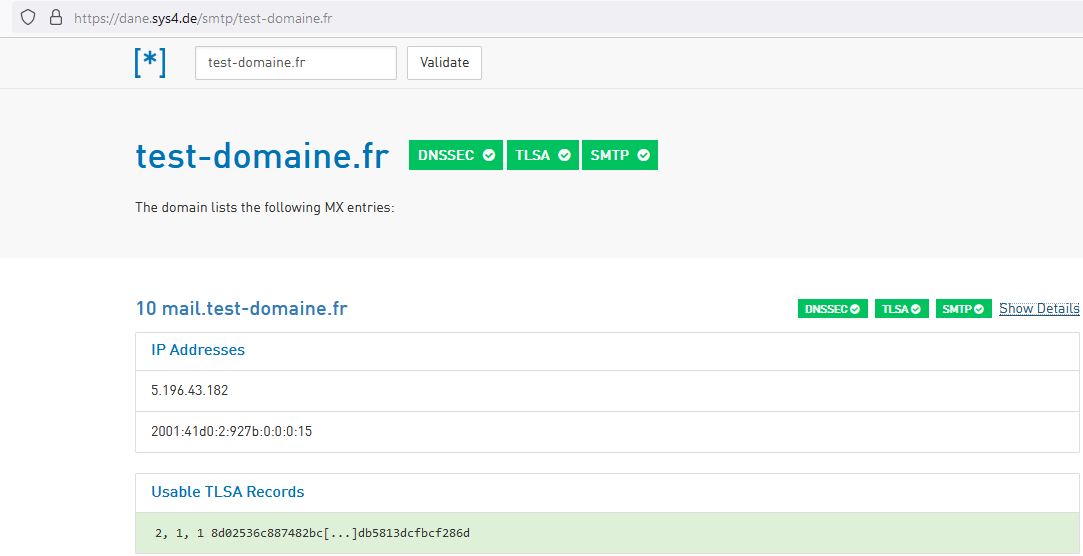
compared to :
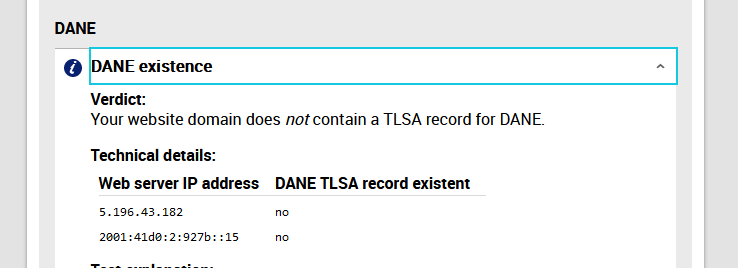
Mails I send to gmail (example) confirm that my domain name, my mail server supports DANE.
This makes me doubt about the "internet.nl" DANE test.@HLPPC said in Extremely slow DNS solved by disabling & re-enabling Python mode (unbound):
Their dnssec resolver algorithm test is pretty good.
Those who implement DNNSEC will probably use :
https://dnsviz.net/ example : https://dnsviz.net/d/test-domaine.fr/dnssec/
https://dnssec-analyzer.verisignlabs.com/as these sites will indicate what is wrong if things are wrong.
@HLPPC said in Extremely slow DNS solved by disabling & re-enabling Python mode (unbound):
Also, some dns encryption allows for dnssec and others forbid it
DNSSEC isn't about encryption ( ≈ making your DNS requests invisible for others ).
They have to not-TLS as the DNS root servers don't support secured DNS (DNS over TLS) yet. And IMHO, it will take sometime before they do, as if all DNS has to go over TLS it would need to "thousand fold" the capacity of each DNS server, root and TLD, as TLS needs way more system resources as plain text small UDP packets.The (your) wiki page :
DNSSEC does not provide confidentiality of data; in particular, all DNSSEC responses are authenticated but not encrypted.
DNSSEC is only about getting the correct answer.
-
The past two days without pfblockerng worked perfectly fine. So I think we can conclude the problem isn't with DNS itself.
As soon as I enable pfblockerng + perform an update, I get the slow resolving. (I didn't realize the update was necessary when debugging this on Sunday, which is why the problem took a while to reappear, it only came after the next update on the hour.)
It's not just related to the update itself either, the problem doesn't go away afterwards, even after multiple hours. So simply changing the schedule to daily / weekly won't help me either.
There was mention of unbound restarts, but looking at the logs and the start time in a "ps aux|grep unbound" this doesn't seem to be the case for me, both indicate the time of my last change.
Disabling DNSBL, and updating again, fixes the problem as well. So clearly the problem is specifically with DNSBL.
I've now been trying to see if it's any specific group of feeds that's causing the problem.
The first step was enabling DNSBL with all groups disabled.
This was stable.I then tried enabling groups one by one. But what I'm seeing is that the problem starts occurring at some point (not immediately after the update though, so it's unclear as of now which (if any) group might be the cause), but simply disabling groups and updating won't make it go away afterwards either (even if I disable all the groups), until I actually disable DNSBL altogether! So it seems something is getting stuck on the unbound side? Maybe the cache which I see mention of being restored after the unbound restart?I'll continue trying to play with enabling groups of feeds to see if I can further pinpoint the problem (but this time with DNSBL disables / enables in between the changes). Although I'm starting to think it's not with any specific feed, but rather something (cache?) which keeps being added to instead of replacing / updating...EDIT: It just happened with all groups disabled as well.
-
The ambient temperature with my ISP's equipment has to be like, 180 degrees F (82 C) right now. I wonder if that matters with dns and weird retransmissions.
-
@bernieke said in Extremely slow DNS solved by disabling & re-enabling Python mode (unbound):
There was mention of unbound restarts, but looking at the logs and the start time in a "ps aux|grep unbound" this doesn't seem to be the case for me, both indicate the time of my last change.
Use this to get start (and thus stop) moments :
grep 'start' /var/log/resolver.logYour stats :
@bernieke said in Extremely slow DNS solved by disabling & re-enabling Python mode (unbound):
Jun 16 10:09:15 cerberus unbound[35808]: [35808:0] info: average recursion processing time 12.517736 sec
@bernieke said in Extremely slow DNS solved by disabling & re-enabling Python mode (unbound):
Jun 16 10:09:15 cerberus unbound[35808]: [35808:0] info: average recursion processing time 10.398178 sec
These two are the times it takes for a resolve process : get in contact with a root server (maybe already cached), then a TLD (may be already cached) and then a domain name server for an, example, A record.
These times are huge !Just to be sure : these two, do they become way faster when there is not 'pfBlockerng' ?
or 'pfBlockerng' but no 'DNSBL' ?
Btw : python mode was introduced so 'plugins' or 'packages' or 'add-ons' could be written for unbound. Doing 'DNSBL' is just one of the possibilities = comparing the requested host name with a big list.Typically, I see :
total.recursion.time.avg=0.128068Which is still a whopping 128 msec
How big is your main DNSBL list ?
The list is stored in /var/unbound/pfb_py_hsts.txt ( I guess ).
Btw : you can see stats all the time with :
unbound-control -c /var/unbound/unbound.conf stats -
@Gertjan said in Extremely slow DNS solved by disabling & re-enabling Python mode (unbound):
Use this to get start (and thus stop) moments :
grep 'start' /var/log/resolver.logNo starts except for the ones I initiated.
Your stats :
These times are huge !Just to be sure : these two, do they become way faster when there is not 'pfBlockerng' ?
or 'pfBlockerng' but no 'DNSBL' ?This is with pfblockerng enabled and DNSBL disabled:
thread0.recursion.time.avg=0.031121
thread0.recursion.time.median=0.0216847
thread1.recursion.time.avg=0.027506
thread1.recursion.time.median=0.015819
total.recursion.time.avg=0.029363
total.recursion.time.median=0.0187519
How big is your main DNSBL list ?
It happens even with all the groups disabled, just having DSNBL enabled is sufficient (or, I guess, more correctly: having the unbound python module enabled?):
 UPDATE PROCESS START [ v3.2.0_10 ] [ 06/19/24 08:38:02 ]

===[  DNSBL Process  ]================================================

 Loading DNSBL Statistics... completed
 Missing DNSBL stats and/or Unbound DNSBL files - Rebuilding

 Loading DNSBL SafeSearch... enabled
 Loading DNSBL Whitelist... completed
 Loading TOP1M Whitelist... completed

Clearing all DNSBL Feeds
Added DNSBL Unbound python integration settings
Adding DNSBL Unbound python mounts:
  Creating: /var/unbound/usr/local/bin
  Mounting: /usr/local/bin
  Creating: /var/unbound/usr/local/lib
  Mounting: /usr/local/lib

DNS Resolver ( enabled ) unbound.conf modifications:
  Added DNSBL Unbound Python mode
  Added DNSBL Unbound Python mode script

VIP address(es) configured
Restarting DNSBL Service

TLD Analysis not required.
Stopping Unbound Resolver
Unbound stopped in 1 sec.
Additional mounts (DNSBL python):
   Mounting: /dev
Starting Unbound Resolver... completed [ 06/19/24 08:38:22 ]
Restarting DNSBL Service (DNSBL python)
DNSBL update [ 0 | PASSED  ]... completed
------------------------------------------------------------------------

===[  GeoIP Process  ]============================================


===[  IPv4 Process  ]=================================================

[ Amazon_AWS_v4 ]		 exists.
[ Atlassian_v4 ]		 exists.
[ Cloudflare_v4 ]		 exists.
[ GitHub_v4 ]			 exists.
[ Google_v4 ]			 exists.
[ Office_365_v4 ]		 exists.
[ Zendesk_v4 ]			 exists.
[ Abuse_Feodo_C2_v4 ]		 exists.
[ Abuse_SSLBL_v4 ]		 exists.
[ CINS_army_v4 ]		 exists.
[ ET_Block_v4 ]			 exists.
[ ET_Comp_v4 ]			 exists.
[ ISC_Block_v4 ]		 exists.
[ Spamhaus_Drop_v4 ]		 exists.
[ Spamhaus_eDrop_v4 ]		 exists.
[ Talos_BL_v4 ]			 exists.
[ MS_1_v4 ]			 exists.

===[  IPv6 Process  ]=================================================

[ Amazon_AWS_v6 ]		 exists.
[ Atlassian_v6 ]		 exists.
[ Cloudflare_v6 ]		 exists.
[ GitHub_v6 ]			 exists.
[ Google_v6 ]			 exists.
[ Office_365_v6 ]		 exists.

===[  Aliastables / Rules  ]==========================================

No changes to Firewall rules, skipping Filter Reload
No Changes to Aliases, Skipping pfctl Update


** Restarting firewall filter daemon **

 UPDATE PROCESS ENDED [ 06/19/24 08:38:32 ]
I just now tested this again, and I got timeout errors five minutes after enabling DSNBL without any feeds.
These are the unbound stats when the problem is occuring (note that getting these stats took a few seconds as well, while with DNSBL disabled they are immediate):
thread0.num.queries=86937 thread0.num.queries_ip_ratelimited=0 thread0.num.queries_cookie_valid=0 thread0.num.queries_cookie_client=0 thread0.num.queries_cookie_invalid=0 thread0.num.cachehits=83450 thread0.num.cachemiss=3487 thread0.num.prefetch=0 thread0.num.queries_timed_out=0 thread0.query.queue_time_us.max=0 thread0.num.expired=0 thread0.num.recursivereplies=3485 thread0.num.dnscrypt.crypted=0 thread0.num.dnscrypt.cert=0 thread0.num.dnscrypt.cleartext=0 thread0.num.dnscrypt.malformed=0 thread0.requestlist.avg=7.79036 thread0.requestlist.max=27 thread0.requestlist.overwritten=0 thread0.requestlist.exceeded=0 thread0.requestlist.current.all=2 thread0.requestlist.current.user=2 thread0.recursion.time.avg=10.313877 thread0.recursion.time.median=9.76303 thread0.tcpusage=0 thread1.num.queries=84599 thread1.num.queries_ip_ratelimited=0 thread1.num.queries_cookie_valid=0 thread1.num.queries_cookie_client=0 thread1.num.queries_cookie_invalid=0 thread1.num.cachehits=81243 thread1.num.cachemiss=3356 thread1.num.prefetch=0 thread1.num.queries_timed_out=0 thread1.query.queue_time_us.max=0 thread1.num.expired=0 thread1.num.recursivereplies=3355 thread1.num.dnscrypt.crypted=0 thread1.num.dnscrypt.cert=0 thread1.num.dnscrypt.cleartext=0 thread1.num.dnscrypt.malformed=0 thread1.requestlist.avg=8.15435 thread1.requestlist.max=22 thread1.requestlist.overwritten=0 thread1.requestlist.exceeded=0 thread1.requestlist.current.all=1 thread1.requestlist.current.user=1 thread1.recursion.time.avg=11.145005 thread1.recursion.time.median=10.6155 thread1.tcpusage=0 total.num.queries=171536 total.num.queries_ip_ratelimited=0 total.num.queries_cookie_valid=0 total.num.queries_cookie_client=0 total.num.queries_cookie_invalid=0 total.num.cachehits=164693 total.num.cachemiss=6843 total.num.prefetch=0 total.num.queries_timed_out=0 total.query.queue_time_us.max=0 total.num.expired=0 total.num.recursivereplies=6840 total.num.dnscrypt.crypted=0 total.num.dnscrypt.cert=0 total.num.dnscrypt.cleartext=0 total.num.dnscrypt.malformed=0 total.requestlist.avg=7.96887 total.requestlist.max=27 total.requestlist.overwritten=0 total.requestlist.exceeded=0 total.requestlist.current.all=3 total.requestlist.current.user=3 total.recursion.time.avg=10.721543 total.recursion.time.median=10.1893 total.tcpusage=0 time.now=1718782293.781636 time.up=3192.962215 time.elapsed=3192.962215 mem.cache.rrset=292578 mem.cache.message=309466 mem.mod.iterator=16716 mem.mod.validator=0 mem.mod.respip=0 mem.cache.dnscrypt_shared_secret=0 mem.cache.dnscrypt_nonce=0 mem.mod.dynlibmod=0 mem.streamwait=0 mem.http.query_buffer=0 mem.http.response_buffer=0 histogram.000000.000000.to.000000.000001=41 histogram.000000.000001.to.000000.000002=0 histogram.000000.000002.to.000000.000004=0 histogram.000000.000004.to.000000.000008=0 histogram.000000.000008.to.000000.000016=0 histogram.000000.000016.to.000000.000032=0 histogram.000000.000032.to.000000.000064=0 histogram.000000.000064.to.000000.000128=0 histogram.000000.000128.to.000000.000256=0 histogram.000000.000256.to.000000.000512=0 histogram.000000.000512.to.000000.001024=0 histogram.000000.001024.to.000000.002048=0 histogram.000000.002048.to.000000.004096=0 histogram.000000.004096.to.000000.008192=2 histogram.000000.008192.to.000000.016384=79 histogram.000000.016384.to.000000.032768=57 histogram.000000.032768.to.000000.065536=50 histogram.000000.065536.to.000000.131072=34 histogram.000000.131072.to.000000.262144=5 histogram.000000.262144.to.000000.524288=75 histogram.000000.524288.to.000001.000000=92 histogram.000001.000000.to.000002.000000=252 histogram.000002.000000.to.000004.000000=676 histogram.000004.000000.to.000008.000000=1229 histogram.000008.000000.to.000016.000000=3014 histogram.000016.000000.to.000032.000000=1054 histogram.000032.000000.to.000064.000000=177 histogram.000064.000000.to.000128.000000=3 histogram.000128.000000.to.000256.000000=0 histogram.000256.000000.to.000512.000000=0 histogram.000512.000000.to.001024.000000=0 histogram.001024.000000.to.002048.000000=0 histogram.002048.000000.to.004096.000000=0 histogram.004096.000000.to.008192.000000=0 histogram.008192.000000.to.016384.000000=0 histogram.016384.000000.to.032768.000000=0 histogram.032768.000000.to.065536.000000=0 histogram.065536.000000.to.131072.000000=0 histogram.131072.000000.to.262144.000000=0 histogram.262144.000000.to.524288.000000=0 num.query.type.A=9419 num.query.type.PTR=8 num.query.type.AAAA=161889 num.query.type.SRV=28 num.query.type.HTTPS=192 num.query.class.IN=171536 num.query.opcode.QUERY=171536 num.query.tcp=136 num.query.tcpout=0 num.query.udpout=4380 num.query.tls=0 num.query.tls.resume=0 num.query.ipv6=0 num.query.https=0 num.query.flags.QR=0 num.query.flags.AA=0 num.query.flags.TC=0 num.query.flags.RD=171536 num.query.flags.RA=0 num.query.flags.Z=0 num.query.flags.AD=25 num.query.flags.CD=0 num.query.edns.present=161685 num.query.edns.DO=0 num.answer.rcode.NOERROR=82178 num.answer.rcode.FORMERR=0 num.answer.rcode.SERVFAIL=0 num.answer.rcode.NXDOMAIN=89355 num.answer.rcode.NOTIMPL=0 num.answer.rcode.REFUSED=0 num.answer.rcode.nodata=72787 num.query.ratelimited=0 num.answer.secure=0 num.answer.bogus=0 num.rrset.bogus=0 num.query.aggressive.NOERROR=0 num.query.aggressive.NXDOMAIN=0 unwanted.queries=0 unwanted.replies=0 msg.cache.count=1096 rrset.cache.count=977 infra.cache.count=2 key.cache.count=0 msg.cache.max_collisions=4 rrset.cache.max_collisions=3 dnscrypt_shared_secret.cache.count=0 dnscrypt_nonce.cache.count=0 num.query.dnscrypt.shared_secret.cachemiss=0 num.query.dnscrypt.replay=0 num.query.authzone.up=0 num.query.authzone.down=0 -
Ok.
Hummmm.
That info doesn't look suspicious at all.How do you use your IP feeds ? Are they used so you, pfSense, and your LAN devices, can't connect to them ?
I mean, if these lists contains also DNS domain name servers, then that's a shoot in the foot situation.So, what about the other way around :
Use some DNSBL lists,
but no IP lists (or have these list block for inbound only, not outbound, which will make them useless, as per default WAN rules, all inbound is already blocked anyway). -
@Gertjan This was all working fine up to Saturday evening.
I'm not sure what you're asking concerning the IP feeds, this is what I have configured for them:

I think it's a pretty standard setup.I've just tried the following:
- enable DSNBL in unbound (non-python) mode, with full reload: works fine
- changed to python mode, with full reload: immediately have the problem again (30+% cpu usage of unbound, very slow recursion time with lots of time outs)
- changed back to non-python mode, with full reload: works fine (and again only 3% unbound cpu usage)
So it seems the issue is pretty clearly with the python module? Unless you think the IP feeds could have a different effect in the unbound vs unbound-python module?
The only thing I'm seeing with the non-python mode is an unbound-control 100% cpu spike every few seconds, but that's not hurting my dns resolution in any way:
total.recursion.time.avg=0.031341I switched to python mode a few weeks back since I needed to exclude our chromecast from the filtering, as some apps from the local broadcast networks wouldn't work otherwise.
I think I'm going to have a look at pi-hole or adguard home, and kick out pfblockerng altogether...
-
@bernieke said in Extremely slow DNS solved by disabling & re-enabling Python mode (unbound):
I'm not sure what you're asking concerning the IP feeds,
How you use your listed IP feeds.
If some of them are outbound blocking
and
the list contains DNS servers you use
then ... well, that's problematic.@bernieke said in Extremely slow DNS solved by disabling & re-enabling Python mode (unbound):
So it seems the issue is pretty clearly with the python module?
I get what you mean.
But the thing is : not every pfSense user (a million or so ?) has pfBlockerng installed.
But some, a couple of hundred thousands ( ? ) do use this pfSense package, I'm just one of them.
We al have this single file in common. That's the "python module" file, ever-body is using that file. No other files are involved.
=> compare that file with yours.
Of course, there could be a bug. A bug you hit, and "no one" else... and that's why it way more plausible that it's a config (local setup) issue.
The question is : which one.Btw : I'm using a 4100 with pfSense Plus 24.03, like you..
Only difference : you have a arm, I have a x86. -
Maybe unbound and pfblocker should be set up before your cloud software and everything else. Immutable data types were just mentioned on youtube. I had to have a crack at threads misbehaving. You do have cache misses. Also you only have 4 gigs of memory.
Last time I ran wildcards in pfBlocker with it maxed out (and with Suicata maxed out) I ended up chewing through over 32 gigs of ram and halfway into a swap. With and without the python part it was and with and without suricata, it still took loads of memory.