WAN periodically Rebooting
-
You can copy off or download the compressed log files if they still exist. You have to be logged in to do that so there's no real security issue IMO.
I would have expected to see that LCP echo reply error in the logs we looked at earlier. That's usually pretty close in the logs. But I guess it's possible.
-
@stephenw10 Just looking at getting the log files off pfsense,.. and noticed log files are all the same date,.. so old logs have been cycled out,..
Only after the point when I increased log file size do I have events,...
Just waiting for the next log rotation,...-rw------- 1 root wheel 161270661 Aug 19 08:39 ppp.log -rw------- 1 root wheel 4599 Aug 17 13:06 ppp.log.0.bz2 -
@diyhouse :update---
Nearly 2.5days of continuous running since last WAN reboot..But did get this crash log today..
Crash report begins.  Anonymous machine information:

amd64
14.0-CURRENT
FreeBSD 14.0-CURRENT amd64 1400094 #1 RELENG_2_7_2-n255948-8d2b56da39c: Wed Dec  6 20:45:47 UTC 2023     root@freebsd:/var/jenkins/workspace/pfSense-CE-snapshots-2_7_2-main/obj/amd64/StdASW5b/var/jenkins/workspace/pfSense-CE-snapshots-2_7_2-main/sources/F

Crash report details:

PHP Errors:
[20-Aug-2024 13:52:51 Europe/London] PHP Fatal error:  Uncaught ValueError: date_create_from_format(): Argument #2 ($datetime) must not contain any null bytes in /usr/local/www/widgets/widgets/suricata_alerts.widget.php:188
Stack trace:
#0 /usr/local/www/widgets/widgets/suricata_alerts.widget.php(188): date_create_from_format('m/d/Y-H:i:s.u', '\x00\x00\x00\x00\x00\x00\x00\x00\x00\x00\x00\x00\x00\x00\x00...')
#1 /usr/local/www/widgets/widgets/suricata_alerts.widget.php(78): suricata_widget_get_alerts()
#2 {main}
  thrown in /usr/local/www/widgets/widgets/suricata_alerts.widget.php on line 188

No FreeBSD crash data found.
Unrelated,.. ( I assume ) but just in case for info..
Tx -
Hmm, yes that seems unrelated. Though odd, I've not seen that before. Is that the first time you've seen that.
-
@stephenw10
yes... (And now 2days 18hrs 44Mins...)
Edit 5pm 22nd Aug: Uptime: 4d 01:52:12...
Edit 5pm 23rd Aug: Uptime: 5d 02:32:21and the log files sizes as follows,.. I would have hoped they would have been rotated by now... as they are getting quite large, even for a text file..
-rw------- 1 root wheel 67068 Aug 22 04:13 dhcpd.log.0.bz2 -rw------- 1 root wheel 69926 Aug 23 16:57 ntpd.log -rw------- 1 root wheel 118511 Aug 23 00:24 gateways.log -rw-r--r-- 1 root wheel 135309 Sep 6 2020 bsdinstall_log -rw------- 1 root wheel 511488 Sep 6 2020 relayd.log -rw------- 1 root wheel 1184280 Aug 23 17:35 dhcpd.log -rw------- 1 root wheel 33500421 Aug 23 17:36 nginx.log -rw------- 1 root wheel 74443513 Aug 23 17:36 filter.log -rw------- 1 root wheel 551582783 Aug 23 17:36 ppp.log -rw------- 1 root wheel 551721292 Aug 23 17:36 system.log -
Mmm, I would certainly expect that. The default log size is 512KB. Did you change it to something much larger?
Having said that perhaps Openreach finally realised there was a problem and fixed it. Whenever I've had issues it was always a failing line card upstream.
-
@stephenw10 said in WAN periodically Rebooting:
Did you change it to something much larger?
Yes,.. to 2000000000 bytes... like 2gig..
I have now dropped it a power of 10,.. to 200,000,000 bytes...I to was wondering if BT had got wise to my troubles and changed something upstream of my modem...
But we shall see..I will leave the high logging in place for now... ( lets see if I can get to 10days...) then I will revert back,.. and see what happens.
Funny,.. things may have changed since I contacted BT,.. for account and passwd,. maybe an issue was raised,.. and something changed,.. but who knows..
I cat 'top' in a shell.. and see it is busy compressing,..-rw------- 1 root wheel 4599 Aug 17 13:06 ppp.log.1.bz2 -rw------- 1 root wheel 635473 Aug 23 20:46 ppp.log -rw------- 1 root wheel 16623975 Aug 23 20:36 ppp.log.0.bz2 -
@diyhouse
One question I have,.. whilst in 'limbo'... the logs generated, have lots of the following;Aug 25 09:22:30 ppp 67004 [wan] OUT util: total 29% 12% 61% 36% 6% 29% 27% Aug 25 09:22:30 ppp 67004 [wan] IN util: total 625% 21% 2280% 1205% 108% 22% 111%Are you able to spread any light on what the % values mean,...
Many tx
uptime currently running at 6d 18hrs -
Not really. I've never tried turning up the logs to 11 like that before.

Edit: Appears to be the calculated bandwidth utilization:
https://sourceforge.net/p/mpd/svn/HEAD/tree/tags/RELEASE_5_9/src/bund.c#l1620Not sure how applicable that is to PPPoE. Clearly it isn't actually pushing > 2000% of the available upload!
-
@stephenw10 Well I got to 9 days,.. and a bit,.. and WAN has fallen over,...
Looks similar to before,.. but I will leave it for you to pass definitive comment on the details..
KR -
Hmm, that's not the same. It looks like something local called the interface down:
(reversed)Aug 27 20:14:57 ppp 67004 [wan_link0] Link: DOWN event Aug 27 20:14:57 ppp 67004 [wan_link0] device: DOWN event Aug 27 20:14:57 ppp 67004 [wan_link0] PPPoE: connection closed Aug 27 20:14:57 ppp 67004 EVENT: Processing event EVENT_READ PppoeCtrlReadEvent()Is that the full system log or just the ppp log? Anything else logged if it's the latter?
-
@stephenw10
Tried to access logs.. but they have now gone,.. compressed I suspect
But subsequently I have had another failure of the WAN around 2:25pm today
Have tried to apply a time filter as followsAug 28 14:2[1-8]But this does not present anything to display, even when set to 17:2[1-8]
Also suspect php is struggling with the large GUI no. of lines,.. as it does seem to take a long time..Have looked at the /etc/group file,.. and considering adding my user to the wheel group so I can at least copy and vi the log file... Yes I'm ok with vi..
then I can at least look further back at the compressed files...
Is this a BAD idea...? -
Probably fine. Or just login as admin which should have root access to everything.
-
@stephenw10 durr,.. I assumed admin was a restricted account..
Hey now were cookin,.. so much easier as root
it seems on quick glance things started failing much sooner...
does this log file help,.. ??and BTW,,. I also have another one of these
PHP errors PHP ERROR: Type: 1, File: /usr/local/www/widgets/widgets/suricata_alerts.widget.php, Line: 188, Message: Uncaught ValueError: date_create_from_format(): Argument #2 ($datetime) must not contain any null bytes in /usr/local/www/widgets/widgets/suricata_alerts.widget.php:188 Stack trace: #0 /usr/local/www/widgets/widgets/suricata_alerts.widget.php(188): date_create_from_format('m/d/Y-H:i:s.u', '\x00\x00\x00\x00\x00\x00\x00\x00\x00\x00\x00\x00\x00\x00\x00...') #1 /usr/local/www/widgets/widgets/suricata_alerts.widget.php(78): suricata_widget_get_alerts() #2 {main} thrown @ 2024-08-20 13:52:51 -
Not seeing any issues in that log. It only covers 30s though. You can see it receiving and sending LCP echos.
-
@stephenw10
Sorry,.. I thought the stuff at the start was the initial falling over of the WANThis certainly has the WAN falling over and restarting
-
Right. Same as before. It processes the timer events every second. But at 14:23:21 it sees a new event:
Aug 28 14:23:21 pfSense ppp[67004]: EVENT: Processing event EVENT_READ PppoeCtrlReadEvent()
Aug 28 14:23:21 pfSense ppp[67004]: [wan_link0] PPPoE: connection closed
Aug 28 14:23:21 pfSense ppp[67004]: [wan_link0] device: DOWN event
Aug 28 14:23:21 pfSense ppp[67004]: [wan_link0] Link: DOWN event
Aug 28 14:23:21 pfSense ppp[67004]: EVENT: Starting timer "PhysOpen" LinkReopenTimeout() for 3000 ms at link.c:313
Aug 28 14:23:21 pfSense ppp[67004]: EVENT: Registering event EVENT_TIMEOUT TimerExpires() at timer.c:50
Aug 28 14:23:21 pfSense ppp[67004]: EVENT: Registering event EVENT_TIMEOUT TimerExpires() done at timer.c:50
Aug 28 14:23:21 pfSense ppp[67004]: [wan_link0] LCP: Down event
Aug 28 14:23:21 pfSense ppp[67004]: [wan_link0] LCP: state change Opened --> Starting
Aug 28 14:23:21 pfSense ppp[67004]: [wan_link0] LCP: phase shift NETWORK --> DEAD
Aug 28 14:23:21 pfSense ppp[67004]: [wan_link0] Link: Leave bundle "wan"
...
Something appears to be actively closing the connection. But I have no idea what that might be.
I don't suppose you have ever set dial-on-demand or an idle timeout on that ppp config? Not that it appeared to be idle before that happened.
-
@stephenw10
Steve,.. vi'd a copy of the ppp.log file.. (950k lines ) and did a search onLinkReopenTimeoutand 'word-count' to my dismay I have found 27 occurrences in the last couple of days...
where would I set,..
idle timeout on that ppp configNot that I recall ever setting one,.. as it would not have made sense to me,.. I would have selected a continuous connection,.. power usage is / was minimal...
But,.. where would I set one if required?Just a thought,.. could this be temperature related,.. it is approx, 30C in my loft currently..
-
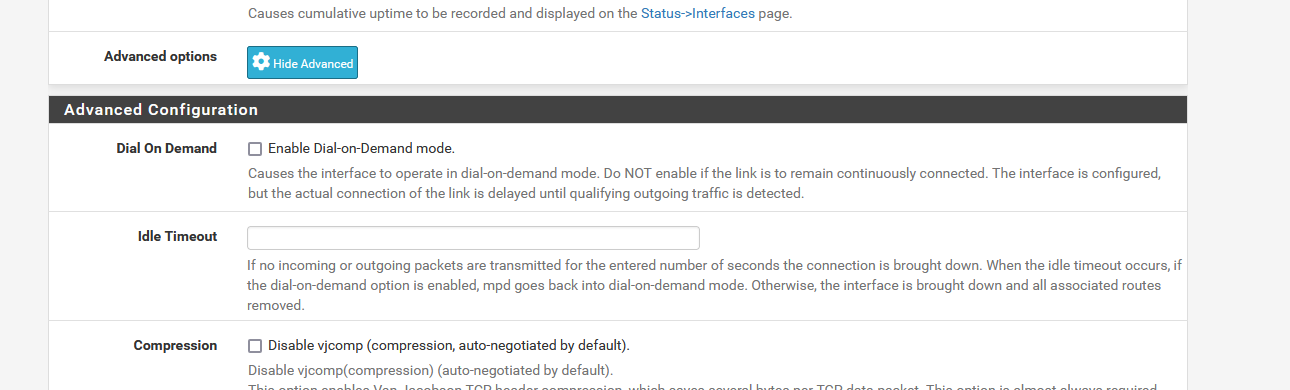
@diyhouse said in WAN periodically Rebooting:
But,.. where would I set one if required?
Under Advanced Option :
-
@Gertjan Thanks for the hint.. found it..
I can confirm all options under advanced are 'not ticked'
However, . 'configure NULL service' is enabled in the 'ppp config', and the associated field is blank,. if that means anything??
and periodic reset is disabled, and link type is PPPoE..And I now have another one of these crash logs
Crash report begins.  Anonymous machine information:

amd64
14.0-CURRENT
FreeBSD 14.0-CURRENT amd64 1400094 #1 RELENG_2_7_2-n255948-8d2b56da39c: Wed Dec  6 20:45:47 UTC 2023     root@freebsd:/var/jenkins/workspace/pfSense-CE-snapshots-2_7_2-main/obj/amd64/StdASW5b/var/jenkins/workspace/pfSense-CE-snapshots-2_7_2-main/sources/F

Crash report details:

PHP Errors:
[29-Aug-2024 16:18:41 Europe/London] PHP Fatal error:  Uncaught ValueError: date_create_from_format(): Argument #2 ($datetime) must not contain any null bytes in /usr/local/www/widgets/widgets/suricata_alerts.widget.php:188
Stack trace:
#0 /usr/local/www/widgets/widgets/suricata_alerts.widget.php(188): date_create_from_format('m/d/Y-H:i:s.u', '\x00\x00\x00\x00\x00\x00\x00\x00\x00\x00\x00\x00\x00\x00\x00...')
#1 /usr/local/www/widgets/widgets/suricata_alerts.widget.php(78): suricata_widget_get_alerts()
#2 {main}
  thrown in /usr/local/www/widgets/widgets/suricata_alerts.widget.php on line 188


No FreeBSD crash data found.