SG-1100: unexpexcted reboots and vm_fault in logs - how to diagnose?
-
@stephenw10 That's all I see. Should I look somewhere else to get details?
-
Do you have SWAP enabled? RAM disks?
Is it exhausting the RAM? Disk full?
-
@stephenw10 Thank you for your inputs, but can you advise on where to check this?
All I did was set it up a few weeks ago with the latest image (had to install via console) and ZFS enabled. Then I enabled pfblockerng (added some feeds) and that's it.
I am happy to check everything, but need to know where :) (Sorry for the pfsense newbie questions)
From the dashboard, RAM + disks do not look full:
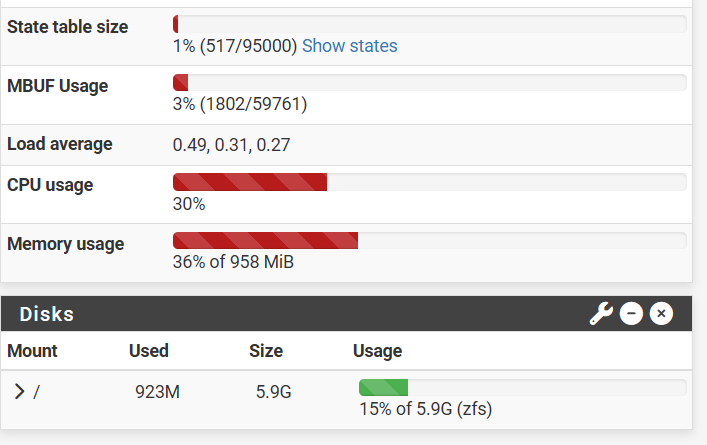
-
Yup that looks fine. Also no SWAP. That does mean no crash reports though.
How often is this happening? One option here would be to connect to the console and leave a client there logging the output when it crashes.
-
@stephenw10 difficult to say - i only notice it if it reboots while I am working. It can be between 1-2 a day but it could also be that it runs fine for a few days (right now it's been up for 1 day 5 hours).
Leaving a client on is not as easy, since I mainly have laptopts which are in use (my own + my wifes work laptop). Which logs would I look at?
Is there a way to retain the logs for more time?If possible I could attach a USB stick and set some verbose logging to that destination?
An additional note: while looking at the log files, one file stuck out where the last time modified was around when the last reboot happened. These are the contents of gateways.log:
Sep 21 16:10:51 pfSense dpinger[76975]: WAN_DHCP 100.82.0.1: sendto error: 65 Sep 21 16:10:51 pfSense dpinger[76975]: WAN_DHCP 100.82.0.1: sendto error: 65 Sep 21 16:10:52 pfSense dpinger[76975]: WAN_DHCP 100.82.0.1: sendto error: 65 Sep 21 16:10:52 pfSense dpinger[76975]: WAN_DHCP 100.82.0.1: sendto error: 65 Sep 21 16:10:53 pfSense dpinger[76975]: WAN_DHCP 100.82.0.1: sendto error: 65 Sep 21 16:10:53 pfSense dpinger[76975]: WAN_DHCP 100.82.0.1: sendto error: 65 Sep 21 16:10:54 pfSense dpinger[76975]: WAN_DHCP 100.82.0.1: sendto error: 65 Sep 21 16:10:54 pfSense dpinger[76975]: WAN_DHCP 100.82.0.1: sendto error: 65 Sep 21 16:10:55 pfSense dpinger[76975]: WAN_DHCP 100.82.0.1: sendto error: 65 Sep 21 16:10:55 pfSense dpinger[76975]: WAN_DHCP 100.82.0.1: sendto error: 65 Sep 21 16:10:56 pfSense dpinger[76975]: WAN_DHCP 100.82.0.1: sendto error: 65 Sep 21 16:10:56 pfSense dpinger[76975]: WAN_DHCP 100.82.0.1: sendto error: 65 Sep 21 16:10:57 pfSense dpinger[76975]: WAN_DHCP 100.82.0.1: sendto error: 65 Sep 21 16:11:15 pfSense dpinger[76975]: exiting on signal 15 Sep 21 16:11:15 pfSense dpinger[81909]: send_interval 500ms loss_interval 2000ms time_period 60000ms report_interval 0ms data_len 1 alert_interval 1000ms latency_alarm 500ms loss_alarm 20% alarm_hold 10000ms dest_addr 100.82.0.1 bind_addr 100.82.196.79 identifier "WAN_DHCP " -
That just looks like the WAN went down. It shouldn't have caused a crash.
The logging does not capture kernel panic / crash because at that point logging stops. So it doesn't matter how verbose that is set.
If there is SWAP present the device will save the crash report there before rebooting.
So if you cannot leave a device hooked to the console to capture the crash you may be able to add a SWAP partition on a USB drive.
-
@stephenw10 could you detail the steps for the options above?
What would I need to do for console logging? Just connect a client via USB and open a terminal connection or should I do anything specific?
For adding a swap partition on a USB drive I couldn't find any instructions, so unless you can help here I'll try to get hold of an old laptop to connect to the console.
-
Yes, potentially just connect to the console and leave the window open. If you're using putty, for example, you can enable logging and it will store everything in a file. Otherwise you'd have to scroll back through after the crash to see the panic output. Other terminal applications may also log output in different ways.
There are a few variables required to add swap on USB. Some instructions can be found here: https://forum.netgate.com/post/1127502
You don't need to set/etc/pfSense-ddb.confjust to get the normal crash dump.Steve
-
@stephenw10 I had a thought: before going through the hassle of doing what you suggested, I googled again and this time I stumbled on an old post. (see mailing list archive)
So, I did what it said, rebooted and I don't have the errors anymore in the logs (at least not in the last 5-10 minutes ;-)). I will monitor if the reboots still occur.
For the time being, if anybody stumbles on this:
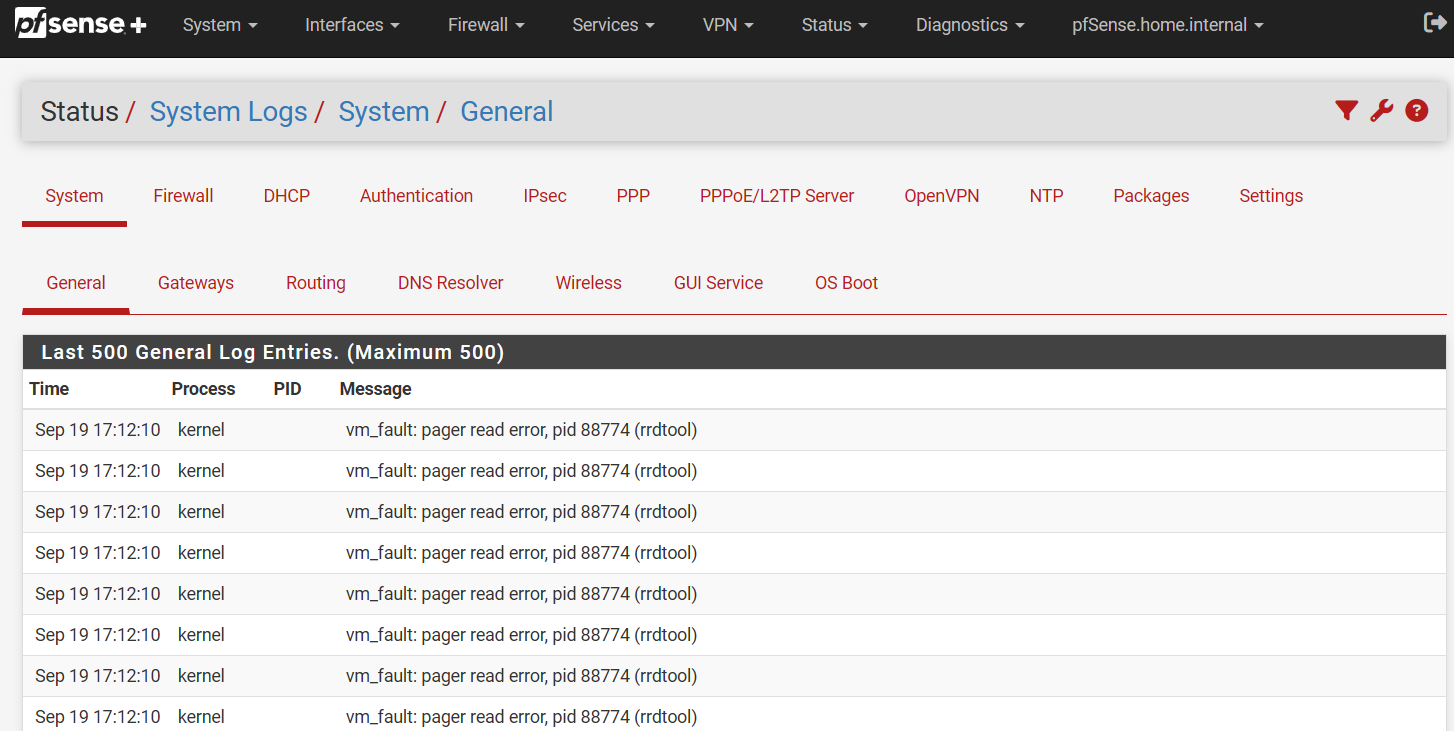
Symptoms:
- system logs filled with LOTS of (some 20-30 entries per minute)
Sep 28 09:29:19 kernel vm_fault: pager read error, pid 44821 (rrdtool) Sep 28 09:29:19 kernel vm_fault: pager read error, pid 44821 (rrdtool) Sep 28 09:29:19 kernel vm_fault: pager read error, pid 44821 (rrdtool) Sep 28 09:29:19 kernel vm_fault: pager read error, pid 44821 (rrdtool) Sep 28 09:29:19 kernel vm_fault: pager read error, pid 44821 (rrdtool) Sep 28 09:29:19 kernel pid 44821 (rrdtool), jid 0, uid 0: exited on signal 10 (core dumped)- irregular reboots (between 2-3 times a day and every few days)
What I did:
rm -rf /var/db/rrd/*- go to the UI in interfaces -> LAN and save + apply
- reboot
-
Hmm, interesting. Let us know how it goes.

I could see bad rrd data files causing the rrdtool core dump but that shouldn't cause the whole firewall to crash. Normally.
-
@stephenw10 I had a reboot this night - so it seems I have to go the console way...
One thing that happened this time is that it was close to when pfblockerng updates its list. Since the other reboots happened any time during day I don't think it's connected.What I don't really understand though is that pfblockerNG seemed to continue updating during reboot.
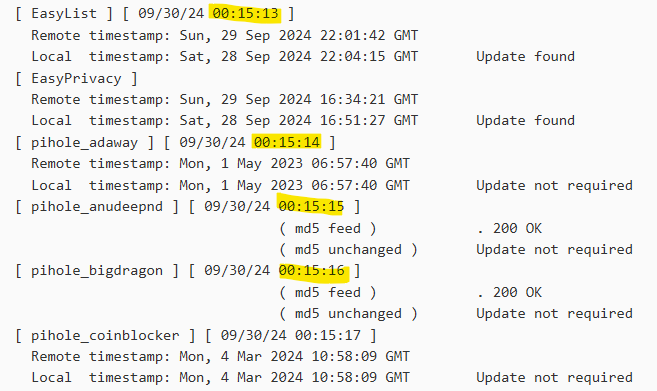
pfBlockerNG logs (cron start was at 00:15:00 and update took about 2 minutes - so exactly during reboot):
System logs
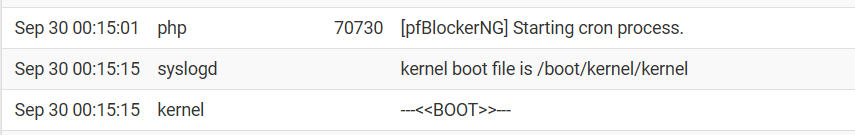
-
Hmm, odd. Though I'm not sure 2 seconds could confirm that.
Also note the pfBlocker logs are GMT not BST.
-
@stephenw10 could you explain the timezone remark?
I see the file timestamps are marked as GMT. For the times I highlighted I expeted them to be in the same timezone as the system log entries. Is that not the case?If not is there a way to set the timezone to use somewhere? (preferably for all logs, but either for the system logs or for pfblockerNG would already help)
In my case I configured pfBlockerNG to run a daily update at 00:15:00 (so that time matches my local timezone). If I assume that the system logs also use my local time zone (which seems to be the case), those entries would indeed be in the same timeframe.
-
Yes, I expect them to be the same but since we are currently in summer time it seemed suspect. Especially as my own logs are in local time, which is BST for me, but that is not included in the pfblocker log.
What version are you using?
-
@stephenw10 I just learned that I need to update pfblockerNG manually. I updated it to the latest devel version (3.2.0_17)
-
@stephenw10 I managed to have a device attached to the USB console while it crashed. Could you give me a hint on where the dump starts and where it ends?
before the boot logs I see a lot of these:
Tracing command dhclient pid 50093 tid 100224 td 0xffff00009cab5640 sched_switch() at sched_switch+0x890 mi_switch() at mi_switch+0xf8 sleepq_catch_signals() at sleepq_catch_signals+0x424 sleepq_wait_sig() at sleepq_wait_sig+0xc _cv_wait_sig() at _cv_wait_sig+0x10c seltdwait() at seltdwait+0x110 kern_select() at kern_select+0x81c sys_select() at sys_select+0x60 do_el0_sync() at do_el0_sync+0x634 handle_el0_sync() at handle_el0_sync+0x48 --- exception, esr 0x56000000 `` -
Ok well that's definitely a kernel panic.
What you want from the start of the panic output. So the initial panic string and the backtrace (
bt>)So as an example:
0:kdb.enter.default> run pfs db:1:pfs> bt Tracing pid 0 tid 100007 td 0xfffffe00119bd720 kdb_enter() at kdb_enter+0x32/frame 0xfffffe00101a86c0 vpanic() at vpanic+0x182/frame 0xfffffe00101a8710 panic() at panic+0x43/frame 0xfffffe00101a8770 trap_fatal() at trap_fatal+0x409/frame 0xfffffe00101a87d0 trap_pfault() at trap_pfault+0x4f/frame 0xfffffe00101a8830 calltrap() at calltrap+0x8/frame 0xfffffe00101a8830 --- trap 0xc, rip = 0xffffffff80f66369, rsp = 0xfffffe00101a8900, rbp = 0xfffffe00101a8930 --- pppoe_findsession() at pppoe_findsession+0x79/frame 0xfffffe00101a8930 ng_pppoe_rcvdata_ether() at ng_pppoe_rcvdata_ether+0x461/frame 0xfffffe00101a89b0 ng_apply_item() at ng_apply_item+0x2bf/frame 0xfffffe00101a8a40 ng_snd_item() at ng_snd_item+0x28e/frame 0xfffffe00101a8a80 ether_demux() at ether_demux+0x212/frame 0xfffffe00101a8ab0 ether_nh_input() at ether_nh_input+0x353/frame 0xfffffe00101a8b10 netisr_dispatch_src() at netisr_dispatch_src+0xb9/frame 0xfffffe00101a8b60 ether_input() at ether_input+0x69/frame 0xfffffe00101a8bc0 ether_demux() at ether_demux+0x9e/frame 0xfffffe00101a8bf0 ether_nh_input() at ether_nh_input+0x353/frame 0xfffffe00101a8c50 netisr_dispatch_src() at netisr_dispatch_src+0xb9/frame 0xfffffe00101a8ca0 ether_input() at ether_input+0x69/frame 0xfffffe00101a8d00 iflib_rxeof() at iflib_rxeof+0xbdb/frame 0xfffffe00101a8e00 _task_fn_rx() at _task_fn_rx+0x72/frame 0xfffffe00101a8e40 gtaskqueue_run_locked() at gtaskqueue_run_locked+0x15d/frame 0xfffffe00101a8ec0 gtaskqueue_thread_loop() at gtaskqueue_thread_loop+0xc3/frame 0xfffffe00101a8ef0 fork_exit() at fork_exit+0x7e/frame 0xfffffe00101a8f30 fork_trampoline() at fork_trampoline+0xe/frame 0xfffffe00101a8f30 --- trap 0x107a772c, rip = 0x11d295625b1b31a1, rsp = 0xf02460003c98dfb3, rbp = 0x41abfa0065646f --- db:1:pfs> show registers cs 0x20 ds 0x3b es 0x3b fs 0x13 gs 0x1b ss 0x28 rax 0x12 rcx 0x1 rdx 0xfffffe00101a82e0 rbx 0x100 rsp 0xfffffe00101a86c0 rbp 0xfffffe00101a86c0 rsi 0 rdi 0xffffffff83183f98 vt_conswindow+0x10 r8 0 r9 0x1c200001 r10 0xffffffff83183f88 vt_conswindow r11 0x20 r12 0x2cdc1f807000 r13 0xfffffe00101a8840 r14 0xfffffe00101a8750 r15 0xfffffe00119bd720 rip 0xffffffff80dd82f2 kdb_enter+0x32 rflags 0x82 kdb_enter+0x32: movq $0,0x27bd313(%rip) db:1:pfs> show pcpu cpuid = 0 dynamic pcpu = 0xbf6800 curthread = 0xfffffe00119bd720: pid 0 tid 100007 critnest 1 "if_io_tqg_0" curpcb = 0xfffffe00119bdc40 fpcurthread = none idlethread = 0xfffffe00119bf3a0: tid 100003 "idle: cpu0" self = 0xffffffff84010000 curpmap = 0xffffffff83549750 tssp = 0xffffffff84010384 rsp0 = 0xfffffe00101a9000 kcr3 = 0x8000000081c3e002 ucr3 = 0xffffffffffffffff scr3 = 0x1958cac7f gs32p = 0xffffffff84010404 ldt = 0xffffffff84010444 tss = 0xffffffff84010434 curvnet = 0xfffff800011c7a00 -
@stephenw10 thanks! Got it - what should I do with it?
-
You can upload it here and I'll check it:
https://nc.netgate.com/nextcloud/s/sFoGNTrcoDypsx5 -
@stephenw10 done :-)