Another Netgate with storage failure, 6 in total so far
-
@andrew_cb recordsize is an upper limit, ashift is the lower limit (should be 4k on modern storage devices, which is a value of 12, set on pool creation time and is viewable on the pool variables).
The record will be from one ashift allocation up to record size in multiples of ashift. The bigger the difference between ashift and recordsize, the higher potential for compression gains, as compression can only work on multiples of ashift inside the recordsize.
So if e.g. a write is 7KB, then it will be a 8KB write not 128KB.
The one change should just be boost zfs txg timeout to something like 60-120 seconds as a default.
-
@w0w said in Another Netgate with storage failure, 6 in total so far:
@andrew_cb
There are some dumb adapters from 2242 to 2230. Looks like 2230 nvme is a common thing, you can buy it almost everywhere.
Of course, there's no certainty that it will work, but if I had enough devices and no better options available, I would give this approach a try.I have seen those adapters, but I was hoping to avoid adding yet another component and point of failure to the "fix." However, we may have to, as it would make it much easier to source compatible drives.
-
@arri From what I can tell, the WD SN520 was released in 2018 and is no longer in production. I cannot find any that will ship to Canada. It seems like NVMe drives in B+M key format never really caught on so there are few options available.
We just received 10 of the KingSpec drives so that will allow us to begin replacements on all our 110% wear devices.
-
@chrcoluk I am seeing conflicting information on the relationship of
recordsizeand the amount of data written when only part of the record is modified. From the Tuning ZFS article:Tuning the block size also avoids write amplification. Write amplification happens when changing a small amount of data requires writing a large amount of data. Suppose you must change 8KB in the middle of a 128 KB block. ZFS must read the 128 KB, modify 8 KB somewhere in it, calculate a new checksum, and write the new 128 KB block. ZFS is a copy-on-write filesystem, so it would wind up writing a whole new 128 KB block just to change that 8 KB.
What you are saying makes sense, but if it was working the way you describe, then would you expect to see less of a decrease in write rate from changing zfs.txg.timeout?
-
@andrew_cb I think you need to link to the article, the first line e.g. is incorrect terminology. Record size isnt the block size.
-
I was trying to figure out why the available disk space on a virtualized pfSense instance was significantly smaller than the provisioned size of the virtual disk. I discovered that it had several boot environments that had been automatically created by pfSense upgrades. Each boot environment was 1-2GB. Once I deleted the boot environments, the reported disk size in pfSense matched the provisioned disk size.
This got me thinking, "If the the filesystem is copy-on-write, and the snapshots are from pfSense upgrades which replace many or all of the files, and each boot environment is consuming 1-2GB of space, then there is several GB of storage space that is allocated and not empty."
4GB of boot environments on a 16GB eMMC means that 25% of the blocks are not available for wear leveling, thus all the write activity is occurring in at most 75% of the blocks and will accelerate the eMMC wear. Simply installing packages will also exacerbate the situation by consuming several hundred MB or even a few GB of blocks that are now unavailable for wear leveling.
One of the eMMC chips found on Netgate devices is a
Kingston EMMC16G_TB29. Its datasheet states:The integrated eMMC controller directly manages NAND flash media which relieves the host processor of these tasks, including flash media error control, wear leveling, NAND flash management and performance
optimization.Kingston EMMC16G_TB29 Datasheet
A Kioxia article Understanding Wear Leveling in NAND Flash Memory notes 2 types of wear leveling:
- static: includes usable data blocks whether or not they contain user data
- dynamic: only includes unused (free) data blocks
It also contains an interesting comment:
In a use case when wear leveling is not enabled - when 10% of the flash device’s total capacity is used - only 10% of the total flash blocks in the device would be programmed and the remaining 90% of the total flash blocks would never be programmed. As an example, if after one year the flash blocks that were programmed reach their W/E cycle limit and become unreliable, the flash device would be considered EoL despite the fact that 90% of the flash blocks were never used!
Kioxia - Understanding Wear Leveling in NAND Flash Memory
The Kingston datasheet does not specify whether static or dynamic wear leveling is used. From what I can tell, dynamic wear leveling is more sophisticated and is less commonly used, so my best guess is that the Kingston eMMC is using static wear leveling (only the unused/free blocks).
Combined with my points mentioned above, it seems plausible that there can be "hot spots" of blocks on the eMMC (or any flash storage) that take significantly more P/E cycles and wear out first and cause the eMMC to fail, even when there may be many blocks with low P/E cycles. For example, if most of the sustained 300KB/s write activity is concentrated on 4GB, 8GB, or 12GB of the eMMC instead of the full 16GB, then it makes sense why it dies in such a short period of time - even less than 12 months in some cases.
-
Example below.
ashift=12 (4k block size).
recordsize = 128kThe amount written can be either 4,8,12,16,20,24,28,32,36,40,44,48,52,56,60,64,68,72,76,80,84,88,92,96,100,104,108,112,116,120,124,128k per record.
Smaller record transactions are less efficient on meta data.
If compression is enabled it will activate if it can compress the record down to a smaller size, the sizes available are dependent on the ashift value and recordsize.
As an example if ashift is 12 and recordsize is 4k, compression can only work if its all zeroes. If recordsize is 8k, it will only work if it can get at least 50% compression as its not possible to write between 51% and 99% in such a configuration.So (a) smaller record sizes increases meta data overheads, and (b) record size is variable up to the amount configured in multiples of the ashift.
When txg is increased it has these benefits.
(a) when logs are overwritten if the old is only ever written in ram it doesnt hit disk at all.
(b) record size is larger, so writes are reduced in the form of reduced meta data being written in comparison to the data, its more efficient to dump 128k in a transaction compared to 4k in 32 separate transactions. If the data is compressible, it can massively reduce data written.
(c) depending how logs are written, if the entire filesize is written on every amendment to the log, a small txg will have very large write amplification.
(d) logs are highly compressible so (b) is really powerful on logs.Laymans answer, high txg means batched writing, batched writing means larger record being written, larger record means more compression, less data hits disk, and as a bonus less metadata hits disk.
I have played with this in VMs which graph the i/o's, if it makes you feel better, that data has verified what I am posting.
pfSense CE 2.8.1
-
@andrew_cb Interesting point and I don’t know that pfSense does auto cleanup (yet?) since there have been several posts with full storage.
Link for reference:
https://docs.netgate.com/pfsense/en/latest/troubleshooting/filesystem-shrink.html -
@chrcoluk said in Another Netgate with storage failure, 6 in total so far:
I think you need to link to the article, the first line e.g. is incorrect terminology. Record size isnt the block size.
The article linked in an earlier post of @andrew_cb's makes clear that it's not confusing "block size" for
recordsize:The most important tuning you can perform for a database is the dataset block size—through the
recordsizeproperty. The ZFSrecordsizefor any file that might be overwritten needs to match the block size used by the application.Tuning the block size also avoids [ . . . ]
@chrcoluk said in Another Netgate with storage failure, 6 in total so far:
Laymans answer, high txg means batched writing, batched writing means larger record being written, larger record means more compression, less data hits disk, and as a bonus less metadata hits disk.
I have played with this in VMs which graph the i/o's, if it makes you feel better, that data has verified what I am posting.
But so basically you agree that increasing the
vfs.zfs.txg.timeoutparameter is a net good thing... -
@chrcoluk said in Another Netgate with storage failure, 6 in total so far:
Thank you for the detailed explanation. This fits how I understand it and what others have said.
My guess is that the actual write rate is even higher, and the 200-300KB/s rate is after ZFS has optimized the data stream using smaller ashift values and compression.
(c) depending how logs are written, if the entire filesize is written on every amendment to the log, a small txg will have very large write amplification.
This seems to be the primary factor, as making changes to txg has an immediate and significant effect on write rate.
-
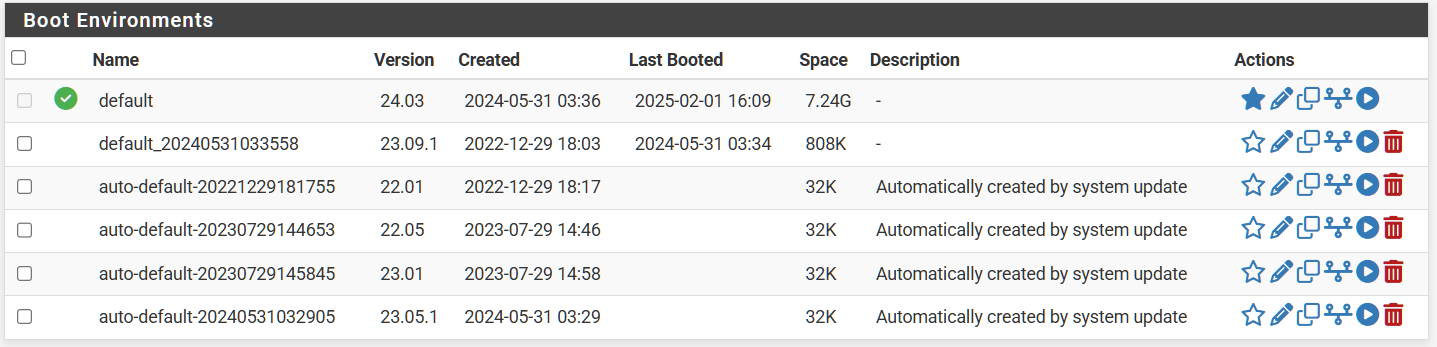
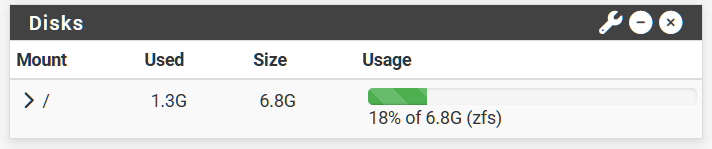
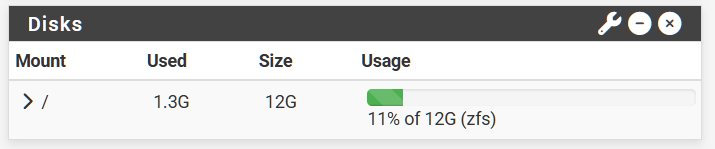
I checked our firewalls and found that they all had boot environments, with many going back to 22.01. I deleted all the boot environments, and all firewalls showed an increase in disk size. Here are a few examples:
FW1 before:
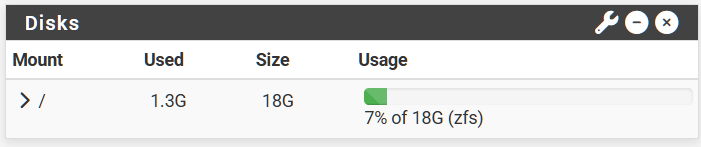
FW1 Boot environments:
FW1 after deleting boot environments:
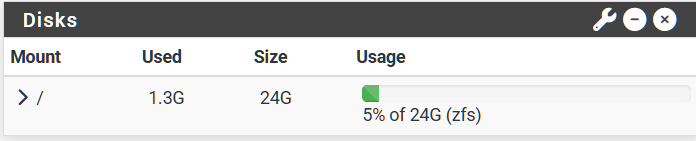
FW1 Result: 6GB more space after deleting 5 boot environments (avg 1.2GB per boot environment).
FW2 before:

FW2 Boot environments:

FW2 after deleting boot environment:
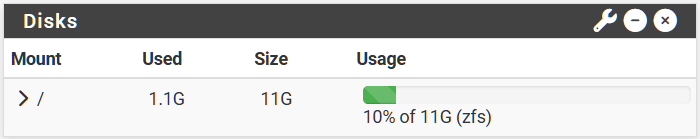
FW2 result: 1GB more space after deleting 1 boot environment (avg 1GB per boot environment).
FE3 before:
FW3 boot environments:

FW3 after deleting boot environments:
FW3 result: 5.2GB more free space after deleting 4 boot environments (avg 1.3GB per boot environment).
-
@andrew_cb said in Another Netgate with storage failure, 6 in total so far:
FW1 Result: 6GB more space after deleting 5 boot environments (avg 1.2GB per boot environment).
FWIW that's pretty typical, it just depends on how much changed on disk in between. The "32K" or whatever shows in the GUI is very misleading there, IMO.
-
@SteveITS said in Another Netgate with storage failure, 6 in total so far:
@andrew_cb said in Another Netgate with storage failure, 6 in total so far:
FW1 Result: 6GB more space after deleting 5 boot environments (avg 1.2GB per boot environment).
FWIW that's pretty typical, it just depends on how much changed on disk in between. The "32K" or whatever shows in the GUI is very misleading there, IMO.
Yes, I figured that the 32K was not accurate.
The size of the current boot environment decreases to 1.7-1.9GB after the other boot environments are deleted, which is more in line with the actual space consumed. -
@tinfoilmatt said in Another Netgate with storage failure, 6 in total so far:
But so basically you agree that increasing the
vfs.zfs.txg.timeoutparameter is a net good thing...For sure.
-
As someone about to buy a 4200, does anyone know if Netgate has implemented any of these strategies in their latest pfSense Plus? If not, can somebody summarize the recommended tweaks?
-
@valnar buy a plus, set the vfs.zfs.txg.timeout to a value of between 15 and 30 seconds, connect it to an apc ups and use apcupsd package to initiate low power safe shutdown.
A bonus would be to buy a fan so it runs cool. Not necessary by any means but would probably help with overall service life.
My feeble understanding is that Netgate is working on zfs adjustments to address the poor ssd life but has released nothing yet.
-
@Mission-Ghost Thank you.
-
@valnar said in Another Netgate with storage failure, 6 in total so far:
summarize the recommended tweaks
See this post:
https://forum.netgate.com/topic/195990/another-netgate-with-storage-failure-6-in-total-so-far/21 -
S SteveITS referenced this topic on
-
@valnar For now, I recommend these two changes:
Navigate to System > Advanced > System Tunables and add a new tunable:
- Tunable
vfs.zfs.tgx.timeout - Value
30
Navigate to Diagnostics > Command Prompt and run
zfs set sync=always pfSense/ROOT/default/cf - Tunable
-
Thanks for the easy step-by-step instruction!
Quick question - Do you have to run the zfs set command on each subsequent reboot or just the first time after adding the tunable?