Port Forwarding stopped working after upgrading to 2.8.0
-
so i added icmp on the port forward but got request timed out still
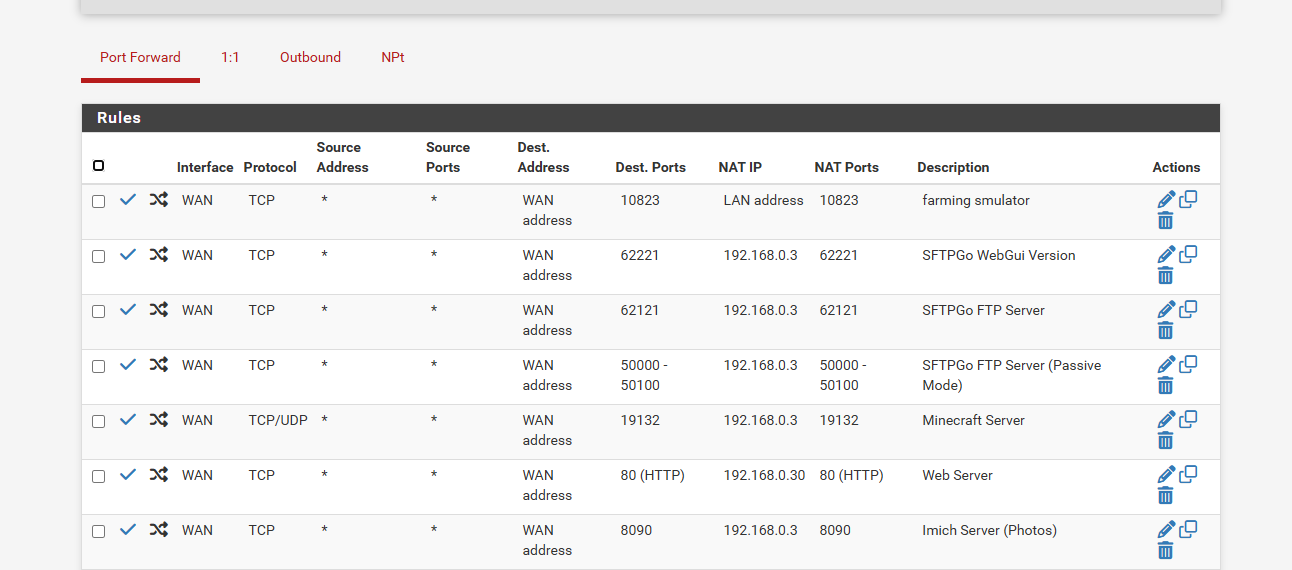
port forward side

-
@comet424 said in Port Forwarding stopped working after upgrading to 2.8.0:
the X.X.206.175 is the remote computer not connected to pfsense
Nope that's your external WAN IP address in those states.
But in the state table above we can see incoming connections from X.X.206.115 to the WAN address and they are being correctly forwarded to the internal server IP.
I assume you have that filtered for WAN only? If you allow all interfaces you should also see a corresponding state on LAN.
The state you see on WAN shows traffic both ways BUT only 1 packet so it's probably just being refused.
-
Where exactly are you testing from? How is it connected? It's in the same subnet as your WAN.
I can open an http connection to that site and ping it OK from my actual remote location.
-
so the way i testing is
my modem has pppoe and has wifi and lan
so i connect wifi for the remote comp
and its the 67.70.206.115and then i do ppoe on the WAN connection to the modem
and it logs in a 2nd time
and i get the
67.70.206.175 so i have 2 different WAN interfacesfiltered for WAN only if you mean states? then ya i do the screen shots above
if you mean filtered that i only have port forward on WAN to 192.168.0.30 then ya only Wanlike at moment my OpenVPN started working ok on the remote comp i using.. but the Webserver address still show nothing and i cant ping
-
and i do this wifi remote to do testing to make my network work outside of the network on the internet side and it all worked.. before back in 2.7.2 but i not sure if its a problem with my modem or it didnt upgrade right and i gotta start overr by format and then force update from the xml file so not sure
or maybe my modem doesnt like the new pfsense i dunno
-
@stephenw10 since you said you can ping my pfsense box
let me know if this workswww.mcproductions.mine.nu its my old dj website as i wanna upgrade it to AI generated website
but i cant ping it on the remote side.. but if it works for you to goto website and to ping it
the i guess my modem doesnt let me to do what it could before
and my openvpn client can connect to pfsense on the remote comp but not the websites and i need to test those other ports i have for port forwarding
-
@comet424 said in Port Forwarding stopped working after upgrading to 2.8.0:
let me know if this works
www.mcproductions.mine.nu
Yup that works.
Ok probably you're hitting an asymmetric routing problem that was previously allowed by floating state policy in 2.7.2. This has been switched back to Interface Bound in 2.8 which is more secure:
https://docs.netgate.com/pfsense/en/latest/releases/2-8-0.html#generalYou can try setting back to floating to test if you need to. However from something inside the WAN subnet like that is not really a good test. Especially if it's through an ISP router that may or may not be doing something! Much better to test from real external address like a tethered cell phone if you can.
-
@stephenw10
so i tried the floating and even rebooted pfsense.. but my remote comp still cant do pinging or the website... so its probably what you said the modem could be doing something funky and i need a real external internet to test.. . i dont have a cellphone with internet,. but least you said its workingso ill set it back interface bound policy
i not 100% sure what the 2 options means it kinda sounds like if you have a vpn that it wont leak onto the WAN side you dont need the egress floating ive setup before like a kill switch so if the vpn goes down no internet.. my take it does that kinda thing... if i wrong well i wrong i just trying to guess what it does in simple words terms and not engineer words lol
but ill see about different external internet testing like if i at home depot and use there wifi
be outta the way but least its a different internet to test...,.. here i was going to do a restore from my config file and see if that would fixed things...always learning new something everyday... and here my setup testing was flawless probably the provider updated the modems firmware and thne things bugger up too lol
i appreciate your guys help as i wouldnt have learned my testing remote comp isnt really a good idea
-
Upgrading pfSense wouldn't break any NAT setup.
What did break your NAT is most probably : what was your pfSense WAN IP before you've upgraded ?
And after ? If your WAN IP is "RFC 1918" then don't look any further : you have to change the NAT rule in the up stream, probably ISP router.Next step : every NAT rule has a WAN firewall rule - as traffic has to able to get into the WAN interface.
Here are mine :
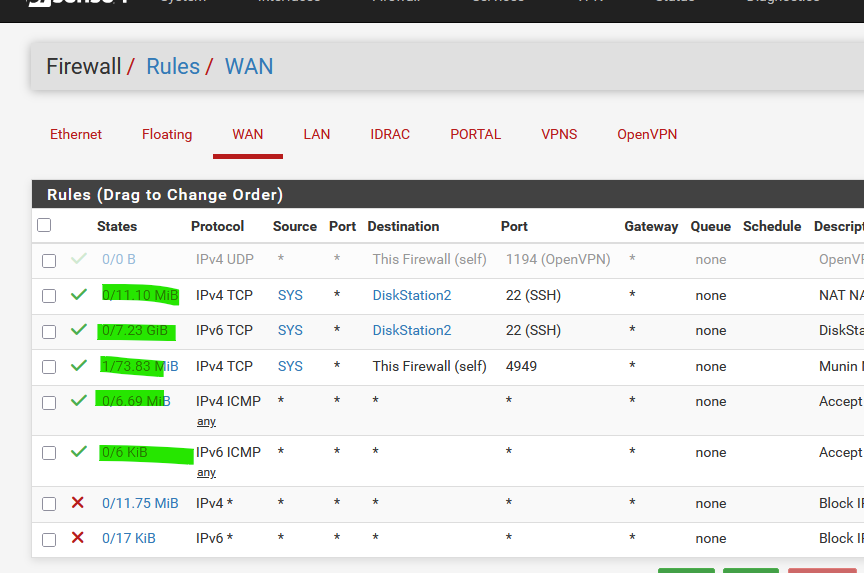
Observe the States column. When traffic start to enter, the Sates counter start to go up.
If they stay at 0/0 then you'll know the traffic never reaches the pfSense WAN interface, so the issue is upstream.Anyway : https://docs.netgate.com/pfsense/en/latest/troubleshooting/nat-port-forwards.html is the check list to follow.
-
@Gertjan
ah ok for me my WAN is PPPOE and i use a login and password and then get a dynamic ip
not sure how that RFC 1918 i remember seeing that and doing it for something in the pastill check i did find out apparently my websites were working but the way i was testing is aysemetical which not sure what that means or what not
but i did find another issues i not sure if its my network card or what not
i got a 10Gtek Dual 1.25GB nic supposed to be intel as i wanted to be compatible with pfsensebut ive been experiencing since i upgraded to 2.8.0 that there so i not sure if 10Gtek company if its compatible with pfsense or not
as networking works.. and then at random times it will work partially say accessing the pfsense page you can access the page login but thats it or you loose connection.. and then might come back.. Vlans come and then they go with my cameras.. but once you reboot pfsense it works totally again.... its weird had no issues with 2..7.2 so i not sure if its a glitch bad upgrade or card that is slowly faulting but this randomise is also randomly how long between issues before was like ever 15 min to an hour to like a day or 2
-
That's not a NIC issue, you'd see everything fail if it was. Sounds more like a routing issue or possible something stalling out PHP.
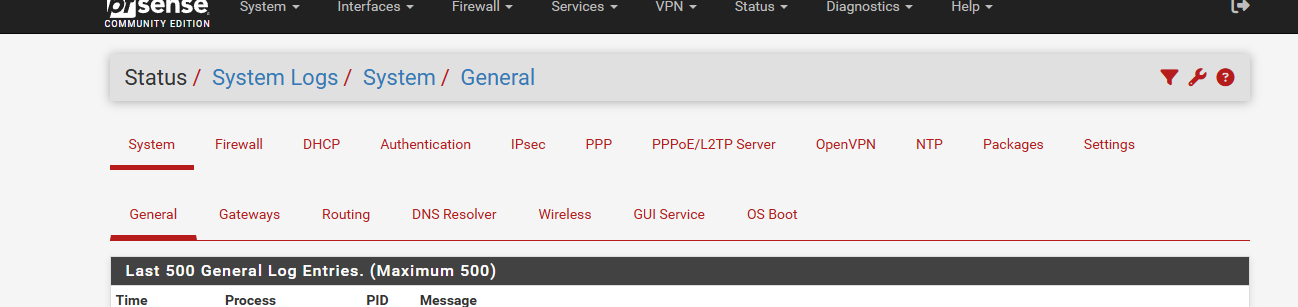
Check the system logs covering the time it happened.
-
@stephenw10
sorry delay wasnt around
so what do i check from the system logs? i also gotten this error now a few times but when you try to view it it doesnt work,,, and it worked oncebut what i found is say my security cameras on 192.168.10.0 network the shinobi can see the camera but my desktop pc using the reolink on the 192.168.0.0 it looses the cameras in the reolink camera like when you typically reboot pfsense...
and then it comes back or if not i reboot pfsense and then its working again.. is that all routing issues?so when i go into system logs what am i looking for? what should i scan... and here is the error i get a few times now

would these errors be caused by a routing error? this stuff only been happening after i upgraded to 2.8.0 is there like an extra check box that might been checked after the upgrade ? that i need to toggle off etc.. but ya what do i look for in the system logs specificlly to my desktop pc
i also find if my internet stalls out it stalls out my vpn and my internet will still basiclly work on the WAN side but vpn doesnt i need to reboot pfsense to get internet on vpn side to work again its like it stalls out and then rebooting pfsense solves it... as i can ping like 1.1.1.1 but i cant ping google.ca unless i reboot pfsense but if i ping google.ca on the pfsense box then i can typically ping google.. but not to the desktop
is that also related to routing issue you think i might have
-
Mmm, if you can hit the login page but nothing beyond it that's almost always PHP stalling or being killed. That is usually a symptom of something else trying to make it do something it shouldn't or can't.
So I would be looking at the main system log leading up the failure to see what might be happening to load up PHP.
-
@stephenw10
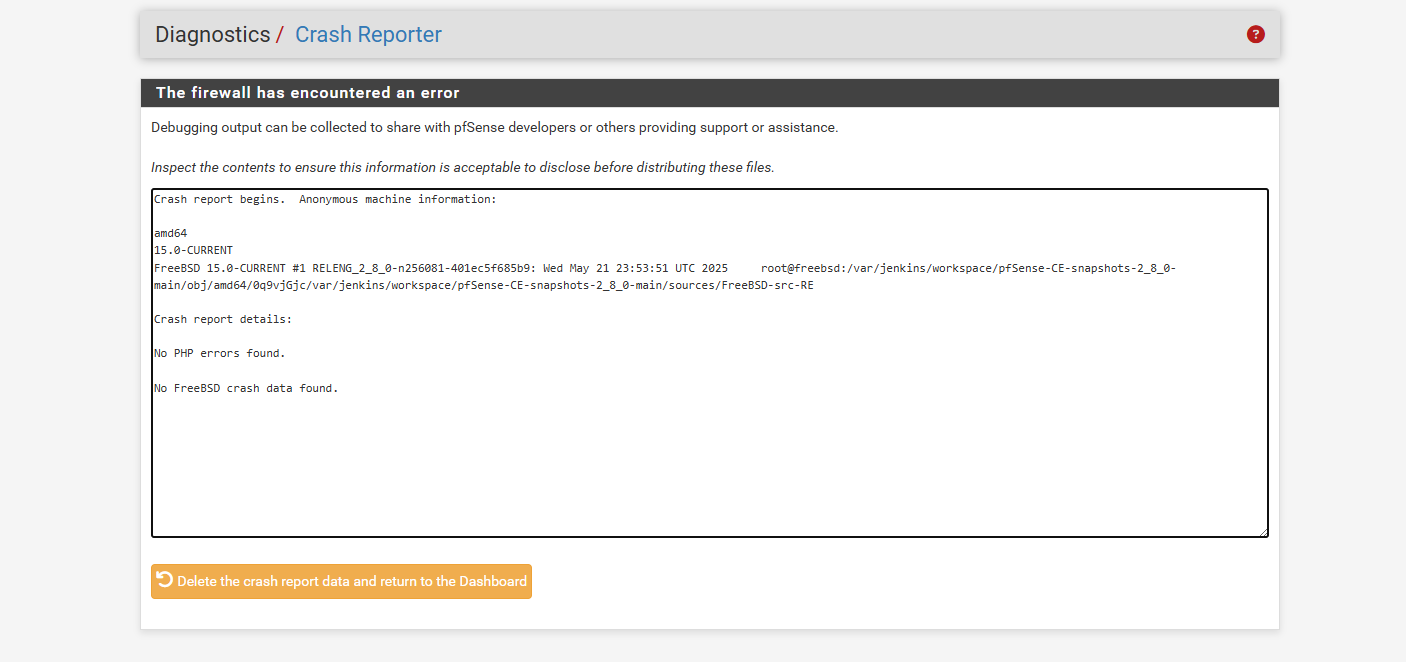
ya so like majority of the time it will just sit there you cant click the crash reporter link i had that open and i rebooted the pfsense and i was able to click that page later the crash reporter shows nothingoh and i remember i also have issues
from the desktop pc
i not able to ssh into the pfsense or when the gui page like stalls out i can ssh in and reboot or sometimes i cant and i use a wifi plug on the pfsense to reboot.. also i noticed sometimes when i reboot normal of pfsense it never comes back up i dont currently have a monitor hooked to it.. but to get it to boot back up i toggle the wifi plug and then it boots back up again.. as after a normal reboot and it doesnt come back up within 5 min is an issuenow another thing i remember is if i cant ssh into the pfsense box from my desktop.. i can terminal into my Unraid Server and i can ssh to the pfsense fine.. and if i ssh from the desktop when its not working it will work again after a certain amount of time it just starts working
now i googled what the minum specs for pfsense 2.8.0 and saying needs a quad core with 2ghz.. now my cpu is a Intel(R) Celeron(R) J4105 CPU @ 1.50GHz 4 Core i was thinking of just upgrading my server and give my pfsense my AMD Ryzen 7 5800X 8-Core with an asus tuf x570 motherboard
as you mentioned the php is stalling out if its underpowered now from the upgradei did try a re upgrade of pfsense using hte config file but that didnt help..
so what kills or stalls the php is that happening on the desktop or is that happening on the pfsense of a combination of both..
so when i looking in the system log i dont have a php sub tab so how do i look for the php or what am i exactly looking for as i not 100% sure what to look
and do i do anything under the states or routes under the diagnostic page
is there like a diagnostic tool to test the pfsense also? and if the windows 11 desktop php stalling out how do i go about that too..
all i know is if i do a pfsense reboot it solves the problem for a while but the issues can re occur after an hour or several hours or a day or 2.. so its not specific set
-
Hmm, SSH should still work even if PHP is not responding so that could also just be a symptom.
But after you reboot and regain access to the firewall the system logs should contain some reference to what was happening at the time.
Are you able to connect to the firewall console directly when this is happening?
If there's an issue with the boot drive it might present like this is be unable to log anything. The console would be full of errors though if that happened.
-
ill have to get a monitor on the computer then so i can check when it fails to boot.. does pfsense able to show any like s.m.a.r.t errors if there is any so you can see if there is a problem? and can i run a like ssh shell command to run a diagnostic on the ssd to see if there is an error does pfsense offer that?
as for if i can connect to the firewall directly when its glitching... as of the ssh its been a mix so sometimes yes or sometimes no and it takes a bit before it allows me to ssh in it just sits at trying to connect for a long time it will either drop out after so long and you try again sometimes works next sometimes no... and sometimes it will ssh like for a minute before it prompts the login and i do
ssh admin@192.168.0.1now in the system logs whjere would i look for errors but wouldnt the errors be gone once you reboot it.. it just starts off fresh? or does it keep logs prior to the reboot..
-
i just seen a s.m.a.r.t under diagnostics my bad dislexia missed it... ill do those tests and report back too
-
so i ran the test and the results are
smartctl 7.4 2023-08-01 r5530 [FreeBSD 15.0-CURRENT amd64] (local build)
Copyright (C) 2002-23, Bruce Allen, Christian Franke, www.smartmontools.org

=== START OF INFORMATION SECTION ===
Model Family:     Silicon Motion based SSDs
Device Model:     ADATA SU650
Serial Number:    2I3620089130
LU WWN Device Id: 0 000000 000000000
Firmware Version: V8X01c45
User Capacity:    120,034,123,776 bytes [120 GB]
Sector Size:      512 bytes logical/physical
Rotation Rate:    Solid State Device
Form Factor:      2.5 inches
TRIM Command:     Available, deterministic, zeroed
Device is:        In smartctl database 7.3/5528
ATA Version is:   ACS-3, ATA8-ACS T13/1699-D revision 6
SATA Version is:  SATA 3.1, 6.0 Gb/s (current: 6.0 Gb/s)
Local Time is:    Mon Jul 14 13:58:32 2025 EDT
SMART support is: Available - device has SMART capability.
SMART support is: Enabled
AAM feature is:   Unavailable
APM feature is:   Unavailable
Rd look-ahead is: Enabled
Write cache is:   Enabled
DSN feature is:   Unavailable
ATA Security is:  Disabled, frozen [SEC2]
Wt Cache Reorder: Enabled

=== START OF READ SMART DATA SECTION ===
SMART overall-health self-assessment test result: PASSED

General SMART Values:
Offline data collection status:  (0x00)	Offline data collection activity
					was never started.
					Auto Offline Data Collection: Disabled.
Self-test execution status:      (   0)	The previous self-test routine completed
					without error or no self-test has ever
					been run.
Total time to complete Offline
data collection: 		(    1) seconds.
Offline data collection
capabilities: 			 (0x59) SMART execute Offline immediate.
					No Auto Offline data collection support.
					Suspend Offline collection upon new
					command.
					Offline surface scan supported.
					Self-test supported.
					No Conveyance Self-test supported.
					Selective Self-test supported.
SMART capabilities:            (0x0002)	Does not save SMART data before
					entering power-saving mode.
					Supports SMART auto save timer.
Error logging capability:        (0x01)	Error logging supported.
					General Purpose Logging supported.
Short self-test routine
recommended polling time: 	 (   3) minutes.
Extended self-test routine
recommended polling time: 	 (  11) minutes.
SCT capabilities: 	       (0x0039)	SCT Status supported.
					SCT Error Recovery Control supported.
					SCT Feature Control supported.
					SCT Data Table supported.

SMART Attributes Data Structure revision number: 10
Vendor Specific SMART Attributes with Thresholds:
ID# ATTRIBUTE_NAME          FLAGS    VALUE WORST THRESH FAIL RAW_VALUE
  1 Raw_Read_Error_Rate     POSR-K   100   100   050    -    0
  5 Reallocated_Sector_Ct   PO--CK   100   100   010    -    0
  9 Power_On_Hours          -O--CK   100   100   000    -    54346
 12 Power_Cycle_Count       -O--CK   100   100   000    -    199
161 Valid_Spare_Block_Cnt   -O--CK   100   100   000    -    33
162 Cache_Block_Count       -O--CK   100   100   000    -    706277
163 Initial_Bad_Block_Count -O--CK   100   100   000    -    100
164 Total_Erase_Count       -O--CK   100   100   000    -    1509
166 Min_Erase_Count         -O--CK   100   100   000    -    132
167 Average_Erase_Count     -O--CK   100   100   050    -    0
168 Max_Erase_Count_of_Spec -O--CK   100   100   000    -    0
169 Remaining_Lifetime_Perc -O--CK   100   100   000    -    100
171 Unknown_Attribute       -O--CK   100   100   000    -    0
172 Unknown_Attribute       -O--CK   100   100   000    -    0
174 Unknown_Attribute       -O--CK   100   100   000    -    143
175 Program_Fail_Count_Chip -O--CK   100   100   000    -    0
181 Program_Fail_Cnt_Total  -O---K   100   100   000    -    733685
187 Reported_Uncorrect      -O--CK   100   100   000    -    0
194 Temperature_Celsius     -O---K   100   100   030    -    61
195 Hardware_ECC_Recovered  -O-RCK   100   100   000    -    0
196 Reallocated_Event_Count -O--CK   100   100   000    -    0
199 UDMA_CRC_Error_Count    -O--CK   100   100   000    -    0
206 Unknown_SSD_Attribute   -O--CK   100   100   000    -    1279
207 Unknown_SSD_Attribute   -O--CK   100   100   000    -    1572
232 Available_Reservd_Space -O--CK   100   100   000    -    88
241 Host_Writes_32MiB       -O--CK   100   100   000    -    30179
242 Host_Reads_32MiB        -O--CK   100   100   000    -    947
249 Unkn_SiliconMotion_Attr -O--CK   100   100   000    -    30444
250 Read_Error_Retry_Rate   -O--CK   100   100   000    -    36707
                            ||||||_ K auto-keep
                            |||||__ C event count
                            ||||___ R error rate
                            |||____ S speed/performance
                            ||_____ O updated online
                            |______ P prefailure warning

General Purpose Log Directory Version 1
SMART           Log Directory Version 1 [multi-sector log support]
Address    Access  R/W   Size  Description
0x00       GPL,SL  R/O      1  Log Directory
0x01           SL  R/O      1  Summary SMART error log
0x02           SL  R/O      1  Comprehensive SMART error log
0x03       GPL     R/O      2  Ext. Comprehensive SMART error log
0x04       GPL,SL  R/O      5  Device Statistics log
0x06           SL  R/O      1  SMART self-test log
0x07       GPL     R/O      1  Extended self-test log
0x09           SL  R/W      1  Selective self-test log
0x10       GPL     R/O      1  NCQ Command Error log
0x11       GPL     R/O      1  SATA Phy Event Counters log
0x30       GPL,SL  R/O      8  IDENTIFY DEVICE data log
0x80-0x9f  GPL,SL  R/W     16  Host vendor specific log
0xe0       GPL,SL  R/W      1  SCT Command/Status
0xe1       GPL,SL  R/W      1  SCT Data Transfer

SMART Extended Comprehensive Error Log Version: 1 (2 sectors)
No Errors Logged

SMART Extended Self-test Log Version: 1 (1 sectors)
No self-tests have been logged.  [To run self-tests, use: smartctl -t]

SMART Selective self-test log data structure revision number 0
Note: revision number not 1 implies that no selective self-test has ever been run
 SPAN  MIN_LBA  MAX_LBA  CURRENT_TEST_STATUS
    1        0        0  Not_testing
    2        0        0  Not_testing
    3        0        0  Not_testing
    4        0        0  Not_testing
    5        0        0  Not_testing
Selective self-test flags (0x0):
  After scanning selected spans, do NOT read-scan remainder of disk.
If Selective self-test is pending on power-up, resume after 0 minute delay.

SCT Status Version:                  3
SCT Version (vendor specific):       0 (0x0000)
Device State:                        Active (0)
Current Temperature:                     0 Celsius
Power Cycle Min/Max Temperature:     28/28 Celsius
Lifetime    Min/Max Temperature:      0/36 Celsius
Specified Max Operating Temperature:   100 Celsius
Under/Over Temperature Limit Count:   0/0

SCT Temperature History Version:     2
Temperature Sampling Period:         0 minutes
Temperature Logging Interval:        0 minutes
Min/Max recommended Temperature:      0/100 Celsius
Min/Max Temperature Limit:           -10/125 Celsius
Temperature History Size (Index):    128 (1)

Index    Estimated Time   Temperature Celsius
   2    2025-07-14 11:51     ?  -
 ...    ..(124 skipped).    ..  -
 127    2025-07-14 13:56     ?  -
   0    2025-07-14 13:57    36  *****************
   1    2025-07-14 13:58    37  ******************

SCT Error Recovery Control:
           Read: Disabled
          Write: Disabled

Device Statistics (GP Log 0x04)
Page  Offset Size        Value Flags Description
0x01  =====  =               =  ===  == General Statistics (rev 1) ==
0x01  0x008  4             199  ---  Lifetime Power-On Resets
0x01  0x010  4           54346  ---  Power-on Hours
0x01  0x018  6     63292007565  ---  Logical Sectors Written
0x01  0x020  6      2112800956  ---  Number of Write Commands
0x01  0x028  6      1987291263  ---  Logical Sectors Read
0x01  0x030  6        12572061  ---  Number of Read Commands
0x01  0x038  6    195639257085  ---  Date and Time TimeStamp
0x04  =====  =               =  ===  == General Errors Statistics (rev 1) ==
0x04  0x008  4               0  ---  Number of Reported Uncorrectable Errors
0x04  0x010  4              53  ---  Resets Between Cmd Acceptance and Completion
0x06  =====  =               =  ===  == Transport Statistics (rev 1) ==
0x06  0x008  4            3842  ---  Number of Hardware Resets
0x06  0x018  4               0  ---  Number of Interface CRC Errors
0x07  =====  =               =  ===  == Solid State Device Statistics (rev 1) ==
0x07  0x008  1               1  ---  Percentage Used Endurance Indicator
                                |||_ C monitored condition met
                                ||__ D supports DSN
                                |___ N normalized value

Pending Defects log (GP Log 0x0c) not supported

SATA Phy Event Counters (GP Log 0x11)
ID      Size     Value  Description
0x0001  4            0  Command failed due to ICRC error
0x000a  4           31  Device-to-host register FISes sent due to a COMRESET
the 2nd option logs
smartctl 7.4 2023-08-01 r5530 [FreeBSD 15.0-CURRENT amd64] (local build)
Copyright (C) 2002-23, Bruce Allen, Christian Franke, www.smartmontools.org

=== START OF READ SMART DATA SECTION ===
SMART Error Log Version: 1
No Errors Logged
Offline Test
smartctl 7.4 2023-08-01 r5530 [FreeBSD 15.0-CURRENT amd64] (local build)
Copyright (C) 2002-23, Bruce Allen, Christian Franke, www.smartmontools.org

=== START OF OFFLINE IMMEDIATE AND SELF-TEST SECTION ===
Sending command: "Execute SMART off-line routine immediately in off-line mode".
Drive command "Execute SMART off-line routine immediately in off-line mode" successful.
Testing has begun.
Please wait 1 seconds for test to complete.
Test will complete after Mon Jul 14 14:00:32 2025 EDT
Use smartctl -X to abort test.

and then i did the summary
smartctl 7.4 2023-08-01 r5530 [FreeBSD 15.0-CURRENT amd64] (local build)
Copyright (C) 2002-23, Bruce Allen, Christian Franke, www.smartmontools.org

=== START OF INFORMATION SECTION ===
Model Family:     Silicon Motion based SSDs
Device Model:     ADATA SU650
Serial Number:    2I3620089130
LU WWN Device Id: 0 000000 000000000
Firmware Version: V8X01c45
User Capacity:    120,034,123,776 bytes [120 GB]
Sector Size:      512 bytes logical/physical
Rotation Rate:    Solid State Device
Form Factor:      2.5 inches
TRIM Command:     Available, deterministic, zeroed
Device is:        In smartctl database 7.3/5528
ATA Version is:   ACS-3, ATA8-ACS T13/1699-D revision 6
SATA Version is:  SATA 3.1, 6.0 Gb/s (current: 6.0 Gb/s)
Local Time is:    Mon Jul 14 14:02:02 2025 EDT
SMART support is: Available - device has SMART capability.
SMART support is: Enabled
AAM feature is:   Unavailable
APM feature is:   Unavailable
Rd look-ahead is: Enabled
Write cache is:   Enabled
DSN feature is:   Unavailable
ATA Security is:  Disabled, frozen [SEC2]
Wt Cache Reorder: Enabled

=== START OF READ SMART DATA SECTION ===
SMART overall-health self-assessment test result: PASSED

General SMART Values:
Offline data collection status:  (0x02)	Offline data collection activity
					was completed without error.
					Auto Offline Data Collection: Disabled.
Self-test execution status:      (   0)	The previous self-test routine completed
					without error or no self-test has ever
					been run.
Total time to complete Offline
data collection: 		(    1) seconds.
Offline data collection
capabilities: 			 (0x59) SMART execute Offline immediate.
					No Auto Offline data collection support.
					Suspend Offline collection upon new
					command.
					Offline surface scan supported.
					Self-test supported.
					No Conveyance Self-test supported.
					Selective Self-test supported.
SMART capabilities:            (0x0002)	Does not save SMART data before
					entering power-saving mode.
					Supports SMART auto save timer.
Error logging capability:        (0x01)	Error logging supported.
					General Purpose Logging supported.
Short self-test routine
recommended polling time: 	 (   3) minutes.
Extended self-test routine
recommended polling time: 	 (  11) minutes.
SCT capabilities: 	       (0x0039)	SCT Status supported.
					SCT Error Recovery Control supported.
					SCT Feature Control supported.
					SCT Data Table supported.

SMART Attributes Data Structure revision number: 10
Vendor Specific SMART Attributes with Thresholds:
ID# ATTRIBUTE_NAME          FLAGS    VALUE WORST THRESH FAIL RAW_VALUE
  1 Raw_Read_Error_Rate     POSR-K   100   100   050    -    0
  5 Reallocated_Sector_Ct   PO--CK   100   100   010    -    0
  9 Power_On_Hours          -O--CK   100   100   000    -    54347
 12 Power_Cycle_Count       -O--CK   100   100   000    -    199
161 Valid_Spare_Block_Cnt   -O--CK   100   100   000    -    33
162 Cache_Block_Count       -O--CK   100   100   000    -    706277
163 Initial_Bad_Block_Count -O--CK   100   100   000    -    100
164 Total_Erase_Count       -O--CK   100   100   000    -    1509
166 Min_Erase_Count         -O--CK   100   100   000    -    132
167 Average_Erase_Count     -O--CK   100   100   050    -    0
168 Max_Erase_Count_of_Spec -O--CK   100   100   000    -    0
169 Remaining_Lifetime_Perc -O--CK   100   100   000    -    100
171 Unknown_Attribute       -O--CK   100   100   000    -    0
172 Unknown_Attribute       -O--CK   100   100   000    -    0
174 Unknown_Attribute       -O--CK   100   100   000    -    143
175 Program_Fail_Count_Chip -O--CK   100   100   000    -    0
181 Program_Fail_Cnt_Total  -O---K   100   100   000    -    733685
187 Reported_Uncorrect      -O--CK   100   100   000    -    0
194 Temperature_Celsius     -O---K   100   100   030    -    61
195 Hardware_ECC_Recovered  -O-RCK   100   100   000    -    0
196 Reallocated_Event_Count -O--CK   100   100   000    -    0
199 UDMA_CRC_Error_Count    -O--CK   100   100   000    -    0
206 Unknown_SSD_Attribute   -O--CK   100   100   000    -    1279
207 Unknown_SSD_Attribute   -O--CK   100   100   000    -    1572
232 Available_Reservd_Space -O--CK   100   100   000    -    88
241 Host_Writes_32MiB       -O--CK   100   100   000    -    30180
242 Host_Reads_32MiB        -O--CK   100   100   000    -    947
249 Unkn_SiliconMotion_Attr -O--CK   100   100   000    -    30444
250 Read_Error_Retry_Rate   -O--CK   100   100   000    -    36707
                            ||||||_ K auto-keep
                            |||||__ C event count
                            ||||___ R error rate
                            |||____ S speed/performance
                            ||_____ O updated online
                            |______ P prefailure warning

General Purpose Log Directory Version 1
SMART           Log Directory Version 1 [multi-sector log support]
Address    Access  R/W   Size  Description
0x00       GPL,SL  R/O      1  Log Directory
0x01           SL  R/O      1  Summary SMART error log
0x02           SL  R/O      1  Comprehensive SMART error log
0x03       GPL     R/O      2  Ext. Comprehensive SMART error log
0x04       GPL,SL  R/O      5  Device Statistics log
0x06           SL  R/O      1  SMART self-test log
0x07       GPL     R/O      1  Extended self-test log
0x09           SL  R/W      1  Selective self-test log
0x10       GPL     R/O      1  NCQ Command Error log
0x11       GPL     R/O      1  SATA Phy Event Counters log
0x30       GPL,SL  R/O      8  IDENTIFY DEVICE data log
0x80-0x9f  GPL,SL  R/W     16  Host vendor specific log
0xe0       GPL,SL  R/W      1  SCT Command/Status
0xe1       GPL,SL  R/W      1  SCT Data Transfer

SMART Extended Comprehensive Error Log Version: 1 (2 sectors)
No Errors Logged

SMART Extended Self-test Log Version: 1 (1 sectors)
No self-tests have been logged.  [To run self-tests, use: smartctl -t]

SMART Selective self-test log data structure revision number 0
Note: revision number not 1 implies that no selective self-test has ever been run
 SPAN  MIN_LBA  MAX_LBA  CURRENT_TEST_STATUS
    1        0        0  Not_testing
    2        0        0  Not_testing
    3        0        0  Not_testing
    4        0        0  Not_testing
    5        0        0  Not_testing
Selective self-test flags (0x0):
  After scanning selected spans, do NOT read-scan remainder of disk.
If Selective self-test is pending on power-up, resume after 0 minute delay.

SCT Status Version:                  3
SCT Version (vendor specific):       0 (0x0000)
Device State:                        Active (0)
Current Temperature:                     0 Celsius
Power Cycle Min/Max Temperature:     28/28 Celsius
Lifetime    Min/Max Temperature:      0/37 Celsius
Specified Max Operating Temperature:   100 Celsius
Under/Over Temperature Limit Count:   0/0

SCT Temperature History Version:     2
Temperature Sampling Period:         0 minutes
Temperature Logging Interval:        0 minutes
Min/Max recommended Temperature:      0/100 Celsius
Min/Max Temperature Limit:           -10/125 Celsius
Temperature History Size (Index):    128 (2)

Index    Estimated Time   Temperature Celsius
   3    2025-07-14 11:55     ?  -
 ...    ..(123 skipped).    ..  -
 127    2025-07-14 13:59     ?  -
   0    2025-07-14 14:00    36  *****************
   1    2025-07-14 14:01     ?  -
   2    2025-07-14 14:02    38  *******************

SCT Error Recovery Control:
           Read: Disabled
          Write: Disabled

Device Statistics (GP Log 0x04)
Page  Offset Size        Value Flags Description
0x01  =====  =               =  ===  == General Statistics (rev 1) ==
0x01  0x008  4             199  ---  Lifetime Power-On Resets
0x01  0x010  4           54347  ---  Power-on Hours
0x01  0x018  6     63292109227  ---  Logical Sectors Written
0x01  0x020  6      2112803922  ---  Number of Write Commands
0x01  0x028  6      1987291287  ---  Logical Sectors Read
0x01  0x030  6        12572064  ---  Number of Read Commands
0x01  0x038  6    195639257085  ---  Date and Time TimeStamp
0x04  =====  =               =  ===  == General Errors Statistics (rev 1) ==
0x04  0x008  4               0  ---  Number of Reported Uncorrectable Errors
0x04  0x010  4              53  ---  Resets Between Cmd Acceptance and Completion
0x06  =====  =               =  ===  == Transport Statistics (rev 1) ==
0x06  0x008  4            3842  ---  Number of Hardware Resets
0x06  0x018  4               0  ---  Number of Interface CRC Errors
0x07  =====  =               =  ===  == Solid State Device Statistics (rev 1) ==
0x07  0x008  1               1  ---  Percentage Used Endurance Indicator
                                |||_ C monitored condition met
                                ||__ D supports DSN
                                |___ N normalized value

Pending Defects log (GP Log 0x0c) not supported

SATA Phy Event Counters (GP Log 0x11)
ID      Size     Value  Description
0x0001  4            0  Command failed due to ICRC error
0x000a  4           31  Device-to-host register FISes sent due to a COMRESET
so i ran the 4 tests
offline
short
extended
convenyanceconvenyance failed
smartctl 7.4 2023-08-01 r5530 [FreeBSD 15.0-CURRENT amd64] (local build)
Copyright (C) 2002-23, Bruce Allen, Christian Franke, www.smartmontools.org

=== START OF OFFLINE IMMEDIATE AND SELF-TEST SECTION ===
Conveyance Self-test functions not supported

Sending command: "Execute SMART Conveyance self-test routine immediately in off-line mode".
Command "Execute SMART Conveyance self-test routine immediately in off-line mode" failed: Input/output error
the other three passed
smartctl 7.4 2023-08-01 r5530 [FreeBSD 15.0-CURRENT amd64] (local build)
Copyright (C) 2002-23, Bruce Allen, Christian Franke, www.smartmontools.org

=== START OF READ SMART DATA SECTION ===
SMART Self-test log structure revision number 1
Num  Test_Description    Status                  Remaining  LifeTime(hours)  LBA_of_first_error
# 1  Extended offline    Completed without error       00%     54347         -
# 2  Short offline       Completed without error       00%     54347         -
# 3  Short offline       Completed without error       00%     54347
and the full summary is after running those 4 tests
smartctl 7.4 2023-08-01 r5530 [FreeBSD 15.0-CURRENT amd64] (local build)
Copyright (C) 2002-23, Bruce Allen, Christian Franke, www.smartmontools.org

=== START OF INFORMATION SECTION ===
Model Family:     Silicon Motion based SSDs
Device Model:     ADATA SU650
Serial Number:    2I3620089130
LU WWN Device Id: 0 000000 000000000
Firmware Version: V8X01c45
User Capacity:    120,034,123,776 bytes [120 GB]
Sector Size:      512 bytes logical/physical
Rotation Rate:    Solid State Device
Form Factor:      2.5 inches
TRIM Command:     Available, deterministic, zeroed
Device is:        In smartctl database 7.3/5528
ATA Version is:   ACS-3, ATA8-ACS T13/1699-D revision 6
SATA Version is:  SATA 3.1, 6.0 Gb/s (current: 6.0 Gb/s)
Local Time is:    Mon Jul 14 14:29:04 2025 EDT
SMART support is: Available - device has SMART capability.
SMART support is: Enabled
AAM feature is:   Unavailable
APM feature is:   Unavailable
Rd look-ahead is: Enabled
Write cache is:   Enabled
DSN feature is:   Unavailable
ATA Security is:  Disabled, frozen [SEC2]
Wt Cache Reorder: Enabled

=== START OF READ SMART DATA SECTION ===
SMART overall-health self-assessment test result: PASSED

General SMART Values:
Offline data collection status:  (0x02)	Offline data collection activity
					was completed without error.
					Auto Offline Data Collection: Disabled.
Self-test execution status:      (   0)	The previous self-test routine completed
					without error or no self-test has ever
					been run.
Total time to complete Offline
data collection: 		(    1) seconds.
Offline data collection
capabilities: 			 (0x59) SMART execute Offline immediate.
					No Auto Offline data collection support.
					Suspend Offline collection upon new
					command.
					Offline surface scan supported.
					Self-test supported.
					No Conveyance Self-test supported.
					Selective Self-test supported.
SMART capabilities:            (0x0002)	Does not save SMART data before
					entering power-saving mode.
					Supports SMART auto save timer.
Error logging capability:        (0x01)	Error logging supported.
					General Purpose Logging supported.
Short self-test routine
recommended polling time: 	 (   3) minutes.
Extended self-test routine
recommended polling time: 	 (  11) minutes.
SCT capabilities: 	       (0x0039)	SCT Status supported.
					SCT Error Recovery Control supported.
					SCT Feature Control supported.
					SCT Data Table supported.

SMART Attributes Data Structure revision number: 10
Vendor Specific SMART Attributes with Thresholds:
ID# ATTRIBUTE_NAME          FLAGS    VALUE WORST THRESH FAIL RAW_VALUE
  1 Raw_Read_Error_Rate     POSR-K   100   100   050    -    0
  5 Reallocated_Sector_Ct   PO--CK   100   100   010    -    0
  9 Power_On_Hours          -O--CK   100   100   000    -    54347
 12 Power_Cycle_Count       -O--CK   100   100   000    -    199
161 Valid_Spare_Block_Cnt   -O--CK   100   100   000    -    33
162 Cache_Block_Count       -O--CK   100   100   000    -    706277
163 Initial_Bad_Block_Count -O--CK   100   100   000    -    100
164 Total_Erase_Count       -O--CK   100   100   000    -    1509
166 Min_Erase_Count         -O--CK   100   100   000    -    132
167 Average_Erase_Count     -O--CK   100   100   050    -    0
168 Max_Erase_Count_of_Spec -O--CK   100   100   000    -    0
169 Remaining_Lifetime_Perc -O--CK   100   100   000    -    100
171 Unknown_Attribute       -O--CK   100   100   000    -    0
172 Unknown_Attribute       -O--CK   100   100   000    -    0
174 Unknown_Attribute       -O--CK   100   100   000    -    143
175 Program_Fail_Count_Chip -O--CK   100   100   000    -    0
181 Program_Fail_Cnt_Total  -O---K   100   100   000    -    733685
187 Reported_Uncorrect      -O--CK   100   100   000    -    0
194 Temperature_Celsius     -O---K   100   100   030    -    62
195 Hardware_ECC_Recovered  -O-RCK   100   100   000    -    0
196 Reallocated_Event_Count -O--CK   100   100   000    -    0
199 UDMA_CRC_Error_Count    -O--CK   100   100   000    -    0
206 Unknown_SSD_Attribute   -O--CK   100   100   000    -    1279
207 Unknown_SSD_Attribute   -O--CK   100   100   000    -    1572
232 Available_Reservd_Space -O--CK   100   100   000    -    88
241 Host_Writes_32MiB       -O--CK   100   100   000    -    30180
242 Host_Reads_32MiB        -O--CK   100   100   000    -    947
249 Unkn_SiliconMotion_Attr -O--CK   100   100   000    -    30444
250 Read_Error_Retry_Rate   -O--CK   100   100   000    -    36707
                            ||||||_ K auto-keep
                            |||||__ C event count
                            ||||___ R error rate
                            |||____ S speed/performance
                            ||_____ O updated online
                            |______ P prefailure warning

General Purpose Log Directory Version 1
SMART           Log Directory Version 1 [multi-sector log support]
Address    Access  R/W   Size  Description
0x00       GPL,SL  R/O      1  Log Directory
0x01           SL  R/O      1  Summary SMART error log
0x02           SL  R/O      1  Comprehensive SMART error log
0x03       GPL     R/O      2  Ext. Comprehensive SMART error log
0x04       GPL,SL  R/O      5  Device Statistics log
0x06           SL  R/O      1  SMART self-test log
0x07       GPL     R/O      1  Extended self-test log
0x09           SL  R/W      1  Selective self-test log
0x10       GPL     R/O      1  NCQ Command Error log
0x11       GPL     R/O      1  SATA Phy Event Counters log
0x30       GPL,SL  R/O      8  IDENTIFY DEVICE data log
0x80-0x9f  GPL,SL  R/W     16  Host vendor specific log
0xe0       GPL,SL  R/W      1  SCT Command/Status
0xe1       GPL,SL  R/W      1  SCT Data Transfer

SMART Extended Comprehensive Error Log Version: 1 (2 sectors)
No Errors Logged

SMART Extended Self-test Log Version: 1 (1 sectors)
Num  Test_Description    Status                  Remaining  LifeTime(hours)  LBA_of_first_error
# 1  Extended offline    Completed without error       00%     54347         -
# 2  Short offline       Completed without error       00%     54347         -
# 3  Short offline       Completed without error       00%     54347         -

SMART Selective self-test log data structure revision number 0
Note: revision number not 1 implies that no selective self-test has ever been run
 SPAN  MIN_LBA  MAX_LBA  CURRENT_TEST_STATUS
    1        0        0  Not_testing
    2        0        0  Not_testing
    3        0        0  Not_testing
    4        0        0  Not_testing
    5        0        0  Not_testing
Selective self-test flags (0x0):
  After scanning selected spans, do NOT read-scan remainder of disk.
If Selective self-test is pending on power-up, resume after 0 minute delay.

SCT Status Version:                  3
SCT Version (vendor specific):       0 (0x0000)
Device State:                        Active (0)
Current Temperature:                     0 Celsius
Power Cycle Min/Max Temperature:     28/28 Celsius
Lifetime    Min/Max Temperature:      0/39 Celsius
Specified Max Operating Temperature:   100 Celsius
Under/Over Temperature Limit Count:   0/0

SCT Temperature History Version:     2
Temperature Sampling Period:         0 minutes
Temperature Logging Interval:        0 minutes
Min/Max recommended Temperature:      0/100 Celsius
Min/Max Temperature Limit:           -10/125 Celsius
Temperature History Size (Index):    128 (4)

Index    Estimated Time   Temperature Celsius
   5    2025-07-14 12:22     ?  -
 ...    ..(121 skipped).    ..  -
 127    2025-07-14 14:24     ?  -
   0    2025-07-14 14:25    36  *****************
   1    2025-07-14 14:26     ?  -
   2    2025-07-14 14:27     ?  -
   3    2025-07-14 14:28     ?  -
   4    2025-07-14 14:29    40  *********************

SCT Error Recovery Control:
           Read: Disabled
          Write: Disabled

Device Statistics (GP Log 0x04)
Page  Offset Size        Value Flags Description
0x01  =====  =               =  ===  == General Statistics (rev 1) ==
0x01  0x008  4             199  ---  Lifetime Power-On Resets
0x01  0x010  4           54347  ---  Power-on Hours
0x01  0x018  6     63292814528  ---  Logical Sectors Written
0x01  0x020  6      2112820776  ---  Number of Write Commands
0x01  0x028  6      1987291311  ---  Logical Sectors Read
0x01  0x030  6        12572067  ---  Number of Read Commands
0x01  0x038  6    195650130499  ---  Date and Time TimeStamp
0x04  =====  =               =  ===  == General Errors Statistics (rev 1) ==
0x04  0x008  4               0  ---  Number of Reported Uncorrectable Errors
0x04  0x010  4              53  ---  Resets Between Cmd Acceptance and Completion
0x06  =====  =               =  ===  == Transport Statistics (rev 1) ==
0x06  0x008  4            3842  ---  Number of Hardware Resets
0x06  0x018  4               0  ---  Number of Interface CRC Errors
0x07  =====  =               =  ===  == Solid State Device Statistics (rev 1) ==
0x07  0x008  1               1  ---  Percentage Used Endurance Indicator
                                |||_ C monitored condition met
                                ||__ D supports DSN
                                |___ N normalized value

Pending Defects log (GP Log 0x0c) not supported

SATA Phy Event Counters (GP Log 0x11)
ID      Size     Value  Description
0x0001  4            0  Command failed due to ICRC error
0x000a  4           31  Device-to-host register FISes sent due to a COMRESET
so dunno if it helps anything for boot up it showed 0 errors and such on when it struggles to reboot
-
Mmm, that seems fine.
So I'd look at the logs for the time. Including if there is a suspicious gap in the logs at that point.
-
@stephenw10
ah ok
so in the logs id just look for a gap in time then and i guess any of the sub headings... ill keep an eye out when it happens and report back ..is my current cpu under powered would that be an issue.. and ill hook up a monitor tonight so i can see any console issues especcially when it fails to reboot
does the system logs show stuff prior to a reboot when i reboot .. like does it save or is it all reset at the reboot..
and its definitely not the 10gtek card? as i know i switched to it as you guys on here mentioned dont use the realtek cards not supported..
always something lol but ill keep an eye out when it happens again