SG-1000 throughput slow down
-
Running the sppedtest-cli gives me:
[2.4.4-RELEASE][root@pfSense.localdomain]/root: pkg install py27-speedtest-cli
Updating pfSense-core repository catalogue...
pfSense-core repository is up to date.
Updating pfSense repository catalogue...
pfSense repository is up to date.
All repositories are up to date.
The following 1 package(s) will be affected (of 0 checked):

New packages to be INSTALLED:
        py27-speedtest-cli: 2.0.2 [pfSense]

Number of packages to be installed: 1

34 KiB to be downloaded.

Proceed with this action? [y/N]: y
[1/1] Fetching py27-speedtest-cli-2.0.2.txz: 100%   34 KiB  35.1kB/s    00:01
Checking integrity... done (0 conflicting)
[1/1] Installing py27-speedtest-cli-2.0.2...
[1/1] Extracting py27-speedtest-cli-2.0.2: 100%
[2.4.4-RELEASE][root@pfSense.localdomain]/root: speedtest-cli
Retrieving speedtest.net configuration...
Testing from Optus (***.***.***.***)...
Retrieving speedtest.net server list...
Selecting best server based on ping...
Hosted by Telstra (Brisbane) [12.30 km]: 25.819 ms
Testing download speed................................................................................
Download: 53.24 Mbit/s
Testing upload speed...............................................................................................
.Upload: 1.90 Mbit/s
[2.4.4-RELEASE][root@pfSense.localdomain]/root: speedtest-cli
Retrieving speedtest.net configuration...
Testing from Optus (***.***.***.***)...
Retrieving speedtest.net server list...
Selecting best server based on ping...
Hosted by Telstra (Brisbane) [12.30 km]: 23.191 ms
Testing download speed................................................................................
Download: 53.17 Mbit/s
Testing upload speed...............................................................................................
.Upload: 1.91 Mbit/s
But the speed test web interface gives me 87.09 Mbps when run between the above test,
will have a look to see if/how I can run the speedtest-cli on the windows laptop.
-
When running the speedtest-cli (in python) from the windows laptop everything looks fine, but I still get a slower throughput when downloading files i.e. http://ipv4.download.thinkbroadband.com/100MB.zip
Laptop speedtest-cli results:
SG-1000 ConnectionC:\>speedtest-cli Retrieving speedtest.net configuration... Testing from Optus (114.77.175.53)... Retrieving speedtest.net server list... Selecting best server based on ping... Hosted by 'Yes' Optus (Brisbane) [12.30 km]: 13.505 ms Testing download speed................................................................................ Download: 98.02 Mbit/s Testing upload speed...................................................................................................... Upload: 1.82 Mbit/s C:\>speedtest-cli Retrieving speedtest.net configuration... Testing from Optus (114.77.175.53)... Retrieving speedtest.net server list... Selecting best server based on ping... Hosted by Telstra (Brisbane) [12.30 km]: 13.838 ms Testing download speed................................................................................ Download: 95.90 Mbit/s Testing upload speed...................................................................................................... Upload: 1.19 Mbit/s C:\>speedtest-cli Retrieving speedtest.net configuration... Testing from Optus (***.***.***.***)... Retrieving speedtest.net server list... Selecting best server based on ping... Hosted by Foxtel Broadband (Brisbane) [6.75 km]: 15.499 ms Testing download speed................................................................................ Download: 85.33 Mbit/s Testing upload speed..................................................................................................... .Upload: 1.66 Mbit/sDirect Connection
C:\>speedtest-cli Retrieving speedtest.net configuration... Testing from Optus (***.***.***.***)... Retrieving speedtest.net server list... Selecting best server based on ping... Hosted by 'Yes' Optus (Brisbane) [6.75 km]: 14.246 ms Testing download speed................................................................................ Download: 91.24 Mbit/s Testing upload speed...................................................................................................... Upload: 2.06 Mbit/s C:\>speedtest-cli Retrieving speedtest.net configuration... Testing from Optus (***.***.***.***)... Retrieving speedtest.net server list... Selecting best server based on ping... Hosted by 'Yes' Optus (Brisbane) [6.75 km]: 15.19 ms Testing download speed................................................................................ Download: 80.20 Mbit/s Testing upload speed...................................................................................................... Upload: 1.18 Mbit/s C:\>cd / C:\>speedtest-cli Retrieving speedtest.net configuration... Testing from Optus (***.***.***.***)... Retrieving speedtest.net server list... Selecting best server based on ping... Hosted by 'Yes' Optus (Brisbane) [6.75 km]: 14.002 ms Testing download speed................................................................................ Download: 80.74 Mbit/s Testing upload speed...................................................................................................... Upload: 1.48 Mbit/s -
You might check to see it's some sort of flow control issue. The easiest way to test that is to put an unmanaged switch between the SG-1000 WAN and whatever it's connected to if you can.
Steve
-
Testing with a Netgear GS108 as an unmanaged switch
Running my ps script I get:
Laptop -> GS108 -> SG-1000 -> Cable Modem -> Internet
File Size: 10 MB, Time: 38.4099 s, Speed: 2.08 Mbps
File Size: 10 MB, Time: 32.3872 s, Speed: 2.47 Mbps
File Size: 10 MB, Time: 33.5068 s, Speed: 2.39 Mbps
Laptop -> GS108 -> Cable Modem -> Internet
File Size: 10 MB, Time 6.8053 s, Speed: 11.76 Mbps
File Size: 10 MB, Time 6.4167 s, Speed: 12.47 Mbps
File Size: 10 MB, Time 7.2563 s, Speed: 11.02 Mbps
Laptop->SG-1000->GS108> Cable Modem -> Internet
File Size: 10 MB, Time 34.9435 s, Speed: 2.29 Mbps File Size: 10 MB, Time 36.5176 s, Speed: 2.19 Mbps File Size: 10 MB, Time 29.9453 s, Speed: 2.67 Mbps -
and don't know if it helpful but under Status / Interfaces
WAN Interface (wan, cpsw0)
Status up DHCP up Relinquish Lease // ------- removed ip info // ------- MTU 1500 Media 1000baseT <full-duplex> In/out packets 310481711/138808790 (421.37 GiB/9.09 GiB) In/out packets (pass) 310481711/138808790 (421.37 GiB/9.09 GiB) In/out packets (block) 19878/13625 (985 KiB/927 KiB) In/out errors 0/0 Collisions 0 -
Hmm, that does seem to be an unusually high number of OUT packet blocked on WAN.
Do you see that number increase specifically when you run a test that is slow?
Do you see traffic blocked in the firewall log?
Are you running anything that might be blocking that like Snort or pfBlocker?
Steve
-
I'm not running anything that I can think of that would be blocking traffic, I have defaulted the SG-1000 as part of trying to work this out so unless there something in there by default.
the blocked out packet don't move when doing a speed test.
looking at the logs I have a few noisy devices (another rabbit hole to chase down), but most of the traffic look like android devices phones, tablets, tv, etc...
what log does the out block go to? looking at /var/log/filter.log I only see block on the in?
any who, here's a dump from the gui, if it helps.
Action Time Interface Source Destination Protocol Block Oct 1 16:10:10 LAN 192.168.1.7:51489 45.57.40.1:80 TCP:FA Block Oct 1 16:13:55 LAN 192.168.1.163:42009 172.217.167.72:443 TCP:FPA Block Oct 1 16:19:59 LAN 192.168.1.163:42703 172.217.167.78:443 TCP:PA Block Oct 1 16:19:59 LAN 192.168.1.163:42703 172.217.167.78:443 TCP:FA Block Oct 1 16:19:59 LAN 192.168.1.163:47920 68.68.111.42:443 TCP:FPA Block Oct 1 16:19:59 LAN 192.168.1.163:42703 172.217.167.78:443 TCP:FA Block Oct 1 16:20:00 LAN 192.168.1.163:42703 172.217.167.78:443 TCP:FPA Block Oct 1 16:20:32 LAN 192.168.1.163:42703 172.217.167.78:443 TCP:FPA Block Oct 1 16:21:15 LAN 192.168.1.163:42703 172.217.167.78:443 TCP:FPA Block Oct 1 16:22:04 LAN 192.168.1.163:42703 172.217.167.78:443 TCP:FPA Block Oct 1 16:22:56 LAN 192.168.1.167:11025 80.249.99.148:80 TCP:FA Block Oct 1 16:22:56 LAN 192.168.1.167:11025 80.249.99.148:80 TCP:FA Block Oct 1 16:22:58 LAN 192.168.1.167:11025 80.249.99.148:80 TCP:FA Block Oct 1 16:23:00 LAN 192.168.1.167:11025 80.249.99.148:80 TCP:FA Block Oct 1 16:23:06 LAN 192.168.1.167:11025 80.249.99.148:80 TCP:FA Block Oct 1 16:23:16 LAN 192.168.1.167:11025 80.249.99.148:80 TCP:FA Block Oct 1 16:23:38 LAN 192.168.1.167:11025 80.249.99.148:80 TCP:RA Block Oct 1 16:27:50 LAN 192.168.1.163:42703 172.217.167.78:443 TCP:FPA Block Oct 1 16:28:15 LAN 192.168.1.163:42703 172.217.167.78:443 TCP:FPA Block Oct 1 16:28:36 LAN 192.168.1.163:38590 172.217.25.170:443 TCP:PA Block Oct 1 16:28:36 LAN 192.168.1.163:38590 172.217.25.170:443 TCP:FA Block Oct 1 16:28:36 LAN 192.168.1.163:38590 172.217.25.170:443 TCP:FA Block Oct 1 16:28:37 LAN 192.168.1.163:38593 172.217.25.170:443 TCP:PA Block Oct 1 16:28:37 LAN 192.168.1.163:38593 172.217.25.170:443 TCP:FA Block Oct 1 16:28:37 LAN 192.168.1.163:38593 172.217.25.170:443 TCP:FA Block Oct 1 16:28:37 LAN 192.168.1.163:38593 172.217.25.170:443 TCP:FPA Block Oct 1 16:28:38 LAN 192.168.1.163:38593 172.217.25.170:443 TCP:FPA Block Oct 1 16:28:38 LAN 192.168.1.163:38590 172.217.25.170:443 TCP:FPA Block Oct 1 16:28:38 LAN 192.168.1.163:38593 172.217.25.170:443 TCP:FPA Block Oct 1 16:28:40 LAN 192.168.1.163:38590 172.217.25.170:443 TCP:FPA Block Oct 1 16:28:40 LAN 192.168.1.163:38593 172.217.25.170:443 TCP:FPA Block Oct 1 16:28:44 LAN 192.168.1.163:38593 172.217.25.170:443 TCP:FPA Block Oct 1 16:28:45 LAN 192.168.1.163:38590 172.217.25.170:443 TCP:FPA Block Oct 1 16:28:52 LAN 192.168.1.163:38593 172.217.25.170:443 TCP:FPA Block Oct 1 16:28:55 LAN 192.168.1.163:38590 172.217.25.170:443 TCP:FPA Block Oct 1 16:29:06 LAN 192.168.1.163:42703 172.217.167.78:443 TCP:FPA Block Oct 1 16:29:07 LAN 192.168.1.163:38593 172.217.25.170:443 TCP:FPA Block Oct 1 16:29:15 LAN 192.168.1.163:38590 172.217.25.170:443 TCP:FPA Block Oct 1 16:30:10 LAN 192.168.1.172:37268 198.142.191.76:443 TCP:FA Block Oct 1 16:30:10 LAN 192.168.1.172:37268 198.142.191.76:443 TCP:FA Block Oct 1 16:30:11 LAN 192.168.1.172:37268 198.142.191.76:443 TCP:FA Block Oct 1 16:30:12 LAN 192.168.1.172:37268 198.142.191.76:443 TCP:FA Block Oct 1 16:30:13 LAN 192.168.1.172:37268 198.142.191.76:443 TCP:FA -
It depends what exactly that is and what logging is enabled. The fact it's not showing as blocked in the firewall log by the default block rule implies it's either something that's blocked by the firewall and not logged or it's something that's blocked for some other reason like it's malformed packets.
The fact the number doesn't increase during the test implies it's probably not the cause there though.Those blocks that are shown are all out of state TCP packets and they all have destination port 443/80. That is some client acknowledging the closed TCP session after the state has been closed. Not something that should ever cause a problem.
Try running at the command line when you are doing the test
top -aSH. Hit q to stop during the test and you can copy-paste the output here. That should show if you're hitting CPU limitation somehow.Steve
-
I don't see any limiting?
last pid: 1645; load averages: 1.39, 2.81, 2.73 up 11:13:16 05:21:47 143 processes: 2 running, 111 sleeping, 8 zombie, 22 waiting CPU: 7.0% user, 0.0% nice, 1.3% system, 33.4% interrupt, 58.2% idle Mem: 22M Active, 96M Inact, 109M Wired, 25M Buf, 256M Free Swap: -
No, 52% idle looks fine. It would be good to see what is using the CPU though.
Steve
-
the
top -aSHtable while running a test looks like:PID USERNAME PRI NICE SIZE RES STATE TIME WCPU COMMAND 10 root 155 ki31 0K 8K RUN 108.5H 58.04% [idle] 11 root -92 - 0K 176K WAIT 835:47 32.13% [intr{aintc0,41: cpswss0}] 16636 root 40 0 7312K 3316K RUN 0:00 1.14% top -aSH 42430 unbound 4 0 25860K 19020K kqread 2:59 0.89% /usr/local/sbin/unbound -c /var/unbound/unbound.conf 34579 root -74 0 9612K 5100K bpf 6:19 0.84% /usr/local/bandwidthd/bandwidthd 34606 root -74 0 9612K 4988K bpf 6:21 0.81% /usr/local/bandwidthd/bandwidthd 33594 root -74 0 9612K 4988K bpf 6:18 0.80% /usr/local/bandwidthd/bandwidthd 34645 root -74 0 9612K 4988K bpf 6:55 0.79% /usr/local/bandwidthd/bandwidthd 33307 root -74 0 9612K 5100K bpf 6:17 0.78% /usr/local/bandwidthd/bandwidthd 33845 root -74 0 9612K 4988K bpf 6:51 0.78% /usr/local/bandwidthd/bandwidthd 34294 root -74 0 11660K 5904K bpf 6:20 0.78% /usr/local/bandwidthd/bandwidthd 33258 root -74 0 11660K 5904K bpf 6:19 0.76% /usr/local/bandwidthd/bandwidthd 11 root -60 - 0K 176K WAIT 56:17 0.74% [intr{swi4: clock (0)}] 11 root -92 - 0K 176K WAIT 15:11 0.23% [intr{aintc0,42: cpswss0}] 6 root -16 - 0K 8K pftm 13:01 0.15% [pf purge] 11 root -88 - 0K 176K WAIT 3:16 0.09% [intr{aintc0,28: +}] 5606 root 40 0 10900K 6220K select 0:00 0.09% sshd: root@pts/0 (sshd) 55346 root 8 0 6600K 2036K nanslp 0:52 0.06% [dpinger{dpinger}] 21670 dhcpd 40 0 10088K 5636K select 0:25 0.05% /usr/local/sbin/dhcpd -user dhcpd -group _dhcp -chroot /var/dhcpd -cf /etc/dhcpd.conf -pf /var/run/dhcpd.pid cpsw1 27 root -16 - 0K 8K - 2:22 0.04% [schedcpu] 7 root -16 - 0K 8K - 2:06 0.03% [rand_harvestq] 25 root 16 - 0K 8K syncer 1:10 0.03% [syncer] 42349 root 40 0 9296K 9324K select 6:23 0.03% /usr/local/sbin/ntpd -g -c /var/etc/ntpd.conf -p /var/run/ntpd.pid{ntpd} 17 root -8 - 0K 8K mmcreq 0:31 0.03% [mmcsd0: mmc/sd card] 13 root -8 - 0K 24K - 0:41 0.02% [geom{g_up}] 55346 root 4 0 6600K 2036K sbwait 0:13 0.02% [dpinger{dpinger}] 345 root 4 0 57004K 20176K kqread 1:02 0.02% php-fpm: master process (/usr/local/lib/php-fpm.conf) (php-fpm) 23 root -16 - 0K 16K sdflus 0:40 0.01% [bufdaemon{/ worker}] 15489 root -74 0 6216K 1968K bpf 1:24 0.01% /usr/local/sbin/filterlog -i pflog0 -p /var/run/filterlog.pid 55346 root 8 0 6600K 2036K nanslp 0:08 0.01% [dpinger{dpinger}] 13 root -8 - 0K 24K - 0:15 0.01% [geom{g_down}] 20 root -16 - 0K 24K psleep 0:30 0.01% [pagedaemon{dom0}] 14 root -68 - 0K 80K - 0:06 0.00% [usb{usbus0}] 23 root -16 - 0K 16K psleep 0:11 0.00% [bufdaemon{bufdaemon}] 26 root -4 - 0K 8K vlruwt 0:08 0.00% [vnlru] 24 root -8 - 0K 8K - 0:07 0.00% [bufspacedaemon] 14 root -68 - 0K 80K - 0:06 0.00% [usb{usbus1}] 0 root 8 - 0K 56K - 0:01 0.00% [kernel{thread taskq}] 11 root -72 - 0K 176K WAIT 1:39 0.00% [intr{swi1: netisr 0}] 67923 root 40 0 5940K 2736K select 1:22 0.00% /usr/local/sbin/radvd -p /var/run/radvd.pid -C /var/etc/radvd.conf -m syslog 18908 root 8 20 6500K 2316K wait 1:19 0.00% /bin/sh /var/db/rrd/updaterrd.sh 9173 root 40 0 6068K 2144K select 0:46 0.00% /usr/sbin/syslogd -s -c -c -l /var/dhcpd/var/run/log -P /var/run/syslog.pid -f /etc/syslog.conf 85600 root -52 r0 2312K 2332K nanslp 0:45 0.00% /usr/sbin/watchdogd -t 128 71064 root 4 0 59316K 27136K accept 0:40 0.00% php-fpm: pool nginx (php-fpm){php-fpm} 19538 root 4 0 59316K 26972K accept 0:37 0.00% php-fpm: pool nginx (php-fpm){php-fpm} 40648 root 4 0 59184K 25892K accept 0:34 0.00% php-fpm: pool nginx (php-fpm) 61446 root 4 0 22092K 6792K kqread 0:10 0.00% nginx: worker process (nginx) 61439 root 4 0 22092K 7444K kqread 0:08 0.00% nginx: worker process (nginx) 41794 root 8 0 6028K 2056K nanslp 0:06 0.00% /usr/sbin/cron -s 0 root -16 - 0K 56K swapin 0:06 0.00% [kernel{swapper}] 60 root -8 - 0K 8K mdwait 0:03 0.00% [md0] 37825 root 8 0 5980K 1868K nanslp 0:02 0.00% /usr/libexec/getty al.Pc ttyv0 13084 _dhcp 40 0 6104K 2116K select 0:02 0.00% dhclient: cpsw0 (dhclient) 38434 root 8 0 6224K 2052K nanslp 0:02 0.00% /usr/local/libexec/sshg-blocker -s 3600{sshg-blocker} 35129 root 40 0 6292K 2248K select 0:01 0.00% /usr/local/sbin/xinetd -syslog daemon -f /var/etc/xinetd.conf -pidfile /var/run/xinetd.pid 10315 root 8 0 5864K 1648K nanslp 0:01 0.00% minicron: helper /usr/local/bin/ping_hosts.sh (minicron) 400 root 40 0 6988K 3736K select 0:01 0.00% /sbin/devd -q -f /etc/pfSense-devd.conf 55346 root 4 0 6600K 2036K accept 0:00 0.00% [dpinger{dpinger}] 11 root -76 - 0K 176K WAIT 0:00 0.00% [intr{swi0: uart}] 13 root -8 - 0K 24K - 0:00 0.00% [geom{g_event}] 385 root 4 20 8024K 3604K kqread 0:00 0.00% /usr/local/sbin/check_reload_status 9 root -16 - 0K 8K - 0:00 0.00% [soaiod2] 15 root -16 - 0K 8K - 0:00 0.00% [soaiod3] 16 root -16 - 0K 8K - 0:00 0.00% [soaiod4] 8 root -16 - 0K 8K - 0:00 0.00% [soaiod1] 1 root 8 0 4916K 752K wait 0:00 0.00% [init] 14040 root 16 0 6820K 3088K pause 0:00 0.00% /bin/tcsh 10949 root 8 0 5864K 1652K nanslp 0:00 0.00% minicron: helper /usr/local/sbin/fcgicli -f /etc/rc.expireaccounts (minicron) 38037 root 8 0 6392K 2368K wait 0:00 0.00% login [pam] (login) 39569 root 40 0 6500K 2308K ttyin 0:00 0.00% /bin/sh /etc/rc.initial 6046 root 8 0 6500K 2308K wait 0:00 0.00% /bin/sh /etc/rc.initial 5818 root 8 0 6500K 2392K wait 0:00 0.00% -sh (sh) 39049 root 8 0 6500K 2396K wait 0:00 0.00% -sh (sh) 59918 root 40 0 10848K 5760K select 0:00 0.00% /usr/sbin/sshd 38420 root -8 0 11304K 4876K piperd 0:00 0.00% /usr/local/libexec/sshg-parser 38270 root 8 0 6500K 2044K wait 0:00 0.00% /bin/sh /usr/local/sbin/sshguard 22 root 155 ki31 0K 8K pgzero 0:00 0.00% [pagezero] -
Hmm, nothing much happening there besides the NIC interrupt load which is what you would expect. Definitely not CPU limited then. What sort of throughput were you seeing when that was shown?
Steve
-
Still had it on the screen
File Size: 50 MB, Time: 118.0096 s, Speed: 3.39 Mbps -
Don't know if this would help, but I found a file with in my ISP network that gave me near top speed for testing.
I now get only ~3% idle cpu and a ~27% reduction in throughput instead of a ~76% reduction when testing
http://speedcheck.cdn.on.net/100meg.test direct to cable modem
File Size: 100 MB, Time: 10.6448 s, Speed: 75.15 Mbps
File Size: 100 MB, Time: 10.4513 s, Speed: 76.55 Mbps
File Size: 100 MB, Time: 10.3895 s, Speed: 77.00 Mbps
http://speedcheck.cdn.on.net/100meg.test throught SG-1000
File Size: 100 MB, Time: 14.1694 s, Speed: 56.46 Mbps
File Size: 100 MB, Time: 14.3546 s, Speed: 55.73 Mbps
File Size: 100 MB, Time: 14.5417 s, Speed: 55.01 Mbps
134 processes: 2 running, 110 sleeping, 22 waiting CPU: 11.9% user, 0.0% nice, 11.9% system, 73.5% interrupt, 2.7% idle Mem: 26M Active, 80M Inact, 109M Wired, 25M Buf, 268M Free Swap:PID USERNAME PRI NICE SIZE RES STATE TIME WCPU COMMAND 11 root -92 - 0K 176K WAIT 843:37 71.11% 10 root 155 ki31 0K 8K RUN 110.0H 3.66% 53297 root -74 0 9612K 4460K bpf 0:00 1.68% /usr/local/bandwidthd/bandwidthd 53284 root -74 0 9612K 4460K bpf 0:00 1.68% /usr/local/bandwidthd/bandwidthd 53748 root -74 0 9612K 4460K bpf 0:00 1.67% /usr/local/bandwidthd/bandwidthd 54507 root -74 0 9612K 4460K bpf 0:00 1.67% /usr/local/bandwidthd/bandwidthd 54421 root -74 0 9612K 4460K bpf 0:00 1.66% /usr/local/bandwidthd/bandwidthd 54133 root -74 0 9612K 4460K bpf 0:00 1.66% /usr/local/bandwidthd/bandwidthd 53617 root -74 0 9612K 4460K bpf 0:00 1.65% /usr/local/bandwidthd/bandwidthd 54145 root -74 0 9612K 4460K bpf 0:00 1.62% /usr/local/bandwidthd/bandwidthd 9275 unbound 4 0 21764K 12948K kqread 0:02 1.19% /usr/local/sbin/unbound -c /var/unbound/unbound.conf 72982 root 43 0 7312K 3172K RUN 0:00 1.12% top -aSH how much of throughput reduction would be expected when putting the SG-1000 inline?
-
I have tested the SG-1000 to at lest 125Mbps so I would not expect any reduction on a 100Mb line. At least not limited by CPU.
Steve
-
Thank you @stephenw10, do you have any suggestions on what I can try next to figure out why I'm seeing a reduction in throughput?
Do I need to capture traffic logs? I should be able to do that on the laptop.
-
Yes if you're able to capture test traffic we should be able to see any TCP weirdness for example.
Steve
-
Sorry for the slow update, work got in the way. anyways got some capture data and anonymised it, They can be found on this onedrive share pcapng files.
I could see anything that jumped out but then again I'm not really sure what I should be looking for.
-
Great. Ok those captures are ~55Mbps via the SG-1000 and ~75Mbps direct? Rather than one of the very low numbers you saw previously like 2Mbps?
Steve
-
Take a look at your window size.. Looks be huge different in size between when your running through sg1000 an when not... So yeah that would DRASTICALLY affect your overall download speed..
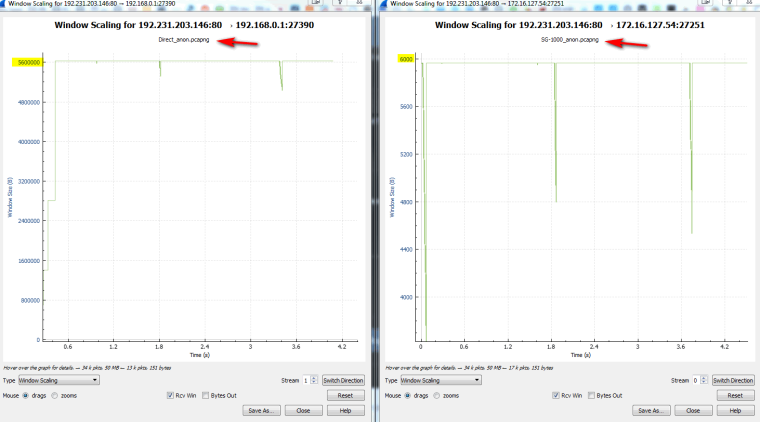
Also seeing lots of retrans in your sg1000 sniff..
Where exactly was this sniff taken, at the client or on the sg1000?