SG-1000 throughput slow down
-
I don't see any limiting?
last pid: 1645; load averages: 1.39, 2.81, 2.73 up 11:13:16 05:21:47 143 processes: 2 running, 111 sleeping, 8 zombie, 22 waiting CPU: 7.0% user, 0.0% nice, 1.3% system, 33.4% interrupt, 58.2% idle Mem: 22M Active, 96M Inact, 109M Wired, 25M Buf, 256M Free Swap: -
No, 52% idle looks fine. It would be good to see what is using the CPU though.
Steve
-
the
top -aSHtable while running a test looks like:PID USERNAME PRI NICE SIZE RES STATE TIME WCPU COMMAND 10 root 155 ki31 0K 8K RUN 108.5H 58.04% [idle] 11 root -92 - 0K 176K WAIT 835:47 32.13% [intr{aintc0,41: cpswss0}] 16636 root 40 0 7312K 3316K RUN 0:00 1.14% top -aSH 42430 unbound 4 0 25860K 19020K kqread 2:59 0.89% /usr/local/sbin/unbound -c /var/unbound/unbound.conf 34579 root -74 0 9612K 5100K bpf 6:19 0.84% /usr/local/bandwidthd/bandwidthd 34606 root -74 0 9612K 4988K bpf 6:21 0.81% /usr/local/bandwidthd/bandwidthd 33594 root -74 0 9612K 4988K bpf 6:18 0.80% /usr/local/bandwidthd/bandwidthd 34645 root -74 0 9612K 4988K bpf 6:55 0.79% /usr/local/bandwidthd/bandwidthd 33307 root -74 0 9612K 5100K bpf 6:17 0.78% /usr/local/bandwidthd/bandwidthd 33845 root -74 0 9612K 4988K bpf 6:51 0.78% /usr/local/bandwidthd/bandwidthd 34294 root -74 0 11660K 5904K bpf 6:20 0.78% /usr/local/bandwidthd/bandwidthd 33258 root -74 0 11660K 5904K bpf 6:19 0.76% /usr/local/bandwidthd/bandwidthd 11 root -60 - 0K 176K WAIT 56:17 0.74% [intr{swi4: clock (0)}] 11 root -92 - 0K 176K WAIT 15:11 0.23% [intr{aintc0,42: cpswss0}] 6 root -16 - 0K 8K pftm 13:01 0.15% [pf purge] 11 root -88 - 0K 176K WAIT 3:16 0.09% [intr{aintc0,28: +}] 5606 root 40 0 10900K 6220K select 0:00 0.09% sshd: root@pts/0 (sshd) 55346 root 8 0 6600K 2036K nanslp 0:52 0.06% [dpinger{dpinger}] 21670 dhcpd 40 0 10088K 5636K select 0:25 0.05% /usr/local/sbin/dhcpd -user dhcpd -group _dhcp -chroot /var/dhcpd -cf /etc/dhcpd.conf -pf /var/run/dhcpd.pid cpsw1 27 root -16 - 0K 8K - 2:22 0.04% [schedcpu] 7 root -16 - 0K 8K - 2:06 0.03% [rand_harvestq] 25 root 16 - 0K 8K syncer 1:10 0.03% [syncer] 42349 root 40 0 9296K 9324K select 6:23 0.03% /usr/local/sbin/ntpd -g -c /var/etc/ntpd.conf -p /var/run/ntpd.pid{ntpd} 17 root -8 - 0K 8K mmcreq 0:31 0.03% [mmcsd0: mmc/sd card] 13 root -8 - 0K 24K - 0:41 0.02% [geom{g_up}] 55346 root 4 0 6600K 2036K sbwait 0:13 0.02% [dpinger{dpinger}] 345 root 4 0 57004K 20176K kqread 1:02 0.02% php-fpm: master process (/usr/local/lib/php-fpm.conf) (php-fpm) 23 root -16 - 0K 16K sdflus 0:40 0.01% [bufdaemon{/ worker}] 15489 root -74 0 6216K 1968K bpf 1:24 0.01% /usr/local/sbin/filterlog -i pflog0 -p /var/run/filterlog.pid 55346 root 8 0 6600K 2036K nanslp 0:08 0.01% [dpinger{dpinger}] 13 root -8 - 0K 24K - 0:15 0.01% [geom{g_down}] 20 root -16 - 0K 24K psleep 0:30 0.01% [pagedaemon{dom0}] 14 root -68 - 0K 80K - 0:06 0.00% [usb{usbus0}] 23 root -16 - 0K 16K psleep 0:11 0.00% [bufdaemon{bufdaemon}] 26 root -4 - 0K 8K vlruwt 0:08 0.00% [vnlru] 24 root -8 - 0K 8K - 0:07 0.00% [bufspacedaemon] 14 root -68 - 0K 80K - 0:06 0.00% [usb{usbus1}] 0 root 8 - 0K 56K - 0:01 0.00% [kernel{thread taskq}] 11 root -72 - 0K 176K WAIT 1:39 0.00% [intr{swi1: netisr 0}] 67923 root 40 0 5940K 2736K select 1:22 0.00% /usr/local/sbin/radvd -p /var/run/radvd.pid -C /var/etc/radvd.conf -m syslog 18908 root 8 20 6500K 2316K wait 1:19 0.00% /bin/sh /var/db/rrd/updaterrd.sh 9173 root 40 0 6068K 2144K select 0:46 0.00% /usr/sbin/syslogd -s -c -c -l /var/dhcpd/var/run/log -P /var/run/syslog.pid -f /etc/syslog.conf 85600 root -52 r0 2312K 2332K nanslp 0:45 0.00% /usr/sbin/watchdogd -t 128 71064 root 4 0 59316K 27136K accept 0:40 0.00% php-fpm: pool nginx (php-fpm){php-fpm} 19538 root 4 0 59316K 26972K accept 0:37 0.00% php-fpm: pool nginx (php-fpm){php-fpm} 40648 root 4 0 59184K 25892K accept 0:34 0.00% php-fpm: pool nginx (php-fpm) 61446 root 4 0 22092K 6792K kqread 0:10 0.00% nginx: worker process (nginx) 61439 root 4 0 22092K 7444K kqread 0:08 0.00% nginx: worker process (nginx) 41794 root 8 0 6028K 2056K nanslp 0:06 0.00% /usr/sbin/cron -s 0 root -16 - 0K 56K swapin 0:06 0.00% [kernel{swapper}] 60 root -8 - 0K 8K mdwait 0:03 0.00% [md0] 37825 root 8 0 5980K 1868K nanslp 0:02 0.00% /usr/libexec/getty al.Pc ttyv0 13084 _dhcp 40 0 6104K 2116K select 0:02 0.00% dhclient: cpsw0 (dhclient) 38434 root 8 0 6224K 2052K nanslp 0:02 0.00% /usr/local/libexec/sshg-blocker -s 3600{sshg-blocker} 35129 root 40 0 6292K 2248K select 0:01 0.00% /usr/local/sbin/xinetd -syslog daemon -f /var/etc/xinetd.conf -pidfile /var/run/xinetd.pid 10315 root 8 0 5864K 1648K nanslp 0:01 0.00% minicron: helper /usr/local/bin/ping_hosts.sh (minicron) 400 root 40 0 6988K 3736K select 0:01 0.00% /sbin/devd -q -f /etc/pfSense-devd.conf 55346 root 4 0 6600K 2036K accept 0:00 0.00% [dpinger{dpinger}] 11 root -76 - 0K 176K WAIT 0:00 0.00% [intr{swi0: uart}] 13 root -8 - 0K 24K - 0:00 0.00% [geom{g_event}] 385 root 4 20 8024K 3604K kqread 0:00 0.00% /usr/local/sbin/check_reload_status 9 root -16 - 0K 8K - 0:00 0.00% [soaiod2] 15 root -16 - 0K 8K - 0:00 0.00% [soaiod3] 16 root -16 - 0K 8K - 0:00 0.00% [soaiod4] 8 root -16 - 0K 8K - 0:00 0.00% [soaiod1] 1 root 8 0 4916K 752K wait 0:00 0.00% [init] 14040 root 16 0 6820K 3088K pause 0:00 0.00% /bin/tcsh 10949 root 8 0 5864K 1652K nanslp 0:00 0.00% minicron: helper /usr/local/sbin/fcgicli -f /etc/rc.expireaccounts (minicron) 38037 root 8 0 6392K 2368K wait 0:00 0.00% login [pam] (login) 39569 root 40 0 6500K 2308K ttyin 0:00 0.00% /bin/sh /etc/rc.initial 6046 root 8 0 6500K 2308K wait 0:00 0.00% /bin/sh /etc/rc.initial 5818 root 8 0 6500K 2392K wait 0:00 0.00% -sh (sh) 39049 root 8 0 6500K 2396K wait 0:00 0.00% -sh (sh) 59918 root 40 0 10848K 5760K select 0:00 0.00% /usr/sbin/sshd 38420 root -8 0 11304K 4876K piperd 0:00 0.00% /usr/local/libexec/sshg-parser 38270 root 8 0 6500K 2044K wait 0:00 0.00% /bin/sh /usr/local/sbin/sshguard 22 root 155 ki31 0K 8K pgzero 0:00 0.00% [pagezero] -
Hmm, nothing much happening there besides the NIC interrupt load which is what you would expect. Definitely not CPU limited then. What sort of throughput were you seeing when that was shown?
Steve
-
Still had it on the screen
File Size: 50 MB, Time: 118.0096 s, Speed: 3.39 Mbps -
Don't know if this would help, but I found a file with in my ISP network that gave me near top speed for testing.
I now get only ~3% idle cpu and a ~27% reduction in throughput instead of a ~76% reduction when testing
http://speedcheck.cdn.on.net/100meg.test direct to cable modem
File Size: 100 MB, Time: 10.6448 s, Speed: 75.15 Mbps
File Size: 100 MB, Time: 10.4513 s, Speed: 76.55 Mbps
File Size: 100 MB, Time: 10.3895 s, Speed: 77.00 Mbps
http://speedcheck.cdn.on.net/100meg.test throught SG-1000
File Size: 100 MB, Time: 14.1694 s, Speed: 56.46 Mbps
File Size: 100 MB, Time: 14.3546 s, Speed: 55.73 Mbps
File Size: 100 MB, Time: 14.5417 s, Speed: 55.01 Mbps
134 processes: 2 running, 110 sleeping, 22 waiting CPU: 11.9% user, 0.0% nice, 11.9% system, 73.5% interrupt, 2.7% idle Mem: 26M Active, 80M Inact, 109M Wired, 25M Buf, 268M Free Swap:PID USERNAME PRI NICE SIZE RES STATE TIME WCPU COMMAND 11 root -92 - 0K 176K WAIT 843:37 71.11% 10 root 155 ki31 0K 8K RUN 110.0H 3.66% 53297 root -74 0 9612K 4460K bpf 0:00 1.68% /usr/local/bandwidthd/bandwidthd 53284 root -74 0 9612K 4460K bpf 0:00 1.68% /usr/local/bandwidthd/bandwidthd 53748 root -74 0 9612K 4460K bpf 0:00 1.67% /usr/local/bandwidthd/bandwidthd 54507 root -74 0 9612K 4460K bpf 0:00 1.67% /usr/local/bandwidthd/bandwidthd 54421 root -74 0 9612K 4460K bpf 0:00 1.66% /usr/local/bandwidthd/bandwidthd 54133 root -74 0 9612K 4460K bpf 0:00 1.66% /usr/local/bandwidthd/bandwidthd 53617 root -74 0 9612K 4460K bpf 0:00 1.65% /usr/local/bandwidthd/bandwidthd 54145 root -74 0 9612K 4460K bpf 0:00 1.62% /usr/local/bandwidthd/bandwidthd 9275 unbound 4 0 21764K 12948K kqread 0:02 1.19% /usr/local/sbin/unbound -c /var/unbound/unbound.conf 72982 root 43 0 7312K 3172K RUN 0:00 1.12% top -aSH how much of throughput reduction would be expected when putting the SG-1000 inline?
-
I have tested the SG-1000 to at lest 125Mbps so I would not expect any reduction on a 100Mb line. At least not limited by CPU.
Steve
-
Thank you @stephenw10, do you have any suggestions on what I can try next to figure out why I'm seeing a reduction in throughput?
Do I need to capture traffic logs? I should be able to do that on the laptop.
-
Yes if you're able to capture test traffic we should be able to see any TCP weirdness for example.
Steve
-
Sorry for the slow update, work got in the way. anyways got some capture data and anonymised it, They can be found on this onedrive share pcapng files.
I could see anything that jumped out but then again I'm not really sure what I should be looking for.
-
Great. Ok those captures are ~55Mbps via the SG-1000 and ~75Mbps direct? Rather than one of the very low numbers you saw previously like 2Mbps?
Steve
-
Take a look at your window size.. Looks be huge different in size between when your running through sg1000 an when not... So yeah that would DRASTICALLY affect your overall download speed..
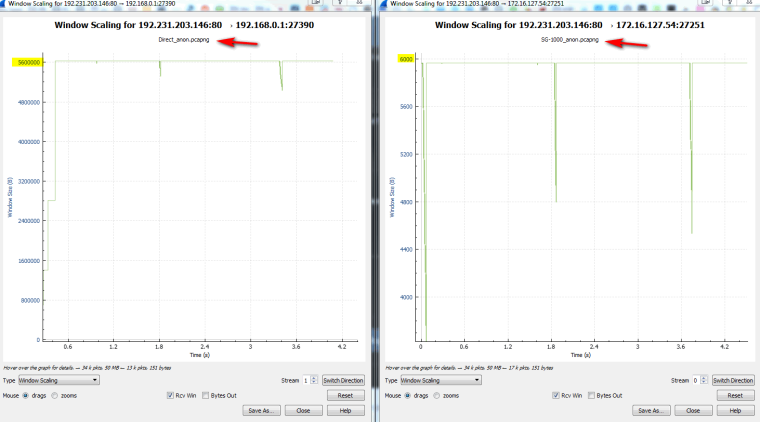
Also seeing lots of retrans in your sg1000 sniff..
Where exactly was this sniff taken, at the client or on the sg1000?
-
Hmm, this is interesting. One of us appears to have a borked wireshark and it's probably me. I'm showing that same window scaling issue but it's in the other direction. But that appears to agree with the actual packet data....

The direction I'm interested in, Remote server to private IP, seems ungraphable. Hence probably me!
-
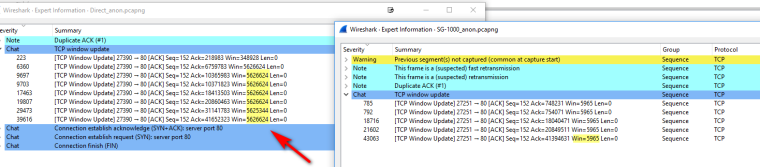
Well the one sniff has some issues - doesn't look like it caught the syn?
Clearly something going on there.. Would like to see cleaner sniffs and tests - and where exactly is the sniff being done at?
-
Hi,
The sniff was done on the laptop as I needed to bypass the SG-1000 for one of the test.I can do another sniff from the SG-1000 if that would help? You also said you would like to see a clean capture? What would you like me to do here.
All I did on this sniff was to filter for the remote address in src and dst then ran it through a anonymiser for posting.
And yes I found a down load source that gives me a good speed on my ISP but as you see it still has a reduction through the SG-1000.
Thanks for having a look.
-
Clean in the fact the sg1000 sniff is missing the start of the conversation.. I show it seeming to miss the start of conversation.
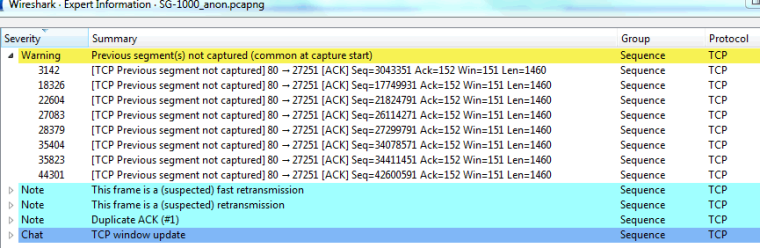
So not sure if you caught the tail end of one speed test and then started another, etc..
But from sg1000 sniff having way smaller window size then yeah the speed of that speed test is going to be slower..
-
Thanks @johnpoz,
When I get chance I'll redo the sg-1000 sniff, do you have any ideas on why the windows size would be different?The only thing I can think of is, I was lazy and ran my sg-1000 sniff over my home network i.e laptop->switch->switch->sg-1000->cable modem, I'll try the sniff directly connected to the sg-1000 next time to see if that helps.
For a bit of info:
The two switches ara a WNDR3709 running OpenWRT for AP and a GS108. The laptop was on a wired connection laptop->GS108->WNDR3709->SG-1000->Cable Modem.stuck at work for the next 10-12hrs so I can't do any test for a bit.
-
Ok uploaded 2 more sniffs (got real slow connection tonight) same link pcapng files
this time I connected to the SG-1000 direct and then the cable modem direct, but may have to do the test once ISP network gets back up to speed.
anyways have a look and see if you see anything strange.
Thanks.
-
Your still not catching the start in the direct sniff.. But again your window resize are no where close to each other... So yeah no shit your download is going to be way slower!!
Your window size when your direct is huge compared to when your on the sg1000 per those sniffs
You running a proxy or something on pfsense? If I had to guess to why your seeing the smaller windowsize have to guess its due to your dupes or fast retrans..
Not allowing the windowsize to grow... But that is just a GUESS!!! If you want to benchmark the sg1000 and what it can do you really need to make sure environment is the same in both your tests. So take the isp and the internet out of the equation and put a server on your wan, and then your client on the lan -- do your speedtesting, iperf, download off a http, etc. But can promise you this if your window size is that small compared to when it grows large then yeah your going to see a real speed difference..
-
Ok run a test with ipef3 running on a RPI on the wan side, ran the test 3 time in each setup and the sniffs are only filtered on the RPI address 10.0.0.2 dis and src, so hopefully it should have got all the info.
Test 1:
PC->GS108->SG-1000->RPI: wireshark 20181012_Filter_SG-1000.pcapngTest 2:
PC->RPI: wireshark 20181012_Filter_Direct.pcapngBoth file can be found at the same link pcapng files
Thanks.