Playing with fq_codel in 2.4
-
a comparison plot is easier if you make your -t 'text-to-be-included-in-plot' actually meaningful. :)
-
Flent files for ack-filter/ecn:
0_1539273758800_rrul-2018-10-11T155505.344180.text-to-be-included-in-plot.flent.gz
-
@dtaht lol - ok - if you don't mind, give me the command line for what you want me to run, it'll be easier than for me looking through the gazillion test/combinations/options. Sure, text is easy, but let me know what other tests you want me to run:)
-
I can fix it in post, but for a future run of any given new thing, it helps minute, hours, or months later if you run it with a meaningful title...
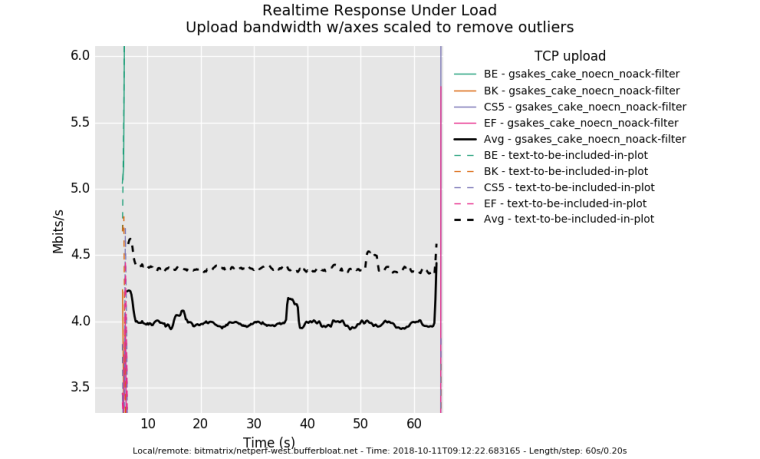
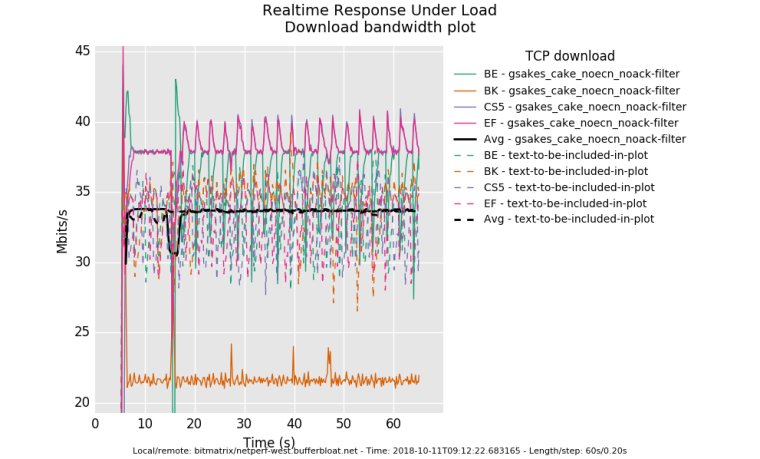
-t 'gsakes_cake_noecn_noack-filter'
or use the --notes option so you capture more of the basic test parameters.
I'm personally sitting on top of a few hundred thousand rrul tests....
Anyway, would love the prior noecn noackfilter test flent file before I try to get to bed
-
@dtaht said in Playing with fq_codel in 2.4:
gsakes_cake_noecn_noack-filter'
Sure thing:
0_1539274464800_rrul-2018-10-11T161222.683165.gsakes_cake_noecn_noack-filter.flent.gz -
@dtaht (facepalm) - Oh, I see - Flent's got a rather nice gui, now it makes sense:)
-
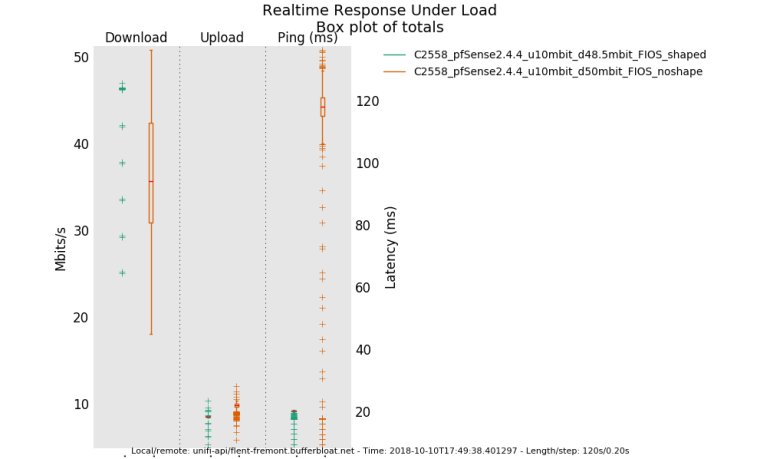
going back to the fios example earlier. having fq_codel shaping at 48mbit appears to get more bandwidth than fios with 120ms worth of buffering at 50mbit does. Why? You get a drop, it takes 120ms to start recovery, you get a drop at the end of that recovery and the process repeats. Someone tell FIOS that engineering their fiber network to speedtest only works for 20 seconds.....
It's kind of hard to see at this resolution but the green line's median and whiskers are locked solid at 48mbit while the other... (btw, I should go pull the actual data transferred out of flent, I didn't, but you can't actually trust it due to 120ms worth of occilation, anyway, but improved bandwidth here is real. As is the lowered latency.
-
Hey all,
here are some measurements
Setup:
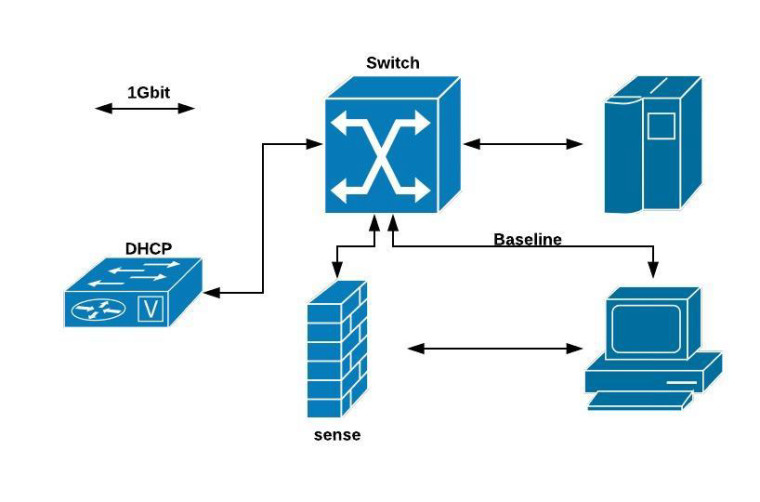
Baseline measurement: Pc1 - Pc2 just via switch no sense involved:
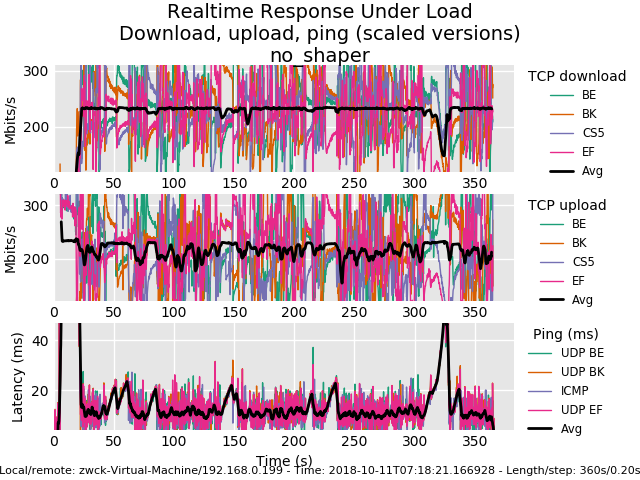
0_1539274374287_rrul-2018-10-11T071821.166928.no_shaper_vm_to_vm.flent.gz
Measurement with sense without shaper:
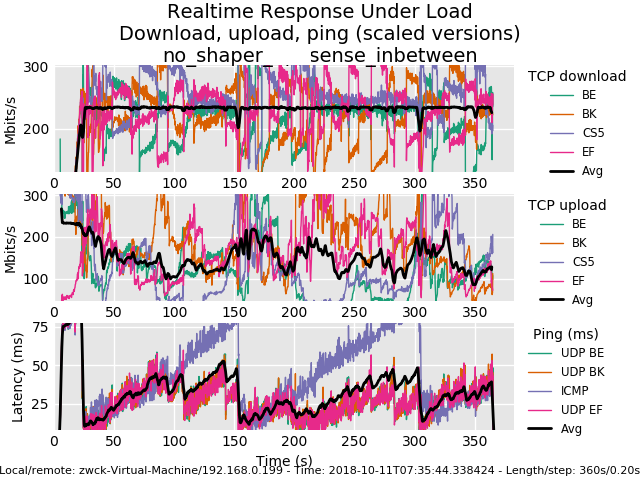
0_1539274525822_rrul-2018-10-11T073544.338424.no_shaper_sense_inbetween.flent.gz
Then I started shaping/playing around(no methodology involved) to 100/100Mbit and played with tuneables.
For me the only tuneables that were usefull were:machdep.hyperthreading_allowed="0" hw.igb.rx_process_limit="-1"For the setup i found out that i only adjusted quantum and turned off ecn.
10000: 800.000 Mbit/s    0 ms burst 0
q75536  50 sl. 0 flows (1 buckets) sched 10000 weight 0 lmax 0 pri 0 droptail
 sched 10000 type FQ_CODEL flags 0x0 0 buckets 0 active
 FQ_CODEL target 5ms interval 100ms quantum 1518 limit 10240 flows 1024 NoECN
   Children flowsets: 10000
10001: 800.000 Mbit/s    0 ms burst 0
q75537  50 sl. 0 flows (1 buckets) sched 10001 weight 0 lmax 0 pri 0 droptail
 sched 10001 type FQ_CODEL flags 0x0 1024 buckets 0 active
 FQ_CODEL target 5ms interval 100ms quantum 1518 limit 10240 flows 1024 NoECN
   Children flowsets: 10001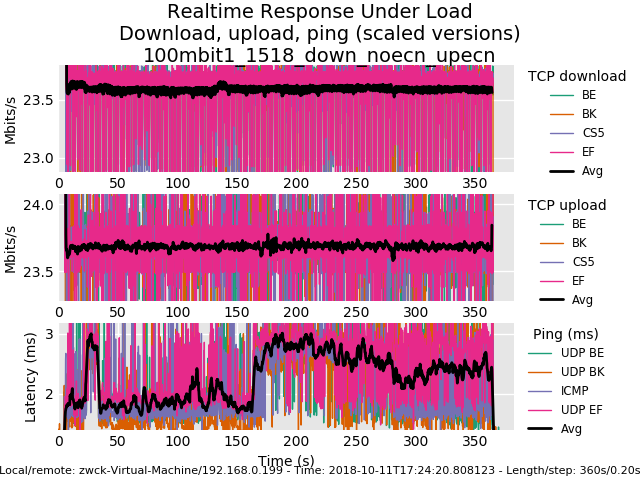
0_1539274939477_rrul-2018-10-11T172420.808123.100mbit1_1518_down_noecn_upecn.flent.gz
Finally i went up to 800Mbit
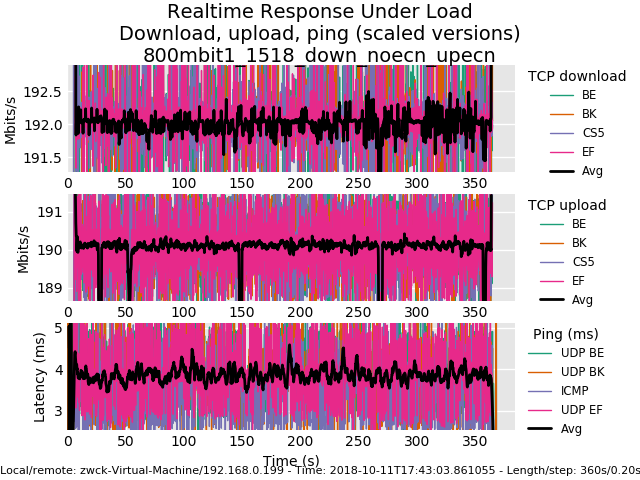
0_1539274972854_rrul-2018-10-11T174303.861055.800mbit1_1518_down_noecn_upecn.flent.gz
maybe its interesting :D
-
@gsakes heh. You were living this whole time at the command line? flent-gui *.flent.gz hit view->everything, select two or more files from the open files, select a different plot type like cdf, switch files around in the tabs.
I run this thing sometimes against 30+ test runs - it uses up every core you have to predict that next plot - it's just amazing tool... it's why we succeeded where others in the field are still painfully looking at tcptrace'd packet captures....
I would knight toke if I could.
anyway, good, thx for the data! cake with ack filtering is actually slightly higher latency than without (it gets rid of more little packets so more big ones fit in), you got .35mbits extra out of your 5mbit uplink, and something in the noise hit you...
And this shows how tcp occilate less (for the same throughput) by using ecn rather than drop for congestion control.
It's subtle, at this rtt, but you can see how data is bursty ? that's head of line blocking for a 35ms rtt against the 20ms sample rate.
a tcpdump is good for observing this.
I've noted earlier that I'm not all that huge on ecn. I can totally live with tcp blocking for 35ms (compared to hundreds of the pre-fq_codel-era) and with drop as the sole indicator of congestion. At rtts of greater than 100ms for human interactive traffic, well, ok, ecn might be good... but for that I stopped using ssh and switched to mosh.
wide deployment of ecn worries me. But it's happening anyway and why not get more folk playing with it while being aware we might break the internet with it...
there's other benefits in cake like per host fq... kind of hard to test with using this. One example of seeing per host fq work better is to load up a web page benchmark of some (sane) kind on a different box while rruning things like the rrul. We used to use chrome web page benchmarker, but that broke... even then fq_codel still does really well on web traffic...
... those extra .35 mbits from the ack-filter came hard. 6 months worth of work by 5 people.... over 9 months total... 12 if you include the initial research into the rfcs.
-
@dtaht heh, that'll teach me to start using new tools at 03:30am in the morning - yeah totally tunneled on flent, didn't even bother looking at the GUI:)
Yep, I get slightly better results turning off ecn, but leaving ack filter on - less latency, very slightly less throughput. What you and the bufferteam did was well worth it; I'm going to call this 'QOS 2.0' even though the term might already exist:)

-
All this flent testing was a bit inspiring. So I just setup a new server in linode's cloud, in singapore.taht.net . Turns out their current default distro enables fq_codel by default and also bbr. flent and irtt were part of their ubuntu 18.04 LTS package set, so a few minutes later I had a server running. I left the default to cubic. Three things to note:
A) At such a long rtt, there is no tcp that will work particularly well. Built into BBR is a RTT check which I think defaults to 200ms, and singapore is 190ms from california. BBR's primary use case is from a datacenter usually located MUCH closer to you.
If you are located on, like, the island of mauritus (as one of our more devout testers is), his typical rtt was 320ms and he found it necessary to up target and interval to 30 and 300 respectively.
B) fq_codel has two tunables that normally you shouldn't touch. target is the target local delay, and should be 5%-10% of the interval except when that 5% is greater than the MTU and I fudge factor that even more at lower bandwidths. 5ms is a good default above 4Mbit. The interval should be your normal (say 90%) maximum rtt for the flows you have in your locality. So if you are in england, you can fiddle with lower RTTs - like 30!, on the continent, I've seen people using 60 - and in most cases, 100 is just fine.
on wifi we found it helpful to up the target to 20ms during our early tests, in my deployment on real networks, I'm finding 5% to be "just fine", but 20 is the kernel default. I would like to make that tunable.
C) BBR does not pay much attention to the codel part of fq_codel.
since y'all are having such fun with flent, care to try irtt? :)
As for singapore, well, I thnk y'all are getting better at pattern recognition, but you'll see not much of a good one running as far as to singapore, and perhaps that's good input for a fuzzy recognition algorithm...
-
When I got home, I ran the dslreports test, with codel+fq_codel at 290/19, from my laptop on wifi. The results were very good, especially considering i was concurrently watching hulu.

netperfrunner.sh v6:
2018-10-11 16:19:53 Testing netperf-west.bufferbloat.net (ipv6) with 4 streams down and up while pinging gstatic.com. Takes about 60 seconds.
 Download:  242.21 Mbps
   Upload:  7.98 Mbps
  Latency: (in msec, 61 pings, 0.00% packet loss)
      Min: 35.790
    10pct: 38.426
   Median: 44.195
      Avg: 45.566
    90pct: 52.161
      Max: 65.077
netperfrunner.sh v4:
2018-10-11 16:21:14 Testing netperf-west.bufferbloat.net (ipv4) with 4 streams down and up while pinging gstatic.com. Takes about 60 seconds.
 Download:  229.08 Mbps
   Upload:  12.07 Mbps
  Latency: (in msec, 30 pings, 50.82% packet loss)
      Min: 61.389
    10pct: 62.261
   Median: 67.240
      Avg: 67.030
    90pct: 70.341
      Max: 77.469
code
flent rrul46:

0_1539293261991_rrul46-2018-10-11T161530.029411.290mb_19mb.flent.gz ]
I need to move some stuff around in an attempt to free up a switch port in the basement to test from this machine while wired. Either that, or i'll disconnect lan one day. holy packet loss over v4.
-
Three more tests; all were run with the same up/down b/w parameters, within a few minutes of each other.
1) PFSense - no shaping, baseline:

2) PFSense - codel + fq_codel:

3) Linux - sch_cake, noecn + ack-filter:

-
Well, after watching the pfSense video on fq_codel again, it was mentioned that the sub (child) queues under the limiters are required:
https://www.youtube.com/watch?v=o8nL81DzTlU
I'm not sure if they are required to make sure that the shaping works properly when using floating rules on the WAN interface, or just in general. From my personal experience, applying just the limiter on the LAN side (no child queues) work as well. So I'm still on the quest to find a better explanation as to why child queues need to be created.
-
Any chance You can share if You are configuring the bufferbloat testing servers in a special way(sysctl tweaks or something else). The only thing I do over vanilla ubuntu is to set-up iptables and set fq_codel as default qdisc.
I've also sorted my weird results. Turns out there was a bottleneck between me and my netperf server.
-
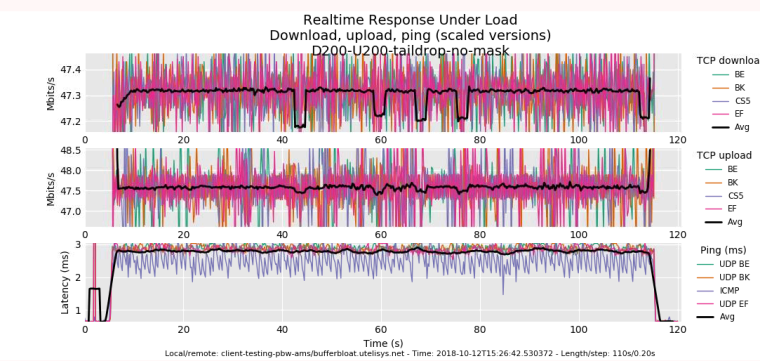
tail-drop + fq_codel
-
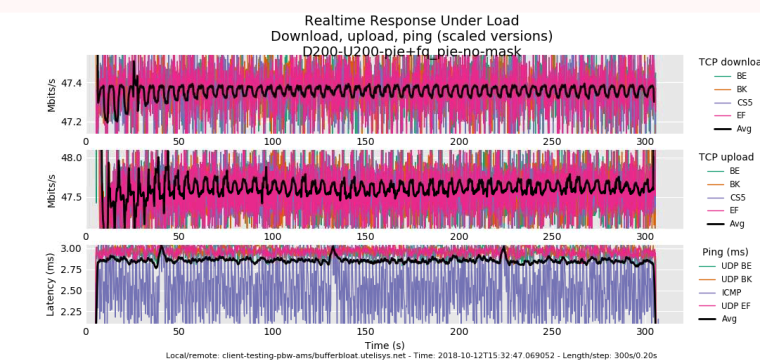
pie + fq_pie
-
-
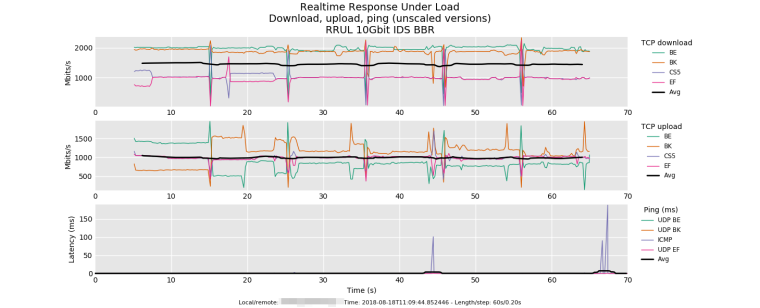
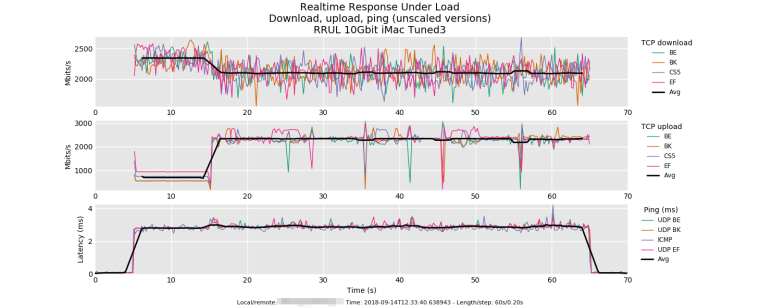
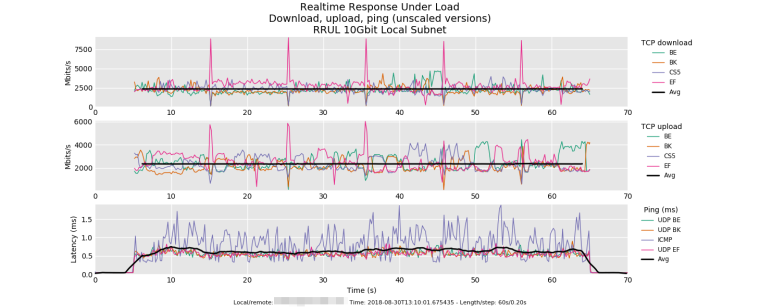
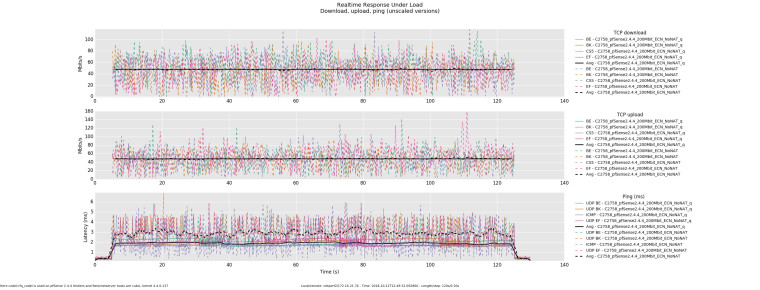
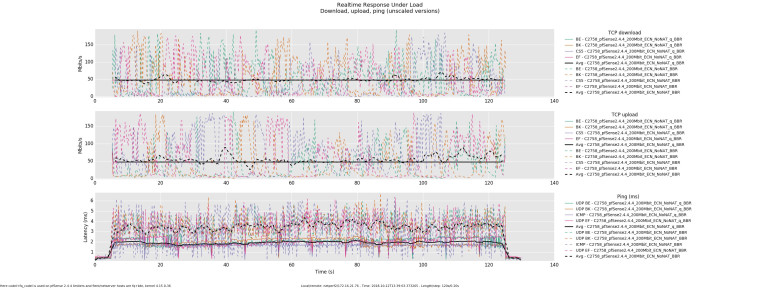
Since people have started sharing flent test results, I figured I'd share a couple interesting one as well from some 10Gbit testing that I have done.
Test 1: RRUL test between two 10Gbit Linux hosts (Debian 9) across the firewall (i.e. two different subnets) with IDS (Snort) enabled. Both hosts have the TCP BBR algorithm enabled. A couple spikes in the ping - at this speed with IDS enabled the firewall's CPU cores are essentially pegged.
Test 2: RRUL test between a 10Gbit Linux host (Debian 9) and an iMac with 10Gbit Thunderbolt 3 to ethernet adapter. Both on same subnet. Linux host has BBR enabled. Not sure why there is such slow ramp on the iMac side when it is receiving traffic from the Linux host. Unfortunately I have not found a way to fix. Also note how much for stable the upload is on the Linux host with BBR enabled.
Test 3: RRUL test between two 10Gbit Linux hosts (Debian 9) on the same subnet. Both hosts have the TCP BBR algorithm enabled. In my opinion this test is as essentially perfect. Around 19 Gbit/s of traffic and an average latency of less than 1ms . Plus very stable transfer with BBR.
@dtaht - any thoughts?
-
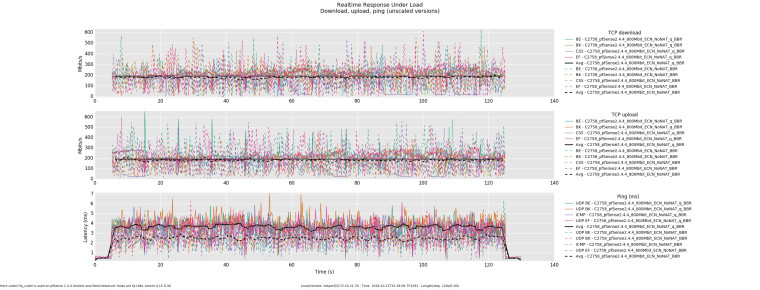
@tman222 I've tested similarly, albeit lower configured pipes, and I actually find that using queues lowers latency.
Here codel+fq_codel is used on pfSense 2.4.4 limiters and flent/netserver hosts are cubic, kernel 4.4.0-137. (q denotes that one up and one down queue was used)
-
Here codel+fq_codel is used on pfSense 2.4.4 limiters and flent/netserver hosts are fq+bbr, kernel 4.15.0-36. (q denotes that one up and one down queue was used)
-
And then the opposite occurs as throughput increases, latency becomes higher when utilizing queues.
@dtaht any thoughts on what might we be running into here?
-
My first thought, this morning, when asked about my thoughts, was to get some food, a sixpack of beer, and go sailing. :)
Loving seeing y'all doing the comparison plot thing now. you needn't post your *.flent.gz files here if yu don't want to (my browser plugin dumps them into flent automaticall), but feel free to tarball 'em and email dave dot taht at gmail.com.
I don't get what you mean by codel + fq_codel. did you post a setup somewhere?
bb tomorrow. PDT.