CPU Usage when network used
-
Hi @qwaven - after thinking about this some more, I wanted to retrace a couple steps / clarify some information:
-
How do you currently have your pfSense box configured (i.e. with the C3958 based board)? What I mean by that is, what network interfaces are you currently using / not using, and do you have any expansion cards (e.g. Chelsio) plugged in? What do you use for storage (SATA or NVME)?
-
Can you describe to me how you are performing the three-way test (i.e. how things are connected physically), and what the specs are of each of the hosts on either end?
Thanks in advance.
-
-
@tman222 said in CPU Usage when network used:
Hi @qwaven - after thinking about this some more, I wanted to retrace a couple steps / clarify some information:
Hi @tman222 will try and answer this.
How do you currently have your pfSense box configured (i.e. with the C3958 based board)? What I mean by that is, what network interfaces are you currently using / not using, and do you have any expansion cards (e.g. Chelsio) plugged in? What do you use for storage (SATA or NVME)?
The PFSense box has 16G DDR4 memory, uses M2 SATA for storage, and does not have any addon cards...etc installed. All interfaces are built into the board. 3/4 are used.
Originally had 2 in use (1 for pppoe/out and other had all vlans on it)
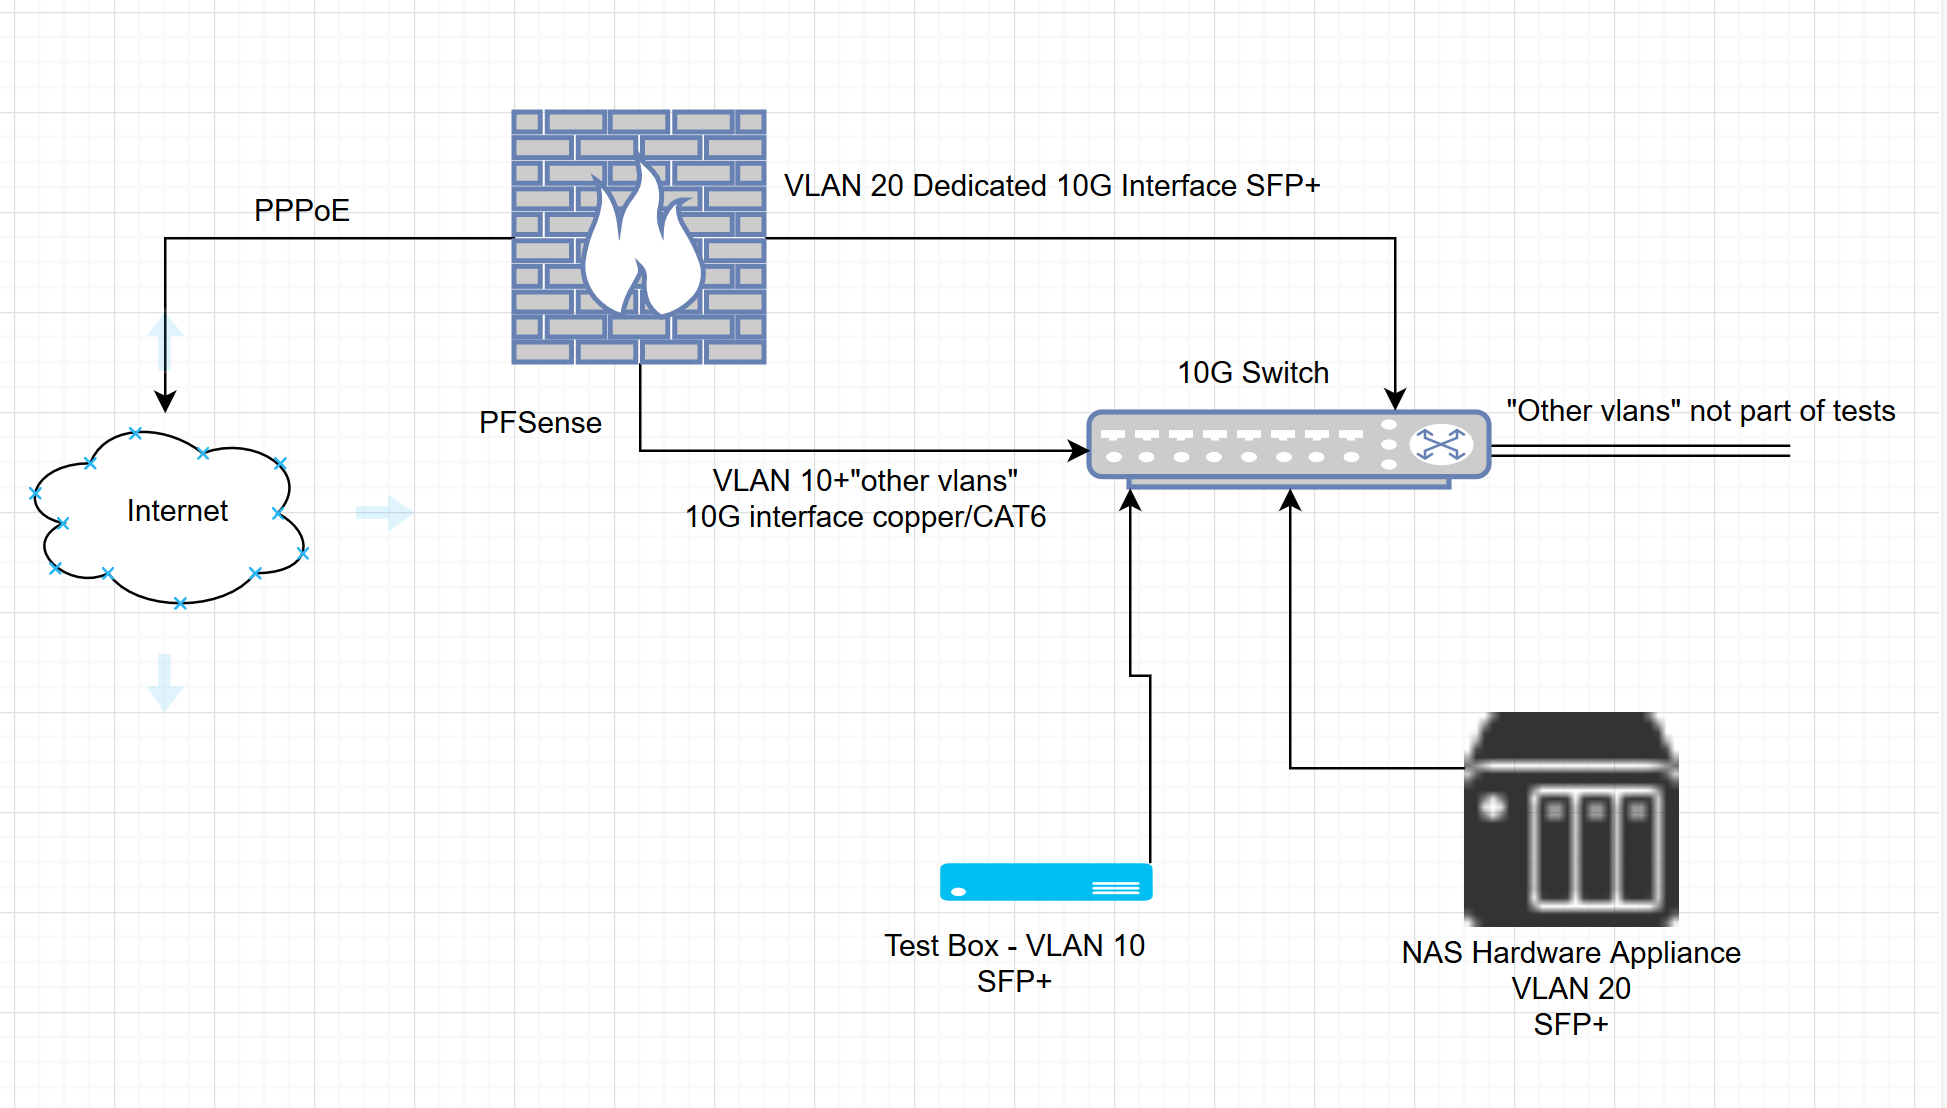
Now I have 1 for pppoe, 1 for the NAS vlan, and 1 for the rest.Can you describe to me how you are performing the three-way test (i.e. how things are connected physically), and what the specs are of each of the hosts on either end?
Loading up iperf3 on the test box (linux booted) and connecting to the NAS. Various tests as outlined in a previous post. Either single connection, or running multiple streams at once.
Test box is a Z800 http://www.hp.com/canada/products/landing/workstations/files/13278_na.pdf
I can't recall exactly which cpu is in it but there are 2 qc, and lots of memory. There is an intel based dual 10G addon card to support the 10G tests. (one port used)
The NAS has 8G of memory, I'm not sure on the exact hardware inside it and has an addon card from the manufacture also dual 10G SFP+ (one port used) I believe this is Intel based chipset.
Keep in mind:
- If PF is disabled on PFsense 10G throughput is possible
- IPerf3 by default uses only memory not disk/drives...etc so I don't believe disk performance should matter. Unless I'm incorrect here...
It appears to me that there is some sort of constraint with how PF firewall passes traffic. As I am not an export on this I am not sure why 9.xGb throughput drops down to about 3G with PF enabled. Does it reserve throughput for other networks by default? IE the other vlans attached but not used during my tests? I get large rulebases can effect performance but I do not have much more than a few pass rules.
I've also made a very quick but accurate enough diagram.
Cheers!
-
@qwaven - thanks for the additional information and clarification, I really appreciate it.
I had a couple follow up questions / suggestions:
- If you put the test box on its own dedicated interface / VLAN (i.e. no other VLAN's) -- do you see any difference in throughput?
- Also wanted to share this link with you: https://bsdrp.net/documentation/technical_docs/performance#where_is_the_bottleneck This gives gives some additional FreeBSD commands / tools for monitoring to figure out whether the bottleneck might be. If you run those while performing a test across the firewall, do you notice anything interesting?
- One thing I would recommend trying is lowering the MSS to the minimum allowed when running an iperf3 test and seeing where you are hitting a wall in terms of number of packets per second (pps) that can be transferred across the firewall (you'll see it when you keep increasing parallel streams but pps no longer increases) . I'd be curious to know where that number is with and without PF enabled on your system (the link in 2. will show how you can monitor pps with netstat).
I spent time thinking today whether this might have something with CPU PCIe lanes: The Xeon D 1518 I have in my box is only 200 MHz faster, but supports 32 PCIe lanes, while the Atom C3958 only supports 16. Although after doing some reading I'm not convinced that this is primary issue. It might come down to the difference in CPU architecture itself since 200 MHz is not a big difference in clock speed. Having said that, however, I still think I would like to see some pps numbers first before to be more certain on this.
In any case, I hope this helps and look forward to hearing what you find out.
-
You may be on to something with PCIe lanes, tman222. That's a 100% increase, which is considerable.
-
This has some great data: https://bsdrp.net/documentation/technical_docs/performance
This specifically is interesting: https://github.com/ocochard/netbenches/blob/master/Atom_C2558_4Cores-Intel_i350/forwarding-pf-ipfw/results/fbsd11-routing.r287531/README.md
Steve
-
@stephenw10 said in CPU Usage when network used:
This has some great data: https://bsdrp.net/documentation/technical_docs/performance
This specifically is interesting: https://github.com/ocochard/netbenches/blob/master/Atom_C2558_4Cores-Intel_i350/forwarding-pf-ipfw/results/fbsd11-routing.r287531/README.md
Steve
Great finds! Would be very interesting to see some packets per second (pps) numbers at this point to help reach a definitive conclusion on this.
-
Hey all sorry been a tad busy have not had time to do anything on the pfsense. Checked out the links and will check some more when able.
I do still have the same question. If I missed the answer sorry. There is talk about PCIe lanes...etc but how does this change when running PF vs not? As I've stated I get 10G w/o PF enabled.
Will post the results when I can.
Cheers!
-
The PCIe lanes would have no effect on pf performance as far as I know. I just posted that data to show that enabling pf has a huge impact on throughput, which is what you're seeing.
Steve
-
I agree with you guys. I initially asked what was installed and operating on the system to see if there might be the risk of running out of PCIe lanes. But with the setup as described that seems less likely now. More generally speaking, having enough PCIe lanes does matter though when it comes networking appliances. I think to get to the bottom of this particular case seeing some throughput numbers (e.g. packets per second) will prove to be very insightful. Hope this helps.
-
Hi all,
So hopefully I've done this correctly. :)
Did a few tests adjusting the mss with IPERF. With and without PF enabled. I also ran another perf tool to see the interface info. I've renamed the interfaces a little to better identify them here; not sure if it adds value or not.
With PF enabled:
netstat -ihw1
iperf3 ... -M 90 -T60
 207k     0     0        26M       170k     0        17M     0
  327k     0     0        41M       262k     0        27M     0
  336k     0     0        43M       270k     0        28M     0
  340k     0     0        43M       274k     0        29M     0
  328k     0     0        42M       264k     0        28M     0
  331k     0     0        42M       267k     0        28M     0
  324k     0     0        41M       259k     0        27M     0
  339k     0     0        43M       273k     0        29M     0
  341k     0     0        43M       275k     0        29M     0
  329k     0     0        42M       265k     0        28M     0
-P2 = 400k avg
-P3 = 350-370kWithout -M its actually slightly higher with -P2
  411k     0     0       525M       276k     0       268M     0
  418k     0     0       541M       280k     0       276M     0
  454k     0     0       586M       315k     0       317M     0
  461k     0     0       602M       301k     0       315M     0
and about 530k with 1 stream
systat -ifstat
Interface Traffic Peak Total
pppoe0 in 0.095 KB/s 28.351 MB/s 23.278 GB
out 0.103 KB/s 98.508 KB/s 867.165 MBix1.na in 0.000 KB/s 0.017 KB/s 39.170 KB out 0.000 KB/s 2.116 KB/s 5.986 MB ix1.fs in 110.583 MB/s 366.930 MB/s 72.624 GB out 415.854 KB/s 28.619 MB/s 4.516 GB lo0 in 0.000 KB/s 0.000 KB/s 3.539 KB out 0.000 KB/s 0.000 KB/s 3.539 KB ix3 (test box) in 394.976 KB/s 1.631 MB/s 2.970 GB out 96.656 MB/s 368.782 MB/s 93.678 GB ix1 in 96.936 MB/s 369.768 MB/s 73.133 GB out 416.906 KB/s 37.982 MB/s 4.687 GB ix0 in 0.597 KB/s 38.081 MB/s 23.697 GB out 0.478 KB/s 181.235 KB/s 1.221 GBWith PF Disabled
iperf3 ... -M 90 -P1 -T60
  1.4M     0     0       200M       785k     0       104M     0
  1.4M     0     0       196M       768k     0       102M     0
  1.5M     0     0       204M       802k     0       107M     0
  1.5M     0     0       209M       822k     0       109M     0
  1.4M     0     0       199M       790k     0       105M     0
  1.4M     0     0       197M       775k     0       103M     0
-P2 = 1.7M
-P3 = 1.7M1 stream is about 1.5M
systat -ifstat
Interface           Traffic               Peak                Total
     pppoe0  in      5.459 KB/s          5.938 KB/s           23.280 GB
             out     1.890 KB/s          2.957 KB/s          867.481 MB

    ix1.na  in      0.000 KB/s          0.017 KB/s           40.049 KB
             out     0.000 KB/s          2.116 KB/s            6.121 MB

    ix1.fs  in   1015.734 MB/s          1.018 GB/s          112.744 GB
             out   632.733 KB/s          3.091 MB/s            4.669 GB

        lo0  in      0.000 KB/s          0.000 KB/s            3.539 KB
             out     0.000 KB/s          0.000 KB/s            3.539 KB

        ix3 (test box)  in    661.888 KB/s          3.274 MB/s            3.131 GB
             out   950.307 MB/s          1.028 GB/s          133.273 GB

        ix1  in    953.310 MB/s          1.031 GB/s          112.940 GB
             out   700.685 KB/s          3.462 MB/s            4.858 GB

        ix0  in      6.222 KB/s          6.518 KB/s           23.698 GB
             out     2.733 KB/s          3.419 KB/s            1.222 GB
Cheers!
-
Hi @qwaven - those are interesting results and I'm a little surprised you are getting lower pps throughput with multiple iperf streams. A couple new ideas came to mind:
-
https://docs.netgate.com/pfsense/en/latest/hardware/tuning-and-troubleshooting-network-cards.html#intel-ix-4-cards -- if you adjust up the "hw.intr_storm_threshold" tunable do you see any difference when running tests?
-
If you temporarily disable and remove your pppoe connection along with the "net.isr.dispatch = deferred" tunable, do you see any difference when running the tests?
Some justification for asking you to try 1) and 2) above: After reading your results, I actually tried a similar test on my pfSense box using iperf3 across the firewall between two hosts: Running iperf3 .... -M 90 resulted in approximately 300K packets per second (similar to what you saw). However, increasing the number of parallel streams to 16 increased packets per second to approximately 1.3M and all of the firewall's CPU's cores were busy handling interrupts from the Chelsio NIC. Do you see similar behavior when you increase the number of parallel streams during an iperf test? Or does it appear like just 1 CPU core is trying to manage everything?
Hope this helps.
-
-
@tman222 said in CPU Usage when network used:
hw.intr_storm_threshold
Hi there,
I have set hw.intr_storm_threshold to 8000 which was a value I saw recommended before. I do not see any noticeable difference. I did also try 1 test with P16 and 10000 but it also did not appear any different so stopped.
I also set isr dispatch to direct? I was not clear if that was the default or not. Also did not appear to do anything. :p
In regards to CPU core usage. I believe usage looks some-what similar to tests done earlier with most core's not really being utilized all that much. PPS similar to what I already posted and thus wont post again.
Here are some snippets...
-M 90 -P20 -T60last pid: 12425; load averages: 0.01, 0.13, 0.13 up 0+23:58:44 10:04:41 374 processes: 18 running, 248 sleeping, 108 waiting CPU 0: 0.0% user, 0.0% nice, 0.0% system, 11.9% interrupt, 88.1% idle CPU 1: 0.0% user, 0.0% nice, 0.0% system, 10.7% interrupt, 89.3% idle CPU 2: 0.0% user, 0.0% nice, 0.0% system, 18.6% interrupt, 81.4% idle CPU 3: 0.0% user, 0.0% nice, 0.0% system, 21.6% interrupt, 78.4% idle CPU 4: 0.0% user, 0.0% nice, 0.0% system, 16.5% interrupt, 83.5% idle CPU 5: 0.0% user, 0.0% nice, 0.0% system, 13.9% interrupt, 86.1% idle CPU 6: 0.0% user, 0.0% nice, 0.0% system, 19.6% interrupt, 80.4% idle CPU 7: 0.0% user, 0.0% nice, 0.0% system, 19.6% interrupt, 80.4% idle CPU 8: 0.0% user, 0.0% nice, 0.0% system, 0.0% interrupt, 100% idle CPU 9: 0.0% user, 0.0% nice, 0.0% system, 0.0% interrupt, 100% idle CPU 10: 0.0% user, 0.0% nice, 0.0% system, 0.0% interrupt, 100% idle CPU 11: 0.4% user, 0.0% nice, 0.0% system, 0.0% interrupt, 99.6% idle CPU 12: 0.0% user, 0.0% nice, 0.0% system, 0.0% interrupt, 100% idle CPU 13: 0.0% user, 0.0% nice, 0.0% system, 0.0% interrupt, 100% idle CPU 14: 0.0% user, 0.0% nice, 0.0% system, 0.0% interrupt, 100% idle CPU 15: 0.0% user, 0.0% nice, 0.0% system, 0.0% interrupt, 100% idle Mem: 40M Active, 232M Inact, 579M Wired, 40M Buf, 15G Free Swap: 3979M Total, 3979M Free-M 90 -P16 -T60
last pid: 87357;  load averages:  0.03,  0.12,  0.12    up 1+00:01:03  10:07:00
374 processes: 18 running, 248 sleeping, 108 waiting
CPU 0:   0.0% user,  0.0% nice,  0.0% system, 43.7% interrupt, 56.3% idle
CPU 1:   0.0% user,  0.0% nice,  0.0% system, 33.0% interrupt, 67.0% idle
CPU 2:   0.0% user,  0.0% nice,  0.0% system,  7.4% interrupt, 92.6% idle
CPU 3:   0.0% user,  0.0% nice,  0.0% system,  0.0% interrupt,  100% idle
CPU 4:   0.0% user,  0.0% nice,  0.0% system, 24.1% interrupt, 75.9% idle
CPU 5:   0.4% user,  0.0% nice,  0.0% system, 11.9% interrupt, 87.8% idle
CPU 6:   0.0% user,  0.0% nice,  0.0% system, 25.6% interrupt, 74.4% idle
CPU 7:   0.0% user,  0.0% nice,  0.0% system, 15.2% interrupt, 84.8% idle
CPU 8:   0.0% user,  0.0% nice,  0.0% system,  0.0% interrupt,  100% idle
CPU 9:   0.0% user,  0.0% nice,  0.0% system,  0.0% interrupt,  100% idle
CPU 10:  0.0% user,  0.0% nice,  0.0% system,  0.0% interrupt,  100% idle
CPU 11:  0.0% user,  0.0% nice,  0.0% system,  0.0% interrupt,  100% idle
CPU 12:  0.0% user,  0.0% nice,  0.0% system,  0.0% interrupt,  100% idle
CPU 13:  0.0% user,  0.0% nice,  0.0% system,  0.0% interrupt,  100% idle
CPU 14:  0.0% user,  0.0% nice,  0.0% system,  0.0% interrupt,  100% idle
CPU 15:  0.0% user,  0.0% nice,  0.0% system,  0.0% interrupt,  100% idle
Mem: 35M Active, 241M Inact, 579M Wired, 40M Buf, 15G Free
Swap: 3979M Total, 3979M Free
-M 90 -P2 -T60
last pid: 21234;  load averages:  0.28,  0.18,  0.14    up 1+00:02:14  10:08:11
374 processes: 21 running, 248 sleeping, 105 waiting
CPU 0:   0.0% user,  0.0% nice,  0.0% system,  0.0% interrupt,  100% idle
CPU 1:   0.0% user,  0.0% nice,  0.0% system,  0.0% interrupt,  100% idle
CPU 2:   0.0% user,  0.0% nice,  0.0% system, 50.0% interrupt, 50.0% idle
CPU 3:   0.0% user,  0.0% nice,  0.0% system, 82.2% interrupt, 17.8% idle
CPU 4:   0.0% user,  0.0% nice,  0.0% system,  0.0% interrupt,  100% idle
CPU 5:   0.0% user,  0.0% nice,  0.0% system, 45.6% interrupt, 54.4% idle
CPU 6:   0.0% user,  0.0% nice,  0.0% system,  0.0% interrupt,  100% idle
CPU 7:   0.0% user,  0.0% nice,  0.0% system,  0.0% interrupt,  100% idle
CPU 8:   0.0% user,  0.0% nice,  0.0% system,  0.0% interrupt,  100% idle
CPU 9:   0.0% user,  0.0% nice,  0.0% system,  0.0% interrupt,  100% idle
CPU 10:  0.0% user,  0.0% nice,  0.0% system,  0.0% interrupt,  100% idle
CPU 11:  0.0% user,  0.0% nice,  0.0% system,  0.0% interrupt,  100% idle
CPU 12:  0.0% user,  0.0% nice,  0.0% system,  0.0% interrupt,  100% idle
CPU 13:  0.0% user,  0.0% nice,  0.4% system,  0.0% interrupt, 99.6% idle
CPU 14:  0.0% user,  0.0% nice,  0.0% system,  0.0% interrupt,  100% idle
CPU 15:  0.0% user,  0.0% nice,  0.0% system,  0.0% interrupt,  100% idle
Mem: 35M Active, 241M Inact, 579M Wired, 40M Buf, 15G Free
Swap: 3979M Total, 3979M Free
-M 90 -P100 -T60
last pid: 84603;  load averages:  0.67,  0.31,  0.20    up 1+00:03:53  10:09:50
374 processes: 18 running, 248 sleeping, 108 waiting
CPU 0:   0.0% user,  0.0% nice,  0.0% system, 26.7% interrupt, 73.3% idle
CPU 1:   0.0% user,  0.0% nice,  0.0% system, 21.2% interrupt, 78.8% idle
CPU 2:   0.0% user,  0.0% nice,  0.0% system, 19.2% interrupt, 80.8% idle
CPU 3:   0.0% user,  0.0% nice,  0.0% system, 15.7% interrupt, 84.3% idle
CPU 4:   0.0% user,  0.0% nice,  0.0% system, 20.4% interrupt, 79.6% idle
CPU 5:   0.0% user,  0.0% nice,  0.0% system, 19.6% interrupt, 80.4% idle
CPU 6:   0.0% user,  0.0% nice,  0.0% system, 22.0% interrupt, 78.0% idle
CPU 7:   0.0% user,  0.0% nice,  0.0% system, 22.0% interrupt, 78.0% idle
CPU 8:   0.0% user,  0.0% nice,  0.0% system,  0.0% interrupt,  100% idle
CPU 9:   0.0% user,  0.0% nice,  0.0% system,  0.0% interrupt,  100% idle
CPU 10:  0.0% user,  0.0% nice,  0.0% system,  0.0% interrupt,  100% idle
CPU 11:  0.0% user,  0.0% nice,  0.0% system,  0.0% interrupt,  100% idle
CPU 12:  0.0% user,  0.0% nice,  0.0% system,  0.0% interrupt,  100% idle
CPU 13:  0.0% user,  0.0% nice,  0.0% system,  0.0% interrupt,  100% idle
CPU 14:  0.0% user,  0.0% nice,  0.0% system,  0.0% interrupt,  100% idle
CPU 15:  0.0% user,  0.0% nice,  0.0% system,  0.0% interrupt,  100% idle
Mem: 35M Active, 241M Inact, 579M Wired, 40M Buf, 15G Free
Swap: 3979M Total, 3979M Free
with pf disabled and P16 does not look any different.
last pid: 17311;  load averages:  0.36,  0.33,  0.22    up 1+00:05:27  10:11:24
373 processes: 25 running, 247 sleeping, 101 waiting
CPU 0:   0.0% user,  0.0% nice,  0.0% system, 26.1% interrupt, 73.9% idle
CPU 1:   0.0% user,  0.0% nice,  0.0% system, 31.7% interrupt, 68.3% idle
CPU 2:   0.0% user,  0.0% nice,  0.0% system, 29.1% interrupt, 70.9% idle
CPU 3:   0.0% user,  0.0% nice,  0.0% system, 16.8% interrupt, 83.2% idle
CPU 4:   0.0% user,  0.0% nice,  0.0% system, 40.3% interrupt, 59.7% idle
CPU 5:   0.0% user,  0.0% nice,  0.0% system, 25.4% interrupt, 74.6% idle
CPU 6:   0.0% user,  0.0% nice,  0.0% system, 39.9% interrupt, 60.1% idle
CPU 7:   0.0% user,  0.0% nice,  0.0% system, 34.0% interrupt, 66.0% idle
CPU 8:   0.0% user,  0.0% nice,  0.0% system,  0.0% interrupt,  100% idle
CPU 9:   0.0% user,  0.0% nice,  0.0% system,  0.0% interrupt,  100% idle
CPU 10:  0.0% user,  0.0% nice,  0.0% system,  0.0% interrupt,  100% idle
CPU 11:  0.0% user,  0.0% nice,  0.4% system,  0.0% interrupt, 99.6% idle
CPU 12:  0.0% user,  0.0% nice,  0.0% system,  0.0% interrupt,  100% idle
CPU 13:  0.0% user,  0.0% nice,  0.0% system,  0.0% interrupt,  100% idle
CPU 14:  0.0% user,  0.0% nice,  0.0% system,  0.0% interrupt,  100% idle
CPU 15:  0.0% user,  0.0% nice,  0.0% system,  0.0% interrupt,  100% idle
Mem: 35M Active, 241M Inact, 579M Wired, 40M Buf, 15G Free
Swap: 3979M Total, 3979M Free
I have not removed PPPoE at this time as its not really something I want to do as it will be somewhat more destructive.
Cheers!
-
Thanks @qwaven - I appreciate the update. Something still seems amiss here: When I run an iperf test and keep increasing the number of parallel streams, the cores on my pfSense system eventually all become fully loaded down. From the data in your last reply, it seems the majority of your cores still sit idle no matter how many streams you choose to use. I don't use pppoe on my system, but wanted to make sure that having it enabled wasn't somehow limiting the total capabilities of your system (this why I asked for you to temporarily try testing without it enabled just to see if there was any difference in performance).
If you don't mind, there's one other thing that would be good to see right now: Could you please post the output of "netstat -Q" for us?
Thanks in again and hope this helps.
-
Hi there,
I am assuming -Q is relevant at anytime? I have not done anything other than enter the command.
netstat -Q
Configuration:
Setting                        Current        Limit
Thread count                        16           16
Default queue limit                256        10240
Dispatch policy                 direct          n/a
Threads bound to CPUs         disabled          n/a

Protocols:
Name   Proto QLimit Policy Dispatch Flags
ip         1   3000   flow  default   ---
igmp       2    256 source  default   ---
rtsock     3   1024 source  default   ---
arp        4    256 source  default   ---
ether      5    256 source   direct   ---
ip6        6    256   flow  default   ---

Workstreams:
WSID CPU   Name     Len WMark   Disp'd  HDisp'd   QDrops   Queued  Handled
   0   0   ip         0   945  3899897        0        0 32668248 36568145
   0   0   igmp       0     3        0        0        0        6        6
   0   0   rtsock     0     5        0        0        0      850      850
   0   0   arp        0     0     1266        0        0        0     1266
   0   0   ether      0     0 101484612        0        0        0 101484612
   0   0   ip6        0     0        0        0        0        0        0
   1   1   ip         0   552  2405223        0        0  5549277  7954500
   1   1   igmp       0     0        0        0        0        0        0
   1   1   rtsock     0     0        0        0        0        0        0
   1   1   arp        0     1        0        0        0     2883     2883
   1   1   ether      0     0 23487698        0        0        0 23487698
   1   1   ip6        0     0        0        0        0        0        0
   2   2   ip         0   939  3450247        0        0  7992399 11442646
   2   2   igmp       0     0        0        0        0        0        0
   2   2   rtsock     0     0        0        0        0        0        0
   2   2   arp        0     0        0        0        0        0        0
   2   2   ether      0     0 52851635        0        0        0 52851635
   2   2   ip6        0     0        0        0        0        0        0
   3   3   ip         0  1848  3627402        0        0 15327765 18955167
   3   3   igmp       0     0        0        0        0        0        0
   3   3   rtsock     0     0        0        0        0        0        0
   3   3   arp        0     0        0        0        0        0        0
   3   3   ether      0     0 83754924        0        0        0 83754924
   3   3   ip6        0     0        0        0        0        0        0
   4   4   ip         0  1934  3000592        0        0 12546591 15547183
   4   4   igmp       0     0        0        0        0        0        0
   4   4   rtsock     0     0        0        0        0        0        0
   4   4   arp        0     1        0        0        0       15       15
   4   4   ether      0     0 35382809        0        0        0 35382809
   4   4   ip6        0     0        0        0        0        0        0
   5   5   ip         0  2043  2925436        0        0 11129328 14054764
   5   5   igmp       0     0        0        0        0        0        0
   5   5   rtsock     0     0        0        0        0        0        0
   5   5   arp        0     0        0        0        0        0        0
   5   5   ether      0     0 42080649        0        0        0 42080649
   5   5   ip6        0     0        0        0        0        0        0
   6   6   ip         0  2013  2767600        0        0 18088497 20856097
   6   6   igmp       0     0        0        0        0        0        0
   6   6   rtsock     0     0        0        0        0        0        0
   6   6   arp        0     0        0        0        0        0        0
   6   6   ether      0     0 73731512        0        0        0 73731512
   6   6   ip6        0     0        0        0        0        0        0
   7   7   ip         0   976  2383106        0        0  7019003  9402109
   7   7   igmp       0     0        0        0        0        0        0
   7   7   rtsock     0     0        0        0        0        0        0
   7   7   arp        0     0        0        0        0        0        0
   7   7   ether      0     0 39100484        0        0        0 39100484
   7   7   ip6        0     1        0        0        0        4        4
   8   8   ip         0   868        0        0        0 28748443 28748443
   8   8   igmp       0     0        0        0        0        0        0
   8   8   rtsock     0     0        0        0        0        0        0
   8   8   arp        0     0        0        0        0        0        0
   8   8   ether      0     0        0        0        0        0        0
   8   8   ip6        0     0        0        0        0        0        0
   9   9   ip         0   886        0        0        0  7866336  7866336
   9   9   igmp       0     0        0        0        0        0        0
   9   9   rtsock     0     0        0        0        0        0        0
   9   9   arp        0     0        0        0        0        0        0
   9   9   ether      0     0        0        0        0        0        0
   9   9   ip6        0     0        0        0        0        0        0
  10  10   ip         0  1922        0        0        0 18281823 18281823
  10  10   igmp       0     0        0        0        0        0        0
  10  10   rtsock     0     0        0        0        0        0        0
  10  10   arp        0     0        0        0        0        0        0
  10  10   ether      0     0        0        0        0        0        0
  10  10   ip6        0     0        0        0        0        0        0
  11  11   ip         0  1675        0        0        0 25873794 25873794
  11  11   igmp       0     0        0        0        0        0        0
  11  11   rtsock     0     0        0        0        0        0        0
  11  11   arp        0     0        0        0        0        0        0
  11  11   ether      0     0        0        0        0        0        0
  11  11   ip6        0     0        0        0        0        0        0
  12  12   ip         0   842        0        0        0  4971446  4971446
  12  12   igmp       0     0        0        0        0        0        0
  12  12   rtsock     0     0        0        0        0        0        0
  12  12   arp        0     1        0        0        0    14660    14660
  12  12   ether      0     0        0        0        0        0        0
  12  12   ip6        0     0        0        0        0        0        0
  13  13   ip         0  1035        0        0        0 10699300 10699300
  13  13   igmp       0     0        0        0        0        0        0
  13  13   rtsock     0     0        0        0        0        0        0
  13  13   arp        0     1        0        0        0     1341     1341
  13  13   ether      0     0        0        0        0        0        0
  13  13   ip6        0     0        0        0        0        0        0
  14  14   ip         0   992        0        0        0 19460583 19460583
  14  14   igmp       0     0        0        0        0        0        0
  14  14   rtsock     0     0        0        0        0        0        0
  14  14   arp        0     0        0        0        0        0        0
  14  14   ether      0     0        0        0        0        0        0
  14  14   ip6        0     0        0        0        0        0        0
  15  15   ip         0  1169        0        0        0 13328102 13328102
  15  15   igmp       0     0        0        0        0        0        0
  15  15   rtsock     0     0        0        0        0        0        0
  15  15   arp        0     0        0        0        0        0        0
  15  15   ether      0     0        0        0        0        0        0
  15  15   ip6        0     0        0        0        0        0        0
Cheers!
-
Thanks @qwaven - I appreciate the additional info. Your numbers in the WMark (Watermark) column are a lot higher than what I see, but I'm not 100% sure how to interpret that. For instance, is this the amount of packets that crossed the water mark or is this a global limit? I think @stephenw10 or someone else with a better knowledge of the FreeBSD networking stack might be able to set shed some more light on these statistics.
After some additional thought, seeing the queue statistics on your ix and igb interfaces might also be useful.
For RX Stats:
sysctl -a | grep rx_packetsFor TX Stats:
sysctl -a | grep tx_packetsand then post the tx and rx queue statistics for all active igb and ix interfaces. How are packets distributed across the tx and rx queues for all the different interfaces that are currently active?
Thanks in advance and hope this helps.
-
@tman222 said in CPU Usage when network used:
sysctl -a | grep rx_packets
sysctl -a | grep rx_packets
dev.ix.3.queue7.rx_packets: 6387858
dev.ix.3.queue6.rx_packets: 6755233
dev.ix.3.queue5.rx_packets: 7452156
dev.ix.3.queue4.rx_packets: 5690876
dev.ix.3.queue3.rx_packets: 5994398
dev.ix.3.queue2.rx_packets: 6624108
dev.ix.3.queue1.rx_packets: 8177888
dev.ix.3.queue0.rx_packets: 8585302
dev.ix.2.queue7.rx_packets: 0
dev.ix.2.queue6.rx_packets: 0
dev.ix.2.queue5.rx_packets: 0
dev.ix.2.queue4.rx_packets: 0
dev.ix.2.queue3.rx_packets: 0
dev.ix.2.queue2.rx_packets: 0
dev.ix.2.queue1.rx_packets: 0
dev.ix.2.queue0.rx_packets: 0
dev.ix.1.queue7.rx_packets: 16551499
dev.ix.1.queue6.rx_packets: 33534177
dev.ix.1.queue5.rx_packets: 17563120
dev.ix.1.queue4.rx_packets: 15072354
dev.ix.1.queue3.rx_packets: 39145147
dev.ix.1.queue2.rx_packets: 23228763
dev.ix.1.queue1.rx_packets: 7950923
dev.ix.1.queue0.rx_packets: 41279340
dev.ix.0.queue7.rx_packets: 22
dev.ix.0.queue6.rx_packets: 210025
dev.ix.0.queue5.rx_packets: 43
dev.ix.0.queue4.rx_packets: 861
dev.ix.0.queue3.rx_packets: 26
dev.ix.0.queue2.rx_packets: 15
dev.ix.0.queue1.rx_packets: 29
dev.ix.0.queue0.rx_packets: 23467772
sysctl -a | grep tx_packets
dev.ix.3.queue7.tx_packets: 16140452
dev.ix.3.queue6.tx_packets: 33202115
dev.ix.3.queue5.tx_packets: 17090472
dev.ix.3.queue4.tx_packets: 14520542
dev.ix.3.queue3.tx_packets: 38602349
dev.ix.3.queue2.tx_packets: 22896318
dev.ix.3.queue1.tx_packets: 7152241
dev.ix.3.queue0.tx_packets: 57226399
dev.ix.2.queue7.tx_packets: 0
dev.ix.2.queue6.tx_packets: 0
dev.ix.2.queue5.tx_packets: 0
dev.ix.2.queue4.tx_packets: 0
dev.ix.2.queue3.tx_packets: 0
dev.ix.2.queue2.tx_packets: 0
dev.ix.2.queue1.tx_packets: 0
dev.ix.2.queue0.tx_packets: 0
dev.ix.1.queue7.tx_packets: 4275957
dev.ix.1.queue6.tx_packets: 4377190
dev.ix.1.queue5.tx_packets: 3828586
dev.ix.1.queue4.tx_packets: 2886044
dev.ix.1.queue3.tx_packets: 4404683
dev.ix.1.queue2.tx_packets: 5183075
dev.ix.1.queue1.tx_packets: 5869218
dev.ix.1.queue0.tx_packets: 11726952
dev.ix.0.queue7.tx_packets: 2607146
dev.ix.0.queue6.tx_packets: 2812508
dev.ix.0.queue5.tx_packets: 4187141
dev.ix.0.queue4.tx_packets: 3436090
dev.ix.0.queue3.tx_packets: 2184920
dev.ix.0.queue2.tx_packets: 1856375
dev.ix.0.queue1.tx_packets: 3202041
dev.ix.0.queue0.tx_packets: 4121751
Cheers!
-
Hi @qwaven - thanks for the additional information. It looks like the packets are well distributed across the queues on the non pppoe interfaces, which is good. I apologize for not asking you this in the previous post, but could you please also give us the output of "netstat -m" Thanks again.
-
netstat -m
106492/19253/125745 mbufs in use (current/cache/total)
98297/10023/108320/1000000 mbuf clusters in use (current/cache/total/max)
98297/9987 mbuf+clusters out of packet secondary zone in use (current/cache)
0/24/24/524288 4k (page size) jumbo clusters in use (current/cache/total/max)
0/0/0/524288 9k jumbo clusters in use (current/cache/total/max)
0/0/0/84549 16k jumbo clusters in use (current/cache/total/max)
223217K/24955K/248172K bytes allocated to network (current/cache/total)
0/0/0 requests for mbufs denied (mbufs/clusters/mbuf+clusters)
0/0/0 requests for mbufs delayed (mbufs/clusters/mbuf+clusters)
0/0/0 requests for jumbo clusters delayed (4k/9k/16k)
0/0/0 requests for jumbo clusters denied (4k/9k/16k)
0 sendfile syscalls
0 sendfile syscalls completed without I/O request
0 requests for I/O initiated by sendfile
0 pages read by sendfile as part of a request
0 pages were valid at time of a sendfile request
0 pages were requested for read ahead by applications
0 pages were read ahead by sendfile
0 times sendfile encountered an already busy page
0 requests for sfbufs denied
0 requests for sfbufs delayed
Cheers!
-
Hi @qwaven - those mbuf cluster number also look good. After thinking about this a bit more and doing some more reading, I am starting to believe that we're hitting some sort of I/O constraint here (whether real or artificial). Have a look at these two sites:
https://calomel.org/network_performance.html
https://bsdrp.net/documentation/examples/forwarding_performance_lab_of_a_superserver_5018a-ftn4_with_10-gigabit_chelsio_t540-crWhat's interesting to me about the BSDRP page in particular is that the benchmark hardware was a previous generation Intel Atom CPU with half as many cores, yet the throughput was approximately twice as high (even under pure forwarding conditions, i.e. no pf, ipf, or ipfw enabled). I realize the tests were done on FreeBSD 11.1 vs. pfSense, but I wouldn't expect the difference between the two under normal circumstances to be this drastic.
Having said that, I'm not sure if the limitations that you're seeing are due to having pppoe enabled on the system or there is some type of limitation with the onboard 10Gbit ports. One thing that might be worth trying is duplicating the iperf3 tests, but using the Chelsio NIC instead to see if there is any difference in throughput.
Other than that, I'm basically out of ideas now on this one. Perhaps the other responders in this thread will have some more thoughts on what to try. Thanks again sharing the additional data with us, and hope this helps.
-
Well I've done this. I popped the chelsio in. Steps after:
- Moved JUST the NAS to the chelsio, no change (no vlan)
- Moved the test box/network to the chelsio, no change (no vlan)
- Started playing with the options in PFSense
i) adjusted the firewall policy to aggressive (was normal) , possibly saw marginal increase with parallel streams but not enough to really mention.
ii) Disabled "insert stronger ID..." and let the races start! :)
Immediately speeds are improved. I can't quite get as good as without PF at all but its def a lot better. I am unclear if this option is default enabled in PF or not?
With 6 streams:
[SUM] 0.00-10.00 sec 8.79 GBytes 7.55 Gbits/sec 1784 sender
[SUM] 0.00-10.00 sec 8.77 GBytes 7.53 Gbits/sec receiverSaw some spikes above 9.
I suspect it is not 100% required to use the chelsio card but actually may see even further speed increases if I move one network back to the built in which I imagine would be using different PCIe lanes than the addon card.
Also keep in mind I have done no modifications like previously done so flow control appears active...etc.
Some more numbers:
last pid: 10762;  load averages:  0.87,  0.33,  0.26    up 0+00:43:07  11:32:13
400 processes: 22 running, 256 sleeping, 122 waiting
CPU 0:   0.0% user,  0.4% nice,  0.8% system,  4.3% interrupt, 94.5% idle
CPU 1:   0.0% user,  0.4% nice,  1.6% system, 10.6% interrupt, 87.5% idle
CPU 2:   0.0% user,  0.4% nice,  1.2% system, 60.4% interrupt, 38.0% idle
CPU 3:   0.0% user,  0.0% nice,  0.4% system,  7.5% interrupt, 92.2% idle
CPU 4:   0.0% user,  0.8% nice,  0.0% system,  9.0% interrupt, 90.2% idle
CPU 5:   0.0% user,  0.4% nice,  1.2% system, 34.8% interrupt, 63.7% idle
CPU 6:   0.0% user,  0.0% nice,  0.0% system, 21.2% interrupt, 78.8% idle
CPU 7:   0.0% user,  0.8% nice,  0.8% system, 37.3% interrupt, 61.2% idle
CPU 8:   0.0% user,  0.4% nice,  0.0% system, 37.3% interrupt, 62.4% idle
CPU 9:   0.0% user,  0.4% nice,  0.4% system, 29.0% interrupt, 70.2% idle
CPU 10:  0.0% user,  0.0% nice,  0.8% system, 17.3% interrupt, 82.0% idle
CPU 11:  0.0% user,  0.0% nice,  1.2% system, 34.1% interrupt, 64.7% idle
CPU 12:  0.0% user,  0.0% nice,  0.4% system, 23.9% interrupt, 75.7% idle
CPU 13:  0.0% user,  0.8% nice,  0.0% system, 13.7% interrupt, 85.5% idle
CPU 14:  0.0% user,  0.0% nice,  0.0% system, 48.2% interrupt, 51.8% idle
CPU 15:  0.0% user,  0.4% nice,  0.0% system, 16.5% interrupt, 83.1% idle
Mem: 115M Active, 168M Inact, 675M Wired, 41M Buf, 15G Free
Swap: 3979M Total, 3979M Free
iperf3 -M90 -P10
        input        (Total)           output
packets  errs idrops      bytes    packets  errs      bytes colls
  719k     0     0        98M       719k     0        98M     0
  716k     0     0        98M       716k     0        98M     0
  721k     0     0        99M       721k     0        99M     0
  710k     0     0        97M       710k     0        97M     0
  720k     0     0        99M       720k     0        99M     0
Cheers!