Low throughput on Intel X710-DA2 10G-SR
-
Dear Community,
I am facing issues with the network throughput of my nonvirtualized pfSense installation, with my 2x 10Gbps connection i am only getting around 2x 1Gbps in total.
My Setup:
- 2.4.5-RELEASE-p1 (amd64) - no vm
- Intel(R) Xeon(R) CPU E5-2637 v2 @ 3.50GHz 16 CPUs: 2 package(s) x 4 core(s) x 2 hardware threads
- Intel X710-DA2 with 2x 10G SR original SFP+ (1x WAN; 1x LAN)
- Connected to Cisco X2-10G-SR
Connection is on both sides established as 10G-SR, but the throughput is only around 1Gbps, tested with iperf to an identical server running on debian 10. The debian server (also Intel X710-DA2) can establish a 10Gbps connection to other servers in the network, so the the issue is apparently within my pfSense installation. What can i do to reach the expected performance of 10G?
/var/log/dmesg.boot
ixl0: <Intel(R) Ethernet Connection 700 Series PF Driver, Version - 1.11.9-k> mem  irq 40 at device 0.0 numa-domain 0 on pci7
ixl0: using 1024 tx descriptors and 1024 rx descriptors
ixl0: fw 4.40.35115 api 1.4 nvm 4.53 etid 80001dc0 oem 1.263.0
ixl0: PF-ID[0]: VFs 64, MSIX 129, VF MSIX 5, QPs 768, I2C
ixl0: Using MSIX interrupts with 9 vectors
ixl0: Allocating 8 queues for PF LAN VSI; 8 queues active
ixl0: Ethernet address:
ixl0: PCI Express Bus: Speed 8.0GT/s Width x8
ixl0: SR-IOV ready
ixl0: netmap queues/slots: TX 8/1024, RX 8/1024
ixl1: <Intel(R) Ethernet Connection 700 Series PF Driver, Version - 1.11.9-k> mem  40 at device 0.1 numa-domain 0 on pci7
ixl1: using 1024 tx descriptors and 1024 rx descriptors
ixl1: fw 4.40.35115 api 1.4 nvm 4.53 etid 80001dc0 oem 1.263.0
ixl1: PF-ID[1]: VFs 64, MSIX 129, VF MSIX 5, QPs 768, I2C
ixl1: Using MSIX interrupts with 9 vectors
ixl1: Allocating 8 queues for PF LAN VSI; 8 queues active
ixl1: Ethernet address:
ixl1: PCI Express Bus: Speed 8.0GT/s Width x8
ixl1: SR-IOV ready
ixl1: netmap queues/slots: TX 8/1024, RX 8/1024
Thank you in advance!
Regards
Marius -
hi,
it's a real power - machine...
- which is sure to check "Hardware Checksum Offloading" as well!!!
-useful guide, though not specifically for the 10Gig category
https://docs.netgate.com/pfsense/en/latest/hardware/tuning-and-troubleshooting-network-cards.html
-and finally it may be the key to the solution
@stephenw10 he is the expert on these hardwarehe will see that you need help

++++edit:
this is a very suspicious value anyway
@Tryano95 "but the throughput is only around 1Gbps"I have an old I350 tuning guide, not related your current question, but there are tweaks in it:
which will be usable in your future plans as well, such as EEE and flow control disabling, etc.
(this is of course invented for igb (4), but can also be applied to ixl (4)) - which is sure to check "Hardware Checksum Offloading" as well!!!
-
Is it linked at 10G? What does
ifconfig -vmashow?Yes, 1Gbps throughput seems suspiciously like part of you test is using a 1G connection.
How exactly are you testing? What command are you running?
What is the actual result you see?
Steve
-
@DaddyGo
Yes, it is really powerful, I am using it in our dorm (connected to our universities network) as an powerful nat-gw, with hopefully soon close to 10gbps
Thank you so much for taking your time to help me, I will look into this
-
@stephenw10
Hey Steve, thank you for your help!
Yes, it is linked with 10G. Connected to the same linecard as the identical debian server.ifconfig -vma:
ixl0: flags=8843<UP,BROADCAST,RUNNING,SIMPLEX,MULTICAST> metric 0 mtu 1500
        options=6400bb<RXCSUM,TXCSUM,VLAN_MTU,VLAN_HWTAGGING,JUMBO_MTU,VLAN_HWCSUM,VLAN_HWTSO,RXCSUM_IPV6,TXCSUM_IPV6>
        capabilities=7507bb<RXCSUM,TXCSUM,VLAN_MTU,VLAN_HWTAGGING,JUMBO_MTU,VLAN_HWCSUM,TSO4,TSO6,LRO,VLAN_HWFILTER,VLAN_HWTSO,NETMAP,RXCSUM_IPV6,TXCSUM_IPV6>
        ether
        hwaddr
        inet6 X prefixlen 64 scopeid 0x5
        inet X.X.X.X netmask 0xffffff00 broadcast X.X.X.X
        ---lots of VIP's for NAT
        nd6 options=21<PERFORMNUD,AUTO_LINKLOCAL>
        media: Ethernet autoselect (10Gbase-SR <full-duplex>)
        status: active
        supported media:
                media autoselect
                media 10GBase-SFI
                media 10Gbase-LR
                media 10Gbase-SR
                media 10Gbase-Twinax
                media 1000baseLX
                media 1000baseSX
        plugged: SFP/SFP+/SFP28 10G Base-SR (LC)
        vendor: Intel Corp PN: FTLX8571D3BCV-IT SN: DATE: 2015-02-21
        module temperature: 33.57 C Voltage: 3.35 Volts
        RX: 0.55 mW (-2.58 dBm) TX: 0.62 mW (-2.04 dBm)
ixl1: flags=8843<UP,BROADCAST,RUNNING,SIMPLEX,MULTICAST> metric 0 mtu 1500
        options=6400bb<RXCSUM,TXCSUM,VLAN_MTU,VLAN_HWTAGGING,JUMBO_MTU,VLAN_HWCSUM,VLAN_HWTSO,RXCSUM_IPV6,TXCSUM_IPV6>
        capabilities=7507bb<RXCSUM,TXCSUM,VLAN_MTU,VLAN_HWTAGGING,JUMBO_MTU,VLAN_HWCSUM,TSO4,TSO6,LRO,VLAN_HWFILTER,VLAN_HWTSO,NETMAP,RXCSUM_IPV6,TXCSUM_IPV6>
        ether
        hwaddr
        inet6 X prefixlen 64 scopeid 0x6
        inet6 X prefixlen 64 scopeid 0x5
        inet X.X.X.X netmask 0xffffff00 broadcast X.X.X.X
        ---lots of VIP's for NAT
        nd6 options=21<PERFORMNUD,AUTO_LINKLOCAL>
        media: Ethernet autoselect (10Gbase-SR <full-duplex>)
        status: active
        supported media:
                media autoselect
                media 10GBase-SFI
                media 10Gbase-LR
                media 10Gbase-SR
                media 10Gbase-Twinax
                media 1000baseLX
                media 1000baseSX
        plugged: SFP/SFP+/SFP28 10G Base-SR (LC)
        vendor: Intel Corp PN: FTLX8571D3BCV-IT SN: DATE: 2014-07-20
        module temperature: 33.88 C Voltage: 3.31 Volts
        RX: 0.60 mW (-2.19 dBm) TX: 0.64 mW (-1.88 dBm)
lo0: flags=8049<UP,LOOPBACK,RUNNING,MULTICAST> metric 0 mtu 16384
        options=680003<RXCSUM,TXCSUM,LINKSTATE,RXCSUM_IPV6,TXCSUM_IPV6>
        capabilities=680003<RXCSUM,TXCSUM,LINKSTATE,RXCSUM_IPV6,TXCSUM_IPV6>
        inet6 ::1 prefixlen 128
        inet6 fe80::1%lo0 prefixlen 64 scopeid 0x7
        inet 127.0.0.1 netmask 0xff000000
        nd6 options=21<PERFORMNUD,AUTO_LINKLOCAL>
        groups: lo
enc0: flags=0<> metric 0 mtu 1536
        nd6 options=21<PERFORMNUD,AUTO_LINKLOCAL>
        groups: enc
pfsync0: flags=0<> metric 0 mtu 1500
        groups: pfsync
pflog0: flags=100<PROMISC> metric 0 mtu 33160
        groups: pflog
I am testing with iperf to an iperf-Server in the universities network.
Output pfSense:
iperf -c --IP-iperf-Server--
------------------------------------------------------------
Client connecting to --IP-iperf-Server--, TCP port 5001
TCP window size:  336 KByte (default)
------------------------------------------------------------
[  3] local --IP-Client-- port 54607 connected with --IP-iperf-Server-- port 5001
[ ID] Interval       Transfer     Bandwidth
[  3]  0.0-10.1 sec   562 MBytes   468 Mbits/sec
Output identical server debian:
iperf -c --IP-iperf-Server--
------------------------------------------------------------
Client connecting to --IP-iperf-Server--, TCP port 5001
TCP window size: 85.0 KByte (default)
------------------------------------------------------------
[  3] local --IP-Client-- port 59112 connected with --IP-iperf-Server-- port 5001
[ ID] Interval       Transfer     Bandwidth
[  3]  0.0-10.0 sec  10.9 GBytes  9.37 Gbits/sec
Output pfSense to debian (same Linecard):
iperf -c --IP-debian--
------------------------------------------------------------
Client connecting to --IP-debian--, TCP port 5001
TCP window size:  376 KByte (default)
------------------------------------------------------------
[  3] local --IP-pfSense-- port 1526 connected with --IP-debian-- port 5001
[ ID] Interval       Transfer     Bandwidth
[  3]  0.0-10.0 sec  1.83 GBytes  1.57 Gbits/sec
Thank you!
Marius---edit---
Switchport LAN&WAN of pfSense both say:Full-duplex, 10Gb/s, link type is auto, media type is 10GBase-SR -
Hi,
still Stephen in this theme the mng.
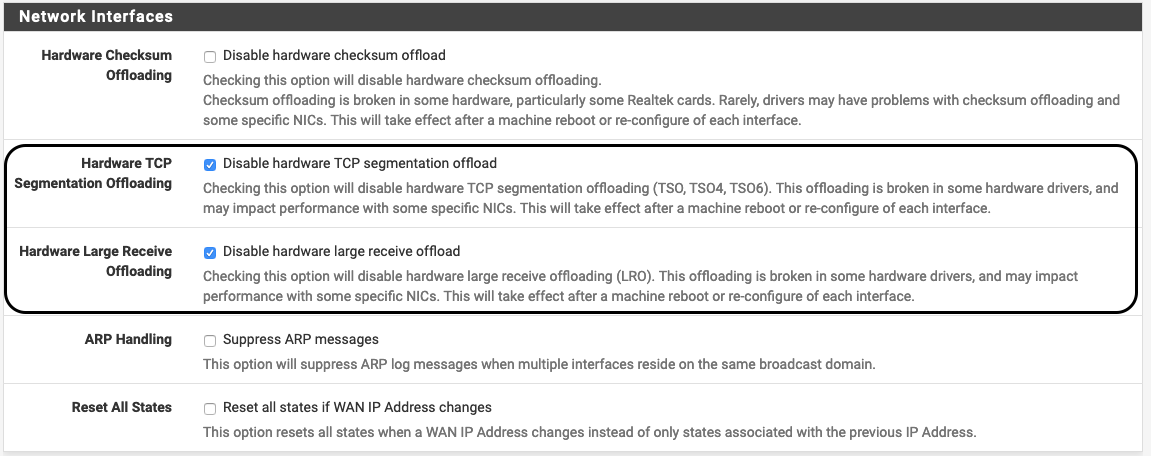
but what I see is that they failed to disable them:Hardware Checksum Offloading
Hardware TCP Segmentation Offloading
Hardware Large Receive Offloading
RXCSUM, TXCSUM, etc
reminder, these will only take effect if you restart NGFW
the best way is to load it into loader.conf.local (so it is not affected by FW update)
net.inet.tcp.tso=0
net.inet.tcp.lro=0
etc. -
Are you testing directly from pfSense itself there? That will always give you a worse result that testing through it.
The correct test here would be something like:
iperf client on Debian <---> pfSense <---> upstream local iperf server
Those NICs are loading 8 queues and the box has a 16 core CPU so you might also try 8 parallel streams using the switch
-P 8.Also try running on pfSense
top -aSHwhile you're testing so see how the load is being spread there.
Though I would expect just one of those cores to pass 1Gbps....Steve
-
@stephenw10
Yes, i am testing from pfSense, and i was just wondering about the bad throughput result with iperf.
The debian server is in the same subnet as the pfSense wan-interface.NAT-Clients <---> pfSense <--10G--> Cisco-Router <--10G--> Uplink debian <--10G--> Cisco-Router <--10G--> UplinkOutput with 8 parallel streams:
iperf -c --IP-iperf-Server-- -P 8
------------------------------------------------------------
Client connecting to --IP-iperf-Server--, TCP port 5001
TCP window size: 64.2 KByte (default)
------------------------------------------------------------
[  9] local --IP-pfSense-- port 11410 connected with --IP-iperf-Server-- port 5001
[  7] local --IP-pfSense-- port 40453 connected with --IP-iperf-Server-- port 5001
[  8] local --IP-pfSense-- port 29998 connected with --IP-iperf-Server-- port 5001
[  6] local --IP-pfSense-- port 22254 connected with --IP-iperf-Server-- port 5001
[ 10] local --IP-pfSense-- port 31109 connected with --IP-iperf-Server-- port 5001
[  5] local --IP-pfSense-- port 14773 connected with --IP-iperf-Server-- port 5001
[  4] local --IP-pfSense-- port 65225 connected with --IP-iperf-Server-- port 5001
[  3] local --IP-pfSense-- port 18818 connected with --IP-iperf-Server-- port 5001
[ ID] Interval       Transfer     Bandwidth
[  9]  0.0-10.0 sec   641 MBytes   538 Mbits/sec
[  7]  0.0-10.0 sec   639 MBytes   536 Mbits/sec
[  8]  0.0-10.0 sec   598 MBytes   501 Mbits/sec
[  6]  0.0-10.0 sec  1.33 GBytes  1.15 Gbits/sec
[ 10]  0.0-10.0 sec  1.18 GBytes  1.01 Gbits/sec
[  5]  0.0-10.0 sec   613 MBytes   514 Mbits/sec
[  4]  0.0-10.0 sec  1.19 GBytes  1.02 Gbits/sec
[  3]  0.0-10.0 sec  1.16 GBytes   997 Mbits/sec
[SUM]  0.0-10.0 sec  7.29 GBytes  6.26 Gbits/sec
I was able to get a much better throughput (because of the parallel streams), it seems like the load is spread to 2 to 4 CPUs. What i did not test until now is to get a 10G connection through pfSense like:
debian <--10G--> pfSense <--10G--> Router <--10G--> UplinkHm, i was thinking, that when the iperf from pfSense is not able to get more than ~1Gbps, than the throughput will be also around that speed ... so the clients behind pfSense will get in total around 10Gbps (like 10x 1G)? A single connection through pfSense will also be able to get a speed of around 10gbps (1x 10G)?
@DaddyGo
Is it still useful in my case to enable:- Hardware Checksum Offloading
- Hardware TCP Segmentation Offloading
- Hardware Large Receive Offloading
Thank you both for your answers!
Marius -
@Tryano95 said in Low throughput on Intel X710-DA2 10G-SR:
@DaddyGo
*> Is it still useful in my case to enable:Hardware Checksum Offloading
Hardware TCP Segmentation Offloading
Hardware Large Receive Offloading*you mean, disable it......
generally telling that yes (these must be disabled (checked)),........and yes in any case (my opinion)

if you are using IPS (Suricata / Snort) with netmap it is mandatory!!!LRO, TSO these things are good for you if you are an endpoint - it's not good if you're a router..
I will help you with a few useful links I have collected over the years (in this theme):
https://forum.netgate.com/topic/137835/suricata-inline-with-igb-nics
https://calomel.org/freebsd_network_tuning.html++++edit:
of course loader.conf.local is the right way -
@Tryano95 said in Low throughput on Intel X710-DA2 10G-SR:
Hm, i was thinking, that when the iperf from pfSense is not able to get more than ~1Gbps, than the throughput will be also around that speed ...
You will always see better speed through pfSense than directly to or from it. pfSense is not optimised as a TCP end point. Running iperf uses significant CPU cycles itself that could otherwise be routing packets. That's especially true if ut ends up using the same cores.
top -aSHwould show you that.Steve
-
Thank you both. System is working fine.

Marius -
You welcome