Grafana Dashboard using Telegraf with additional plugins
-
Hi Guys,
I have built pfsense with grafana etc. However I am trying to figure it out how to setup addons,
https://forum.netgate.com/topic/152132/grafana-dashboard-using-telegraf-with-additional-plugins
"Does /usr/local/bin/python3.7 exist on your pfSense system? If so, use this telegraf_gateways-3.7.py"
How could I upload this file to pfesense? as I do not see it in pfsense file hierarchy. Thanks for help
-
"Does /usr/local/bin/python3.7 exist on your pfSense system? If so, use this telegraf_gateways-3.7.py"
The addons can be downloaded from the repo - look under plugins. https://github.com/VictorRobellini/pfSense-Dashboard
How could I upload this file to pfesense? as I do not see it in pfsense file hierarchy. Thanks for help
use an FTP program - my preference is Filezilla.
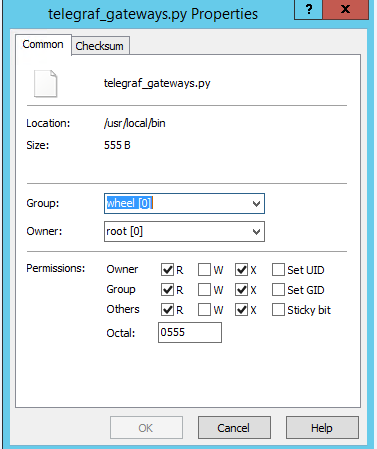
Make sure you set the permissions as per instructions - https://github.com/VictorRobellini/pfSense-Dashboard#plugins
-
Looks like this is still working under the new P1 release - just a heads up! :)
-
Hi, my dears friends, i´m searching for a visualizer or dashboard
to view live firewall activity.Does this tool or utility exist?
thanks
Grafana its like a dashboard to see Active Users
Uptime
CPU Load total
Disk Utilization
Memory Utilization
CPU Utilization per core (Single Graph)
Ram Utilization time graph
Load Average
Load Average Graph
CPU and ACPI Temperature Sensors
pfBlocker IP Stats
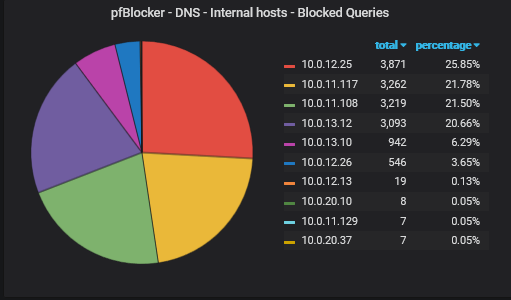
pfBlocker DNS Stats
Gateway Response time - dpinger
List of interfaces with IP, MAC, Status and pfSesnse labels thanks to /u/trumee
WAN Statistics - Traffic & Throughput (Identified by dashboard variable)
LAN Statistics - Traffic & Throughput (Identified by dashboard variable)
Unbound stats - Plugin and config included and working but not implemented -
I would highly suggest reading the linked github page on the initial post and then reforming your question.
-
First of all really love your tutorial and work, i have installed all of the stuff, receiving data in influxDB and connected to Grafana and added dashboard.
But,
I am not receiving data from pfblocker, i see such as dnsbl log on influxdb but when i expand that o don't see anyting. I am using pfblocker-ng Devel
On the Grafana dashboard i see only data from Disk Utlizization. On influxDB i see well CPU/Memory etc..
I have uploaded the telegraf plugins using Wincp and gived 0555 permissions using Wincscp.
What is really my problem too look up?
-
@erbalo Please review the troubleshooting section that's posted on GitHub
-
Is this correct? I did gived the permission via WinSCP.
Also i don't get the Downloads/Uploads state.
-
@erbalo You need to enable logging using the instructions on the github link above and it should point you in the right direction.
-
@bigjohns97 Just successfully enabled the logs in telegraf and what i am now seeing is lot of entry's in the logs:
D! Grok no match found for: "May 25 17:34:24 ...................
It points to my WAN gateway and WAN interface.
What should be the next too look up?
-
This post is deleted! -
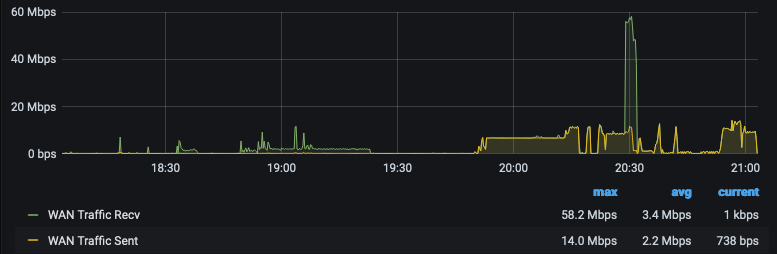
How easy is change the show the speeds as MBPS instead of MB/s?
This is which i am seeing on your original Git page:
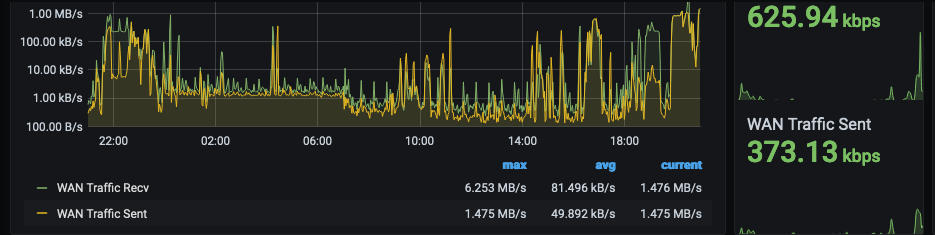
and this is what i want(downloaded from grafana.com from your dashboard):
-
@erbalo So you want the big graph to be bits per second and the smaller one to be bytes per second? If so, it should be really easy to do. Just look at the Queries and Visualizations when you edit the graph.
-
@VictorRobellini said in Grafana Dashboard using Telegraf with additional plugins:
@erbalo So you want the big graph to be bits per second and the smaller one to be bytes per second? If so, it should be really easy to do. Just look at the Queries and Visualizations when you edit the graph.
Thanks , it solved now. I have added *8 after the bytes)
Another question:
When i look this graph, it is not really my montly WAN download and upload. It updates well and working but is not correct. What is going wrong here?
SELECT sum("bytes_recv") / 1000000 FROM "net" WHERE ("host" =~ /^MYROUTERNAME.MYROUTERDOMAIN$/ AND "interface" =~ /^ipx0$/) AND time >= 1598911200000ms GROUP BY time(30m) fill(previous)
-
Did you remove the below from your Dashboard upload file? If so how do we turn it back on?
-
@cburbs said in Grafana Dashboard using Telegraf with additional plugins:
Did you remove the below from your Dashboard upload file? If so how do we turn it back on?
load the old JSON dashbord as new and copy that panel and paste on your new Dashboard.
-
@cburbs It still appears on my dashboard. I'll do another sync this weekend.
-
@erbalo If the question is "Why doesn't the total data transferred for the last 30 days or month not match what my ISP is showing as my total transferred for the last 30 days or month", I'm not sure. How far off are the numbers? It could either be the query and calculation happening in Grafana or a question for the broader pfSense forums.
-
@erbalo That worked if I copied the code from here - https://github.com/VictorRobellini/pfSense-Dashboard
I originally pulled it from here though - https://grafana.com/grafana/dashboards/12023
Does the one at Grafana not get updated?
-
It would be too much of a PITA to update both. Plus GitHub is a much better place to host the project since there are multiple readmes, additional files, bugs, and merge/pull options. Formatting things in the right way isn't possible on Grafana's site.
Which is why the very first line of my Grafana post reads:
For the latest version, visit: https://github.com/VictorRobellini/pfSense-Dashboard