NTP not syncing with clients
-
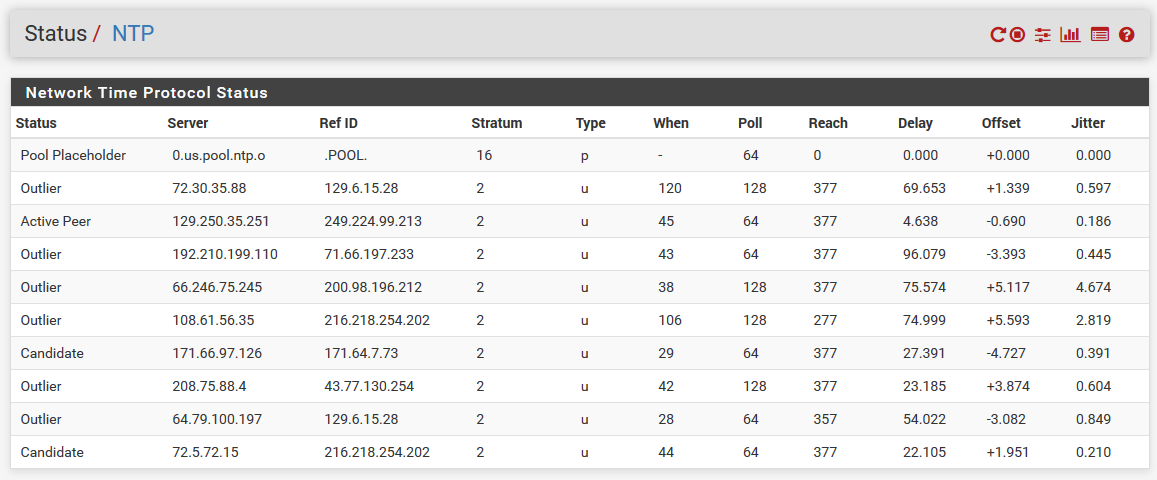
I am having an issue with the NTP service on my pfSense box... Even though the NTP status appears to be synchronized (active peer and reach is 377), the NTP service seems to always be reporting "clock unsynchronized" to clients with 1970 timestamps (packet capture below) - no matter how long I let it sit for and settle.
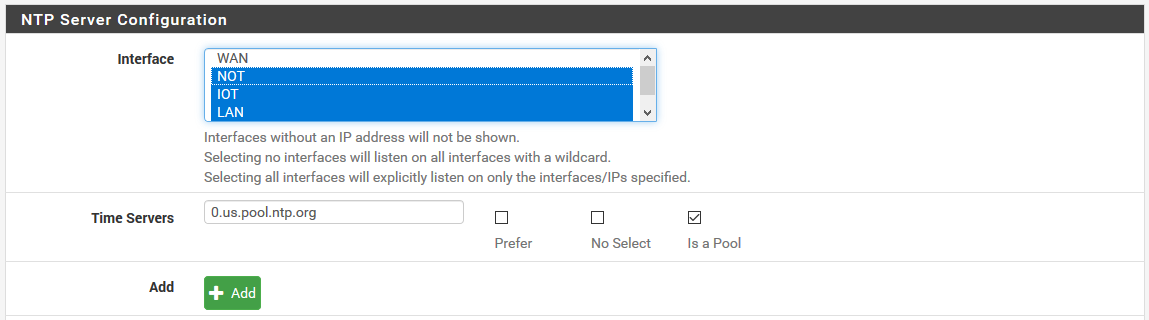
Here's my NTP service settings:
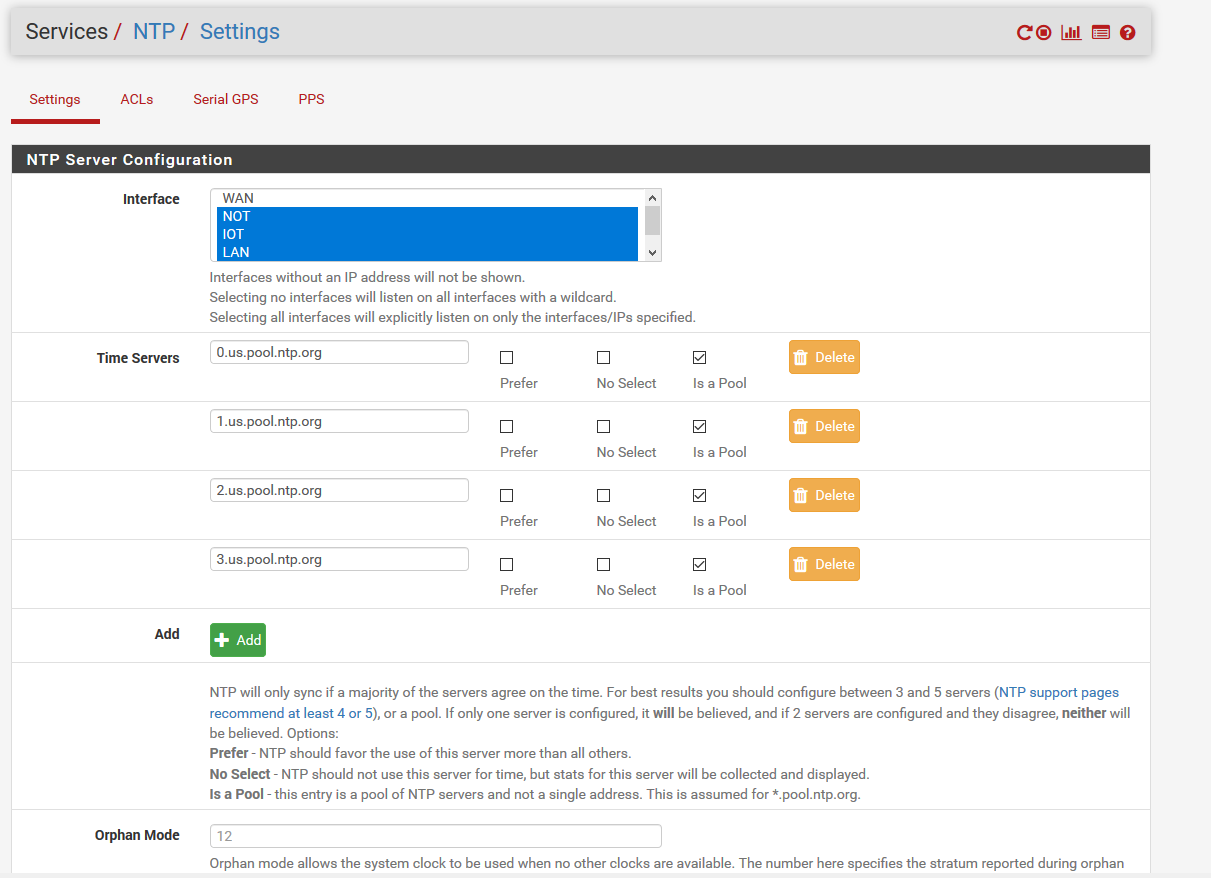
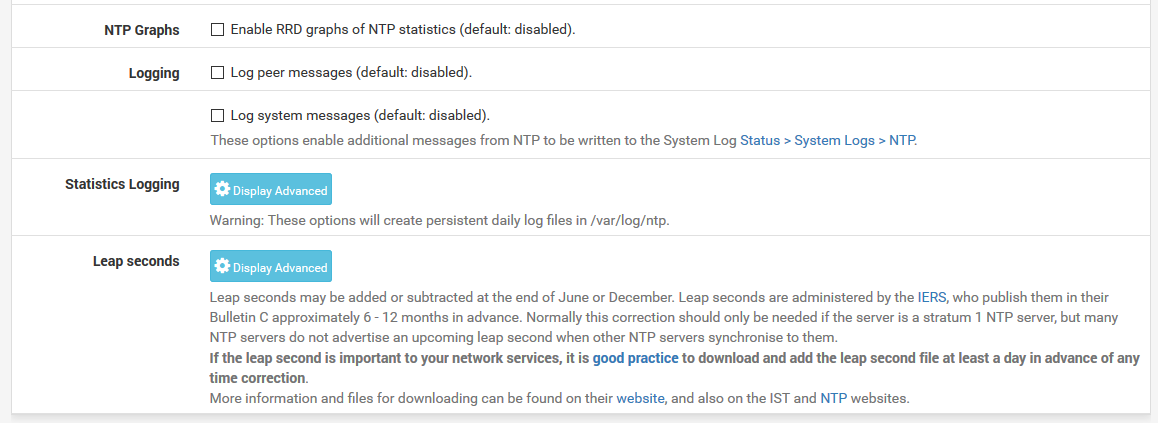
Is there something wrong with my NTP settings that could be causing this?
Here's a capture I made showing a device (assigned 192.168.99.101) trying to sync with the NTP service on pfSense (which is listening as 192.168.99.1 on one of my VLANs):
13:30:21.101861 IP 192.168.99.1.67 > 192.168.99.101.68: UDP, length 300
13:30:21.110722 IP 192.168.99.1.67 > 192.168.99.101.68: UDP, length 300
13:30:21.116057 ARP, Request who-has 192.168.99.101 tell 192.168.99.101, length 42
13:30:21.122887 ARP, Request who-has 192.168.99.1 tell 192.168.99.101, length 42
13:30:21.122893 ARP, Reply 192.168.99.1 is-at 00:30:18:02:53:ab, length 28
13:30:21.144686 IP 192.168.99.101.52482 > 192.168.99.1.123: UDP, length 48
13:30:21.144781 IP 192.168.99.1.123 > 192.168.99.101.52482: UDP, length 48
13:30:21.146262 IP 192.168.99.101.52483 > 192.168.99.1.123: UDP, length 48
13:30:21.146319 IP 192.168.99.1.123 > 192.168.99.101.52483: UDP, length 48
13:30:21.148008 IP 192.168.99.101.52484 > 192.168.99.1.123: UDP, length 48
13:30:21.149776 IP 192.168.99.101 > 192.168.99.1: ICMP 192.168.99.101 udp port 52483 unreachable, length 36
13:30:26.145077 IP 192.168.99.101.52485 > 192.168.99.1.123: UDP, length 48
13:30:31.147924 IP 192.168.99.101.52486 > 192.168.99.1.123: UDP, length 48
13:30:31.148016 IP 192.168.99.1.123 > 192.168.99.101.52486: UDP, length 48
13:30:36.148548 IP 192.168.99.101.52487 > 192.168.99.1.123: UDP, length 48
13:30:41.149637 IP 192.168.99.101.52488 > 192.168.99.1.123: UDP, length 48
13:30:41.149727 IP 192.168.99.1.123 > 192.168.99.101.52488: UDP, length 48
13:30:46.151792 IP 192.168.99.101.52489 > 192.168.99.1.123: UDP, length 48
13:30:51.151898 IP 192.168.99.101.52490 > 192.168.99.1.123: UDP, length 48
13:30:51.151981 IP 192.168.99.1.123 > 192.168.99.101.52490: UDP, length 48
13:30:56.152957 IP 192.168.99.101.52491 > 192.168.99.1.123: UDP, length 48
13:31:01.153947 IP 192.168.99.101.52492 > 192.168.99.1.123: UDP, length 48
13:31:01.154041 IP 192.168.99.1.123 > 192.168.99.101.52492: UDP, length 48
13:31:06.154976 IP 192.168.99.101.52493 > 192.168.99.1.123: UDP, length 48
13:31:11.155826 IP 192.168.99.101.52494 > 192.168.99.1.123: UDP, length 48
13:31:11.155905 IP 192.168.99.1.123 > 192.168.99.101.52494: UDP, length 48
13:31:16.159319 IP 192.168.99.101.52495 > 192.168.99.1.123: UDP, length 48
13:31:21.157903 IP 192.168.99.101.52496 > 192.168.99.1.123: UDP, length 48
13:31:21.157992 IP 192.168.99.1.123 > 192.168.99.101.52496: UDP, length 48
13:31:26.159026 IP 192.168.99.101.52497 > 192.168.99.1.123: UDP, length 48
13:31:31.159941 IP 192.168.99.101.52498 > 192.168.99.1.123: UDP, length 48
13:31:31.160035 IP 192.168.99.1.123 > 192.168.99.101.52498: UDP, length 48
13:31:36.270631 IP 192.168.99.101.63063 > 192.168.107.5.1883: tcp 0
13:31:36.271039 IP 192.168.107.5.1883 > 192.168.99.101.63063: tcp 0
13:31:36.272103 IP 192.168.99.101 > 224.0.0.251: igmp
13:31:36.272553 IP 192.168.99.101.63063 > 192.168.107.5.1883: tcp 0
13:31:36.423818 IP 192.168.99.101 > 224.0.0.251: igmp
It will just sit indefinitely trying to sync the time with the NTP service, with the NTP service only ever sending a default timestamp of 1970 (packet details below), yet there's an odd behavior I've found (which is when it finally showed the successful sync above): If I simply just press the "Save" button on the NTP service page in pfSense (and not changing anything), pfSense will send a valid NTP response and the device will sync at that moment (but only once - I have to do it again if I want it to sync again a few minutes later). I'm guessing it defaults to some fallback when the NTP service is reset and reinitializing? Though, I thought the reported stratum should be 12 to signify that it's in Orphan mode if that's the case, from the pfSense settings, but it appears that it's always reporting a stratum of zero.
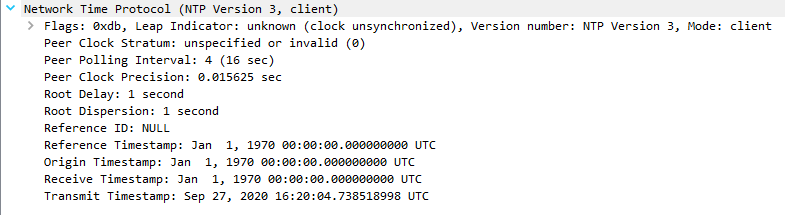
Here's the only server response when it's stuck in the sync loop, no matter how long I let it run for and long after the NTP status has an active peer and reach of 377:
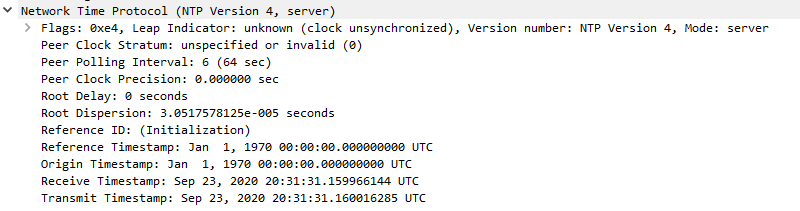
Yet here's the valid NTP packet that will get sent from the NTP service after I hit "Save":
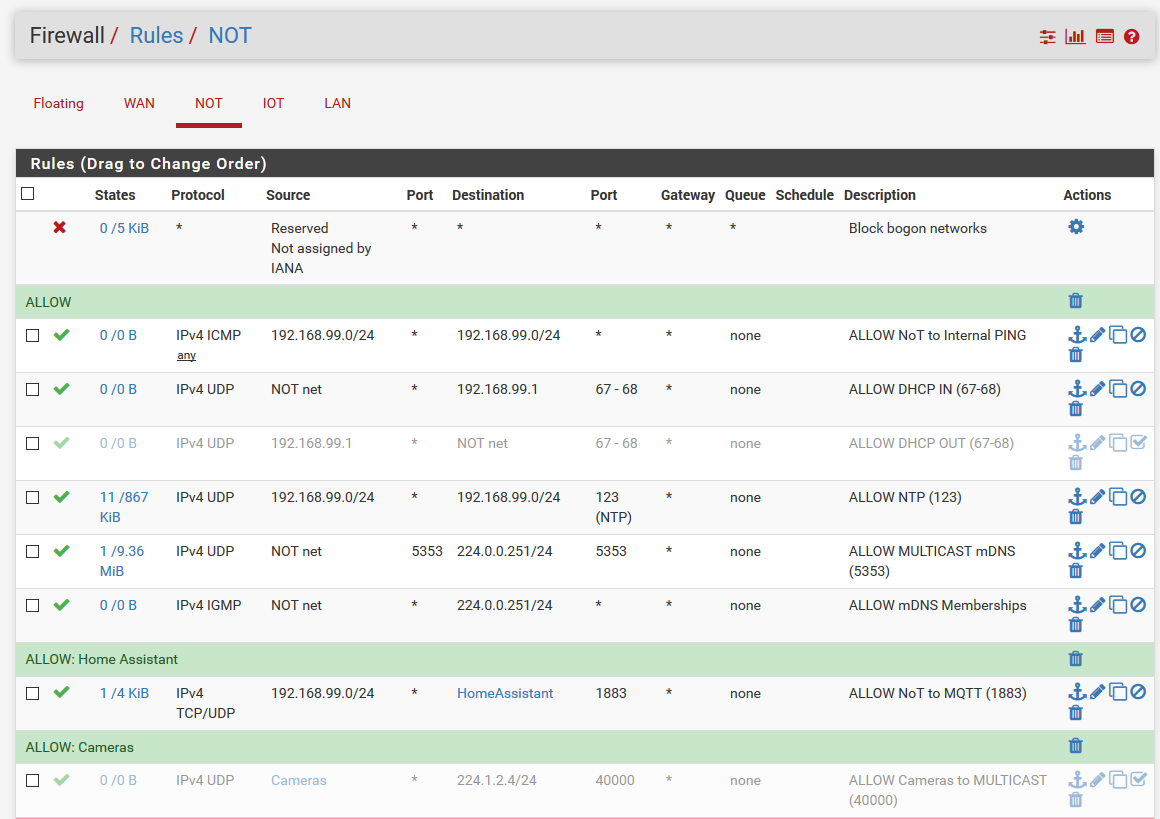
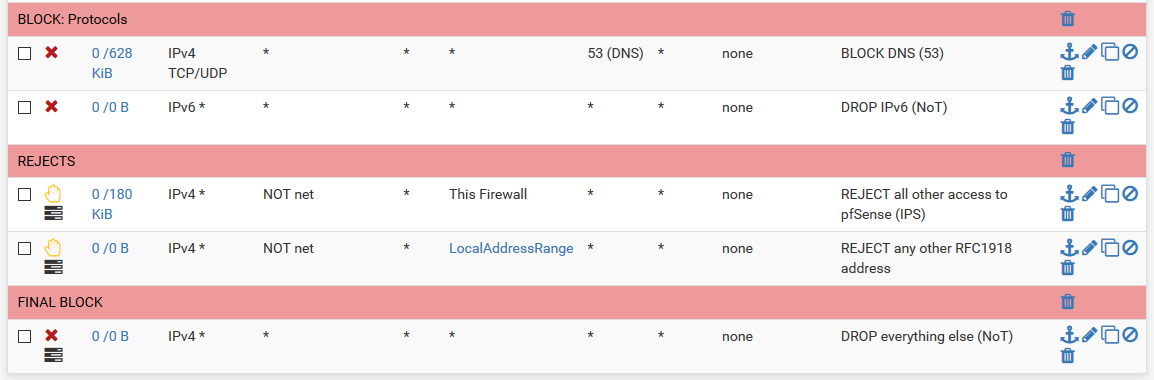
Here's my current firewall rules:
Any ideas what's going on?
-
Is pfSense itself syncing with those servers? Timezone set correctly?
You don't need more than one pool address there.
Steve
-
@stephenw10 Yes, pfSense was syncing to that same list of pools. I just removed all of the other pools, as you suggested now though:

If I run "ntpdate pool.ntp.org" from the command prompt on pfSense, I get the following (so it's synced since the offset is low):

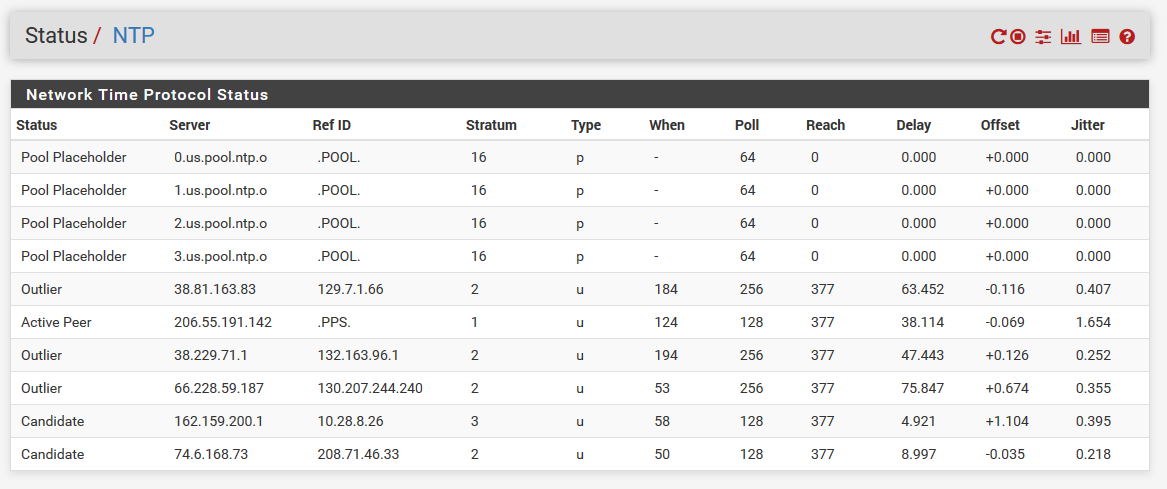
After those changes and after waiting a bit for it to settle, here's the current NTP status:
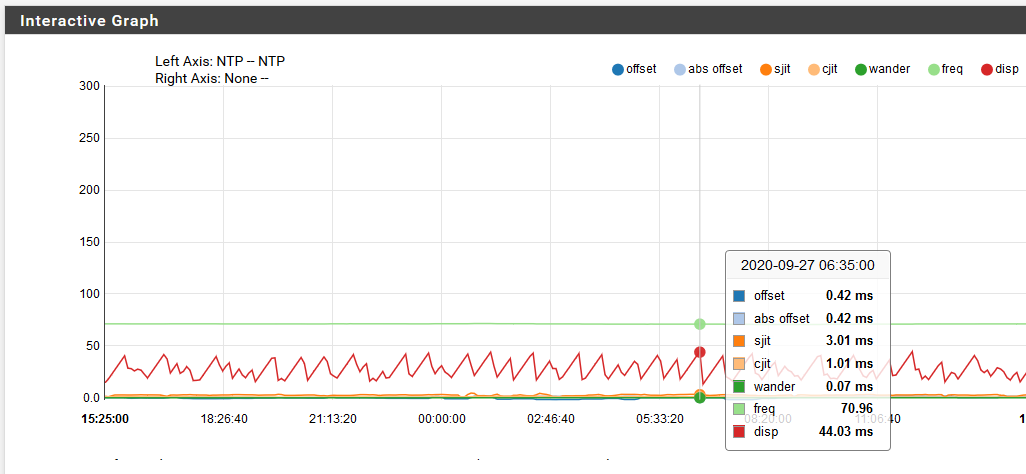
The NTP graph looks ok over time, too, I think:
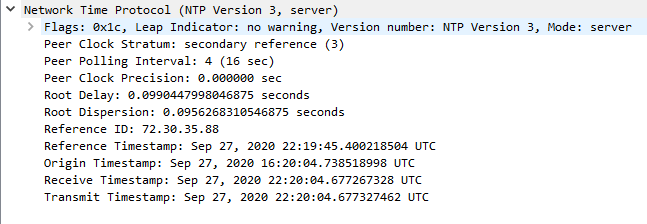
So I just ran a packet capture and noticed an odd behavior, which may mean something to you. I saw that one of my other devices requested an NTP sync and it worked:
Then, if I do the same with the device I am interested in, the following happens:
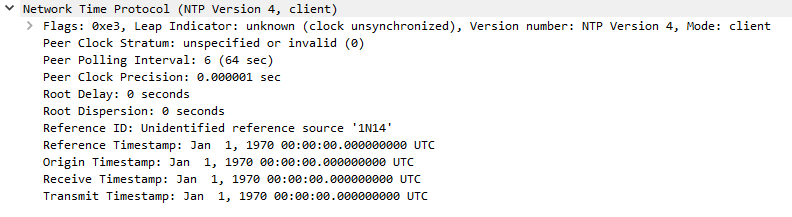
Request:
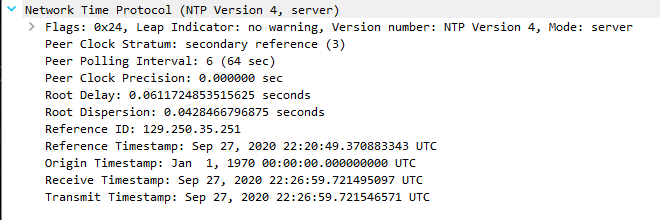
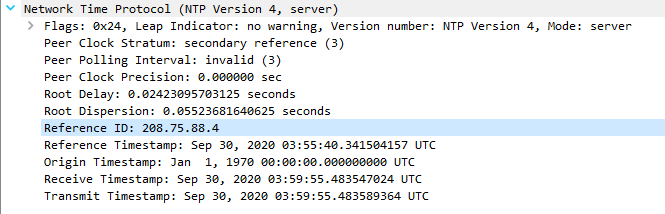
Response (Looks correct):
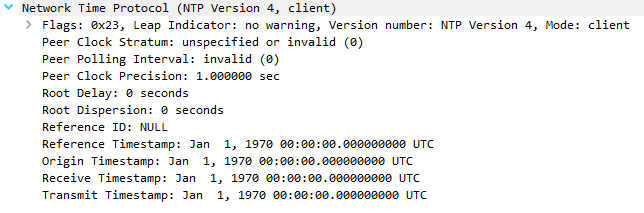
But then the client does another request 5 seconds after (perhaps to confirm), yet now the pfSense NTP service only reports a 1970 timestamp and says "unsynchronized" (no longer stratum 3), and this then continues indefinitely (client request >> 1970 response >> client request >> etc.):
So why does pfSense provide the correct time only once to the client, and then not again if the client requests a few seconds later? Is there some sort of minimum time allowed between requests?
-
Why do you have an o after your 0. us.pool.ntp it should be 0.us.pool.ntp.org
-
Not related :
This :
is not needed as they already (hidden ;) ) exist as soon as you activate a DHCP server on that interface.
This explains the leading 0/0. -
@Impatient said in NTP not syncing with clients:
Why do you have an o after your 0. us.pool.ntp it should be 0.us.pool.ntp.org
It's just the ntp output truncating it. You can see the actual urls are correct in the settings. Plus it's actually pulling IPs from the pool to connect to.

Steve
-
@Gertjan Yep, that was just a residual sanity check. Removed it now.
@stephenw10 Yeah, it's pulling IPs correctly from the pool and looks to be properly synchronizing the time, from the looks of the NTP service status page (screenshot above).
Any idea why the NTP service will only send a valid timestamp after the initial request, and then no longer after that?
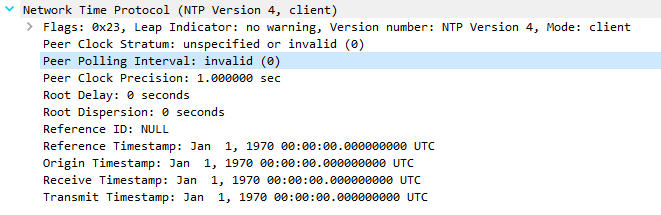
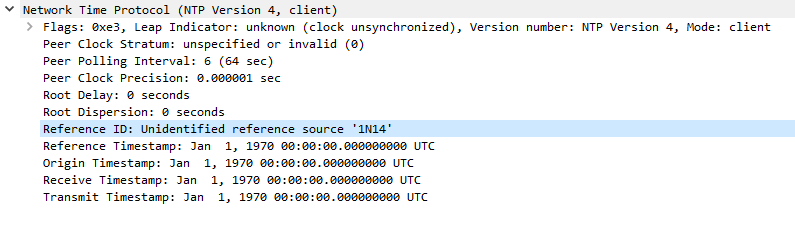
I noticed that the client request looks different (e.g. Peer polling interval, Leap indicator) after the 1st request, but that may be how Wireshark is parsing the data:
1st request:

Subsequent requests:

With NTP, is the client supposed to send its current timestamp with the request? The client, on boot, would have a timestamp of zero (so 1970), so is there something going on with the NTP service giving a null timestamp because the client's timestamp is substantially offset?
-
Hmm, not really I'm afraid. ntpd is a fickle beast!
If you set the client time/date manually to something close to the real time does it then sync?
I have seen clients that did that before.Steve
-
@Yo5hi said in NTP not syncing with clients:
The client, on boot, would have a timestamp of zero (so 1970)
The local clock is dead ?
IMHO, ntp syncs to correct small differences. Not decades. It would take centuries to bridge such a gap - NTP corrects using small portions. -
@Gertjan said in NTP not syncing with clients:
The local clock is dead ?
Or more likely the CMOS battery. That's very common on older computers.
-
@Yo5hi said in NTP not syncing with clients:
With NTP, is the client supposed to send its current timestamp with the request?
Yes..
here is my client starting its sync process..
You can see its currently not sync'd - will be back once it synced and show you the client packet
currently it has just stared
ntpq> pe
     remote           refid      st t when poll reach   delay   offset  jitter
==============================================================================
*ntp.local.lan   .PPS.            1 u   62   64    7    0.623   -1.238   0.930
edit: ok now showing sync'd, notice the leap indicator went away..and showing reach of 377, and have * next to the server
ntpq> pe
     remote           refid      st t when poll reach   delay   offset  jitter
==============================================================================
*ntp.local.lan   .PPS.            1 u    5   64  377    0.632   +0.357   0.325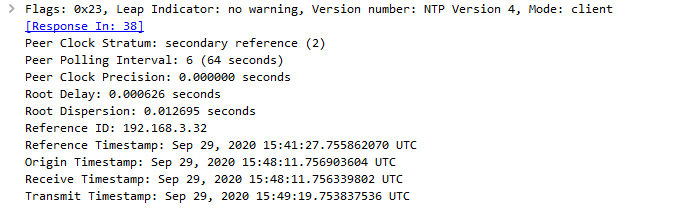
I would really suggest if you can just run the ntp client on it, so you can get lots of info of what is going on with just the ntpq command
-
@johnpoz said in NTP not syncing with clients:
I would really suggest if you can just run the ntp client on it, so you can get lots of info of what is going on with just the ntpq command
One thing you have to watch for, in the name of security bogus times are sometimes used. However, they apparently don't cause problems.
Check through this capture to see some examples of those bogus times.
-
I just manually set the time on the IoT device (it doesn't have a RTC on board or a CMOS) and had it try to sync with the NTP service and got the same behavior. From the packets, it appears that the NTP service on pfSense is throwing some sort of error in the "Reference ID" field though (detailed below).
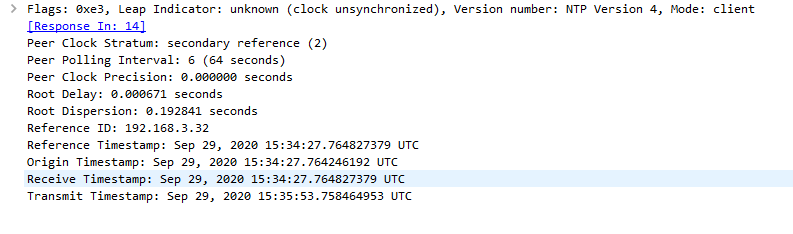
Client's first sync request (it doesn't put its current timestamp in, apparently, even though I set it manually before the sync):
Server's response (looks correct):
Client makes another request 5 seconds later with some differences to 1st request for some reason:
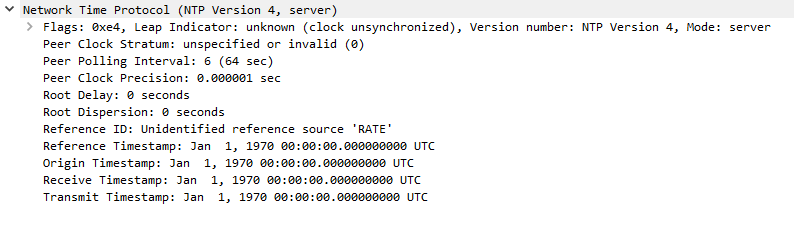
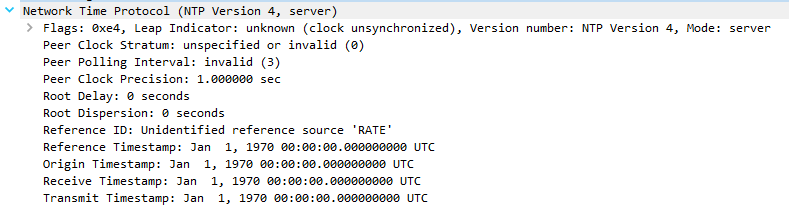
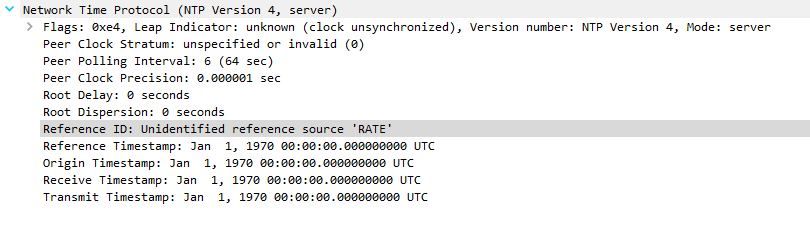
Server response, but now has "Unidentified reference source 'RATE'" and reports and invalid stratum of zero:
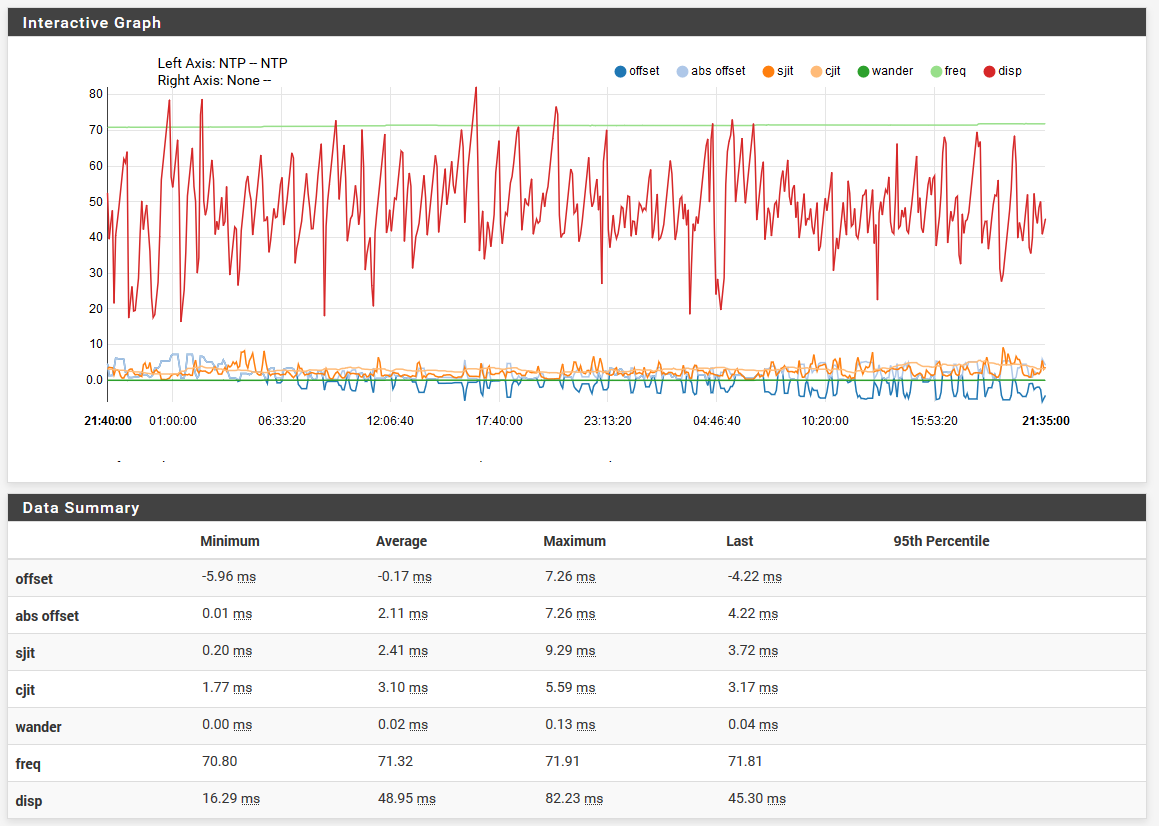
I don't see anything in the System Logs for the NTP service that's an error or anything, and the NTP monitoring data looks fine (within 7ms over the last 24hrs, if I am interpreting it correctly):
What does "Unidentified reference source 'RATE'" mean?
-
Ok, I had a feeling that it was something to do with rate limiting, or the rate that the client is trying to poll the server, so I slowed down the frequency that the client performs retries to sync the clock from every 5 seconds to every 20 seconds and it reliably syncs now after 3-4 attempts.
So it appears that there's some sort of rate limiting or something about NTP that doesn't allow clients to poll it more often than 20 secs or so.
So it's working now - I just wish that my devices don't have to wait 60-80 secs on boot to sync.
Thanks for the help, everyone.
-
@Yo5hi said in NTP not syncing with clients:
I just wish that my devices don't have to wait 60-80 secs on boot to sync.
So, it boots, asks the time ones - got it, and sets it's own clock, and wants be sure and checks up a second time. It pauses the entire system while waiting for that ??
No RTC, bad NTP implementation ... hummm.