Grafana Dashboard using Telegraf with additional plugins
-
Here are a couple of changes that i've done.
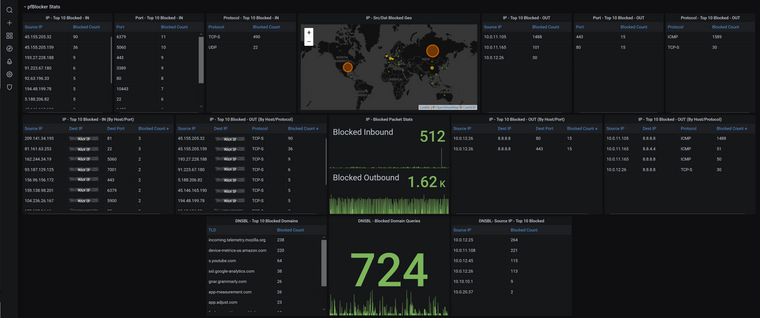
- IP-Top 10 Blocked - OUT
Added the Dest IP to the table
SELECT TOP("count","src_ip",10),dest_ip FROM (SELECT count("action") FROM "autogen"."tail_ip_block_log" WHERE ("host" =~ /^$Host$/ AND "action" = 'block' AND "direction" = 'out') AND $timeFilter GROUP BY "src_ip","dest_ip")
- Changed src_port and dest_port in conf to tags. Copied IP - Top 10 Blocked IN chart and changed the query to:
SELECT TOP("count","dest_port",10) FROM (SELECT count("action") FROM "autogen"."tail_ip_block_log" WHERE ("host" =~ /^$Host$/ AND "action" = 'block' AND "direction" = 'in') AND $timeFilter GROUP BY "dest_port")
Historic data will appear with a null port in this view. new data will show the correct dest port.
-
@wrightsonm
I think ntop or softflowd would probably be a good approach. There are telegraf plugins to capture flow data but building all the graphs and managing the huge volume of data that would fill the influxDB make ntop a much better solution. -
I've spent some time today trying out ntopng. Next week i'll look into integrating it into grafana. Whilst there is an ntopng plugin for grafana, the recommended route appears to use Influxdb.
i.e. https://www.ntop.org/ntop/ntopng-influxdb-and-grafana-a-step-by-step-guide-to-create-dashboards/Another small change i've made to the dashboard is to add data links on urls.
On the IP - Top 10 Blocked - IN view, in the table overrides section, I have added this data link:
Title: Show in GreyNoise
URL: https://viz.greynoise.io/query/?gnql=${__value.raw}
Open In New tab: yes
The result is a link to a page like this:
https://viz.greynoise.io/query/?gnql=125.88.169.233
Summary: Location China, Classification Malicious, Top Tags: SSH Worm. -
I'm running on 1.6.0 and most features of the dashboard work, but strangely, 'Physical address' doesn't pull correctly. On physical interfaces, it just shows 'DOWN'. However, if I explore the InfluxDB in Chronograf, under pfsense.autogen|mac_address I see the correct mac addresses for both of my physical interfaces.
edit
Even directly on the dashboard, if I select 'Interface Summary' | 'Explore' it shows the physical addresses correctly on the table there. -
Update: My problem stems from the 'Value mapping' intended for the 'Status' column. It is being applied to all fields, thereby changing my 'Physical addresses' to 'DOWN', presumably because the MAC addresses start with 0.
Update 2: The solution was to add an override, Filter by Field, Physical Address, Value mappings. Leaving it empty overrides the default value mapping. However, this is kind of a backwards approach, since this value mapping should only be applied to the Status field in the first place, so it should be defined as an override specifically for the Status field as opposed to the entire panel.
-
@seamonkey said in Grafana Dashboard using Telegraf with additional plugins:
The solution was to add an override
What version of Grafana are you using? Check out the Github page to see compatible versions
-
This is as granular as you can really get with the data collected from pfblocker. You could go deeper, but I don't think it would provide any real value. The blank borders around the DNSBL stuff really bug me!
-
Nice work there. I think you have a typo on one of the charts on the left hand side
IP-Top 10 Blocked - OUT (By Host/Protocol) should read IN.
You could probably layout the objects in a different way to end up with less black space in the bottom left /right. Hard to visualise off the top of my head. You might find the layout might work better in columns. i.e. IP - Top 10 Block - * is 3 items in a row. perhaps pivoting it all to be vertical may work better?
To use up the free space, one thing that could be useful is a variation on the blocked packet stats graph. You could create stacked bar charts grouped by ip. This would give a visual indication of the proportion of traffic that is coming from one of your internal devices that is being blocked for outbound, and for inbound would visually highlight when a particular ip is attacking you.
What do you think to my suggestion above about hyperlinking the public ip's to greynoise.io? Or another alternative? Maybe could put the url fragment in a variable so people can pick their favourite ip analysis website?
-
@victorrobellini 7.1.1, but I wouldn't think that would make a difference regarding my particular issue. Your design applies the value mapping function to all fields within the panel, but instead it should only be applied to the Status column exclusively under the Override settings. I've fixed this on my own dashboard and I started to attempt a pull request to fix it, but didn't have the patience to manually adjust only the relevant lines in your JSON file and reimport for testing.
-
I made a few updates to the plugins, telegraf config, and the dashboard.
More gateway details
More pfBlocker details (in a separate panel so you can hide it if you don't care)Screenshot to be updated
-
@victorrobellini exciting. I look forward to the screenshot / git commit.

-
Screenshot updated. The only thing I need to figure out is what to put in the pfSense Details blank space. Adding graphs for the sake of filling space means unnecessary influx queries and CPU usage on the host. I'm running my influx on a J5005 with a bunch of other services. I'll deal with the blank space for now.
I added the extra pfBlocker details to its own panel so it can be collapsed if it's not used.
-
@victorrobellini i'll pull down the latest update this eve and take a look. (thanks in advance) I have a few more cpu cycles available in my setup:
NUC10i7FNK -> proxmox -> debian vm -> docker -> influxdb
Latest update on the ntopng experiment. It is up and running. Had to customise the startup script such that I could create custom applications in the GUI. Bit of a pain that a key feature isn't supported OOTB.
I've noticed that Network Discovery gets itself confused and assigns device names incorrectly based on mdns. Haven't found a way to turn this off yet. For example, sometimes ntopng thinks my firewall network interface is called "google home mini", which is clearly incorrect. It might be related to running avahi / pimd to get chromecast running across vlans. More investigations to follow.
Haven't tried exporting ntopng to influxdb yet.
I'm in 2 minds to skip over ntopng and investigate elastiflow instead. -
@VictorRobellini I've pulled down the latest version of the conf, plugins and dashboard and I have noticed 1 thing that has stopped working.
This is the old gateway RTT dashboard. Also note the Gateway list:
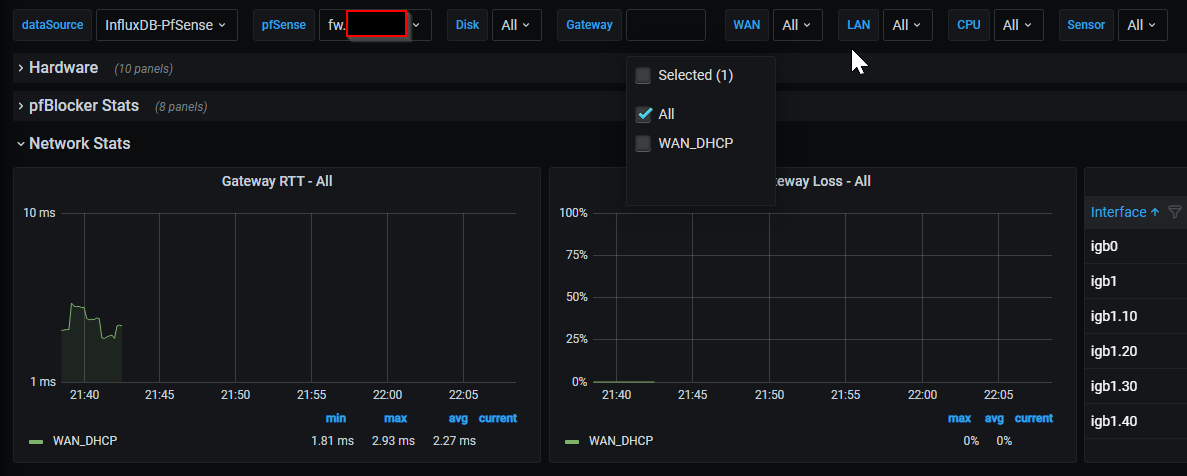
This is the new dashboard. The gateway names have changed and RTT chart is no longer working. Does it work for you?
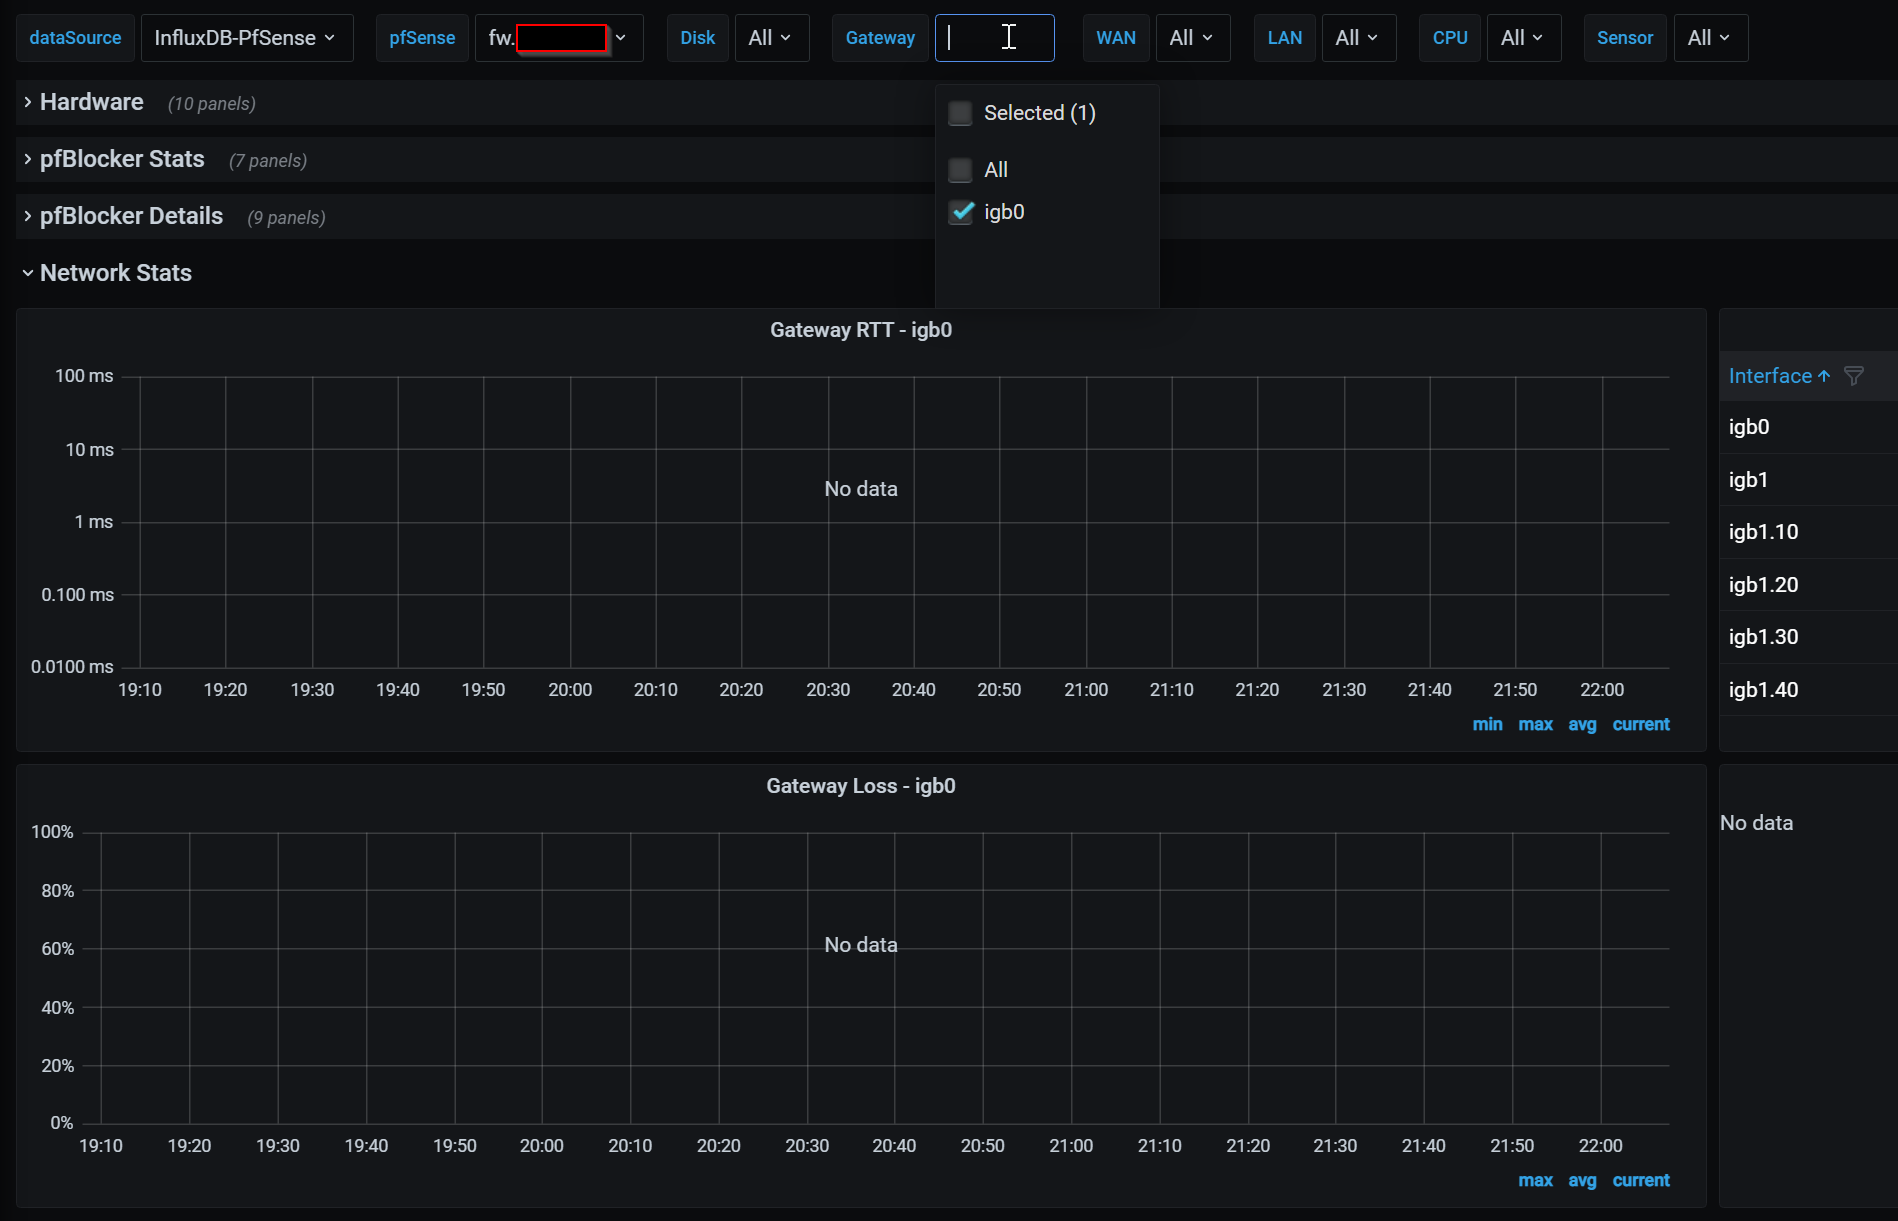
When running telegraf --test I think this is the relevant snippet after changing the dashboard and plugins to the new version:
> gateways,host=fw,interface=igb0 defaultgw=1,delay=2.117,gwdescr="Interface WAN_DHCP Gateway",loss=0,monitor="192.168.0.1",source="192.168.0.30",status="online",stddev=3.885,substatus="none" 1619643426000000000 > gateways,host=fw,interface=igb0 defaultgw=0,delay=0,gwdescr="Interface WAN_DHCP6 Gateway",loss=0,monitor="",source="",status="",stddev=0,substatus="" 1619643426000000000 > gateways,host=fw,interface=igb0 defaultgw=1,delay=2.117,gwdescr="Interface WAN_DHCP Gateway",loss=0,monitor="192.168.0.1",source="192.168.0.30",status="online",stddev=3.885,substatus="none" 1619643426000000000 > gateways,host=fw,interface=igb0 defaultgw=0,delay=0,gwdescr="Interface WAN_DHCP6 Gateway",loss=0,monitor="",source="",status="",stddev=0,substatus="N/A" 1619643426000000000 -
@wrightsonm
Did you drop your gateways measurement? I eliminated unused tags in the influx data. I added a blurb in the Readme about things not rendering properly. -
Great looking dashboard!
Wondering if there are step by step instructions on how to go about installing and configuring, as I'm finding the github instructions rather lacking.
-
Ok so steps i've performed so far. I think there are bugs in the latest git repository.
docker exec -it influxdb /bin/sh

influx delete --bucket pfsense --start '1970-01-01T00:00:00Z' --stop $(date +"%Y-%m-%dT%H:%M:%SZ")  --predicate '_measurement="tail_dnsbl_log"'

influx delete --bucket pfsense --start '1970-01-01T00:00:00Z' --stop $(date +"%Y-%m-%dT%H:%M:%SZ")  --predicate '_measurement="tail_ip_block_log"'

influx delete --bucket pfsense --start '1970-01-01T00:00:00Z' --stop $(date +"%Y-%m-%dT%H:%M:%SZ")  --predicate '_measurement="gateways"' --org-id [id]

influx delete --bucket pfsense --start '1970-01-01T00:00:00Z' --stop $(date +"%Y-%m-%dT%H:%M:%SZ")  --predicate '_measurement="interface"' --org-id [id]
If your WAN config looks like mine with ipv4 and ipv6 enabled, then you end up with a problem with the gateways telegraf lines as igb0 exists twice. Gateways used to use gateway_name probably for this reason. It means that the tag grouping won't work if you have ivp4 and ipv6 enabled.
So i've had to change telegraph_gateways.php to include gateway_name and then adjust the grafana dashboard to use gateway_name instead of interface. (basically reverting it back to how it worked on the previous revision.
Next issue is telegraf is nolonger exporting the interface measurement.
Looks like this changeset replaced "interface" with "gateways". Looks like a copy paste issue to me.
github diffAs a result of this problem, none of the interfaces show up correctly on the dashboards.
The interface summaries work with the old version of telegraf_pfinterface.phpFinal note, is this dashboard now requires a 1440p monitor to view everything without horizontal scrolling. Would be nice if it would display on 1080p monitors
-
@wrightsonm
This is the dashboard working once again for me: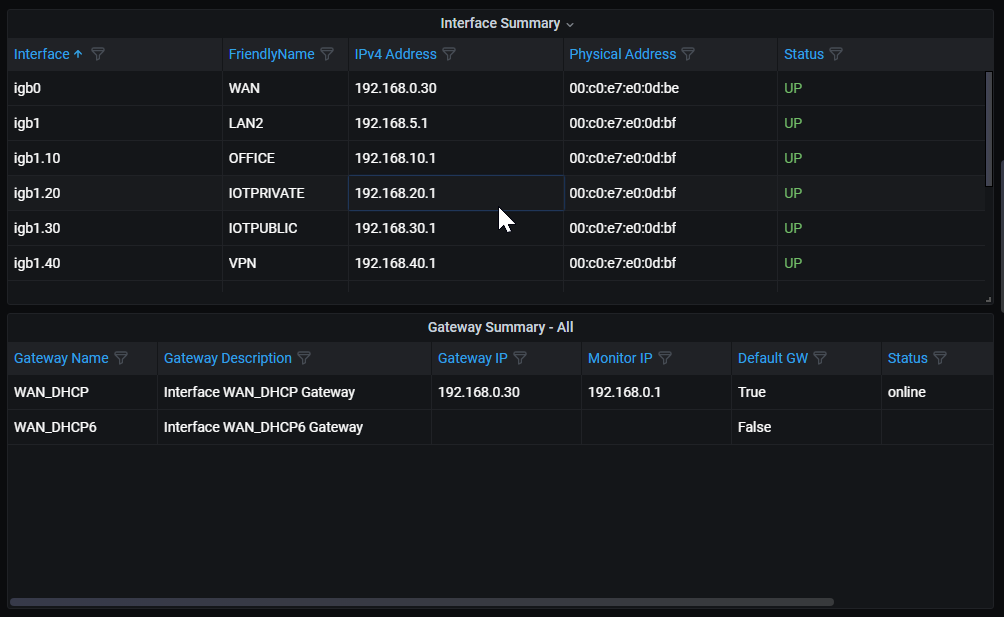
telegraf --test --config /usr/local/etc/telegraf.conf
Grafana Gateway Variable changed back to:
SHOW TAG VALUES FROM "gateways" WITH KEY = "gateway_name" WHERE "host" =~ /^$Host$/Modified plugins:
telegraf_gateways.php.txtReverted plugin:
telegraf_pfinterface.php.txtModified dashboard:
grafana.json.txt -
@wrightsonm said in Grafana Dashboard using Telegraf with additional plugins:
with ipv4 and ipv6 enabled, then you end up with a problem with the gateways telegraf lines as igb0 exists twice
Does this happen for the interface table? If you are willing to troubleshoot this with me, please open a github issue so we don't flood this thread with troubleshooting.
-
@jpetovello This is a pet project I built for use with my homelab and documented to help others. The main prereqs are that you have influx and grafana already set up. I didn't document that since everyone is going to have their systems set up differently. Luckily, there's no shortage of tutorials available online. My recommendation is to get your influxdb and grafana setup, read the github readme, read through this thread, and search the closed issues in the github project.