Grafana Dashboard using Telegraf with additional plugins
-
I made a few updates to the plugins, telegraf config, and the dashboard.
More gateway details
More pfBlocker details (in a separate panel so you can hide it if you don't care)Screenshot to be updated
-
@victorrobellini exciting. I look forward to the screenshot / git commit.

-
Screenshot updated. The only thing I need to figure out is what to put in the pfSense Details blank space. Adding graphs for the sake of filling space means unnecessary influx queries and CPU usage on the host. I'm running my influx on a J5005 with a bunch of other services. I'll deal with the blank space for now.
I added the extra pfBlocker details to its own panel so it can be collapsed if it's not used.
-
@victorrobellini i'll pull down the latest update this eve and take a look. (thanks in advance) I have a few more cpu cycles available in my setup:
NUC10i7FNK -> proxmox -> debian vm -> docker -> influxdb
Latest update on the ntopng experiment. It is up and running. Had to customise the startup script such that I could create custom applications in the GUI. Bit of a pain that a key feature isn't supported OOTB.
I've noticed that Network Discovery gets itself confused and assigns device names incorrectly based on mdns. Haven't found a way to turn this off yet. For example, sometimes ntopng thinks my firewall network interface is called "google home mini", which is clearly incorrect. It might be related to running avahi / pimd to get chromecast running across vlans. More investigations to follow.
Haven't tried exporting ntopng to influxdb yet.
I'm in 2 minds to skip over ntopng and investigate elastiflow instead. -
@VictorRobellini I've pulled down the latest version of the conf, plugins and dashboard and I have noticed 1 thing that has stopped working.
This is the old gateway RTT dashboard. Also note the Gateway list:
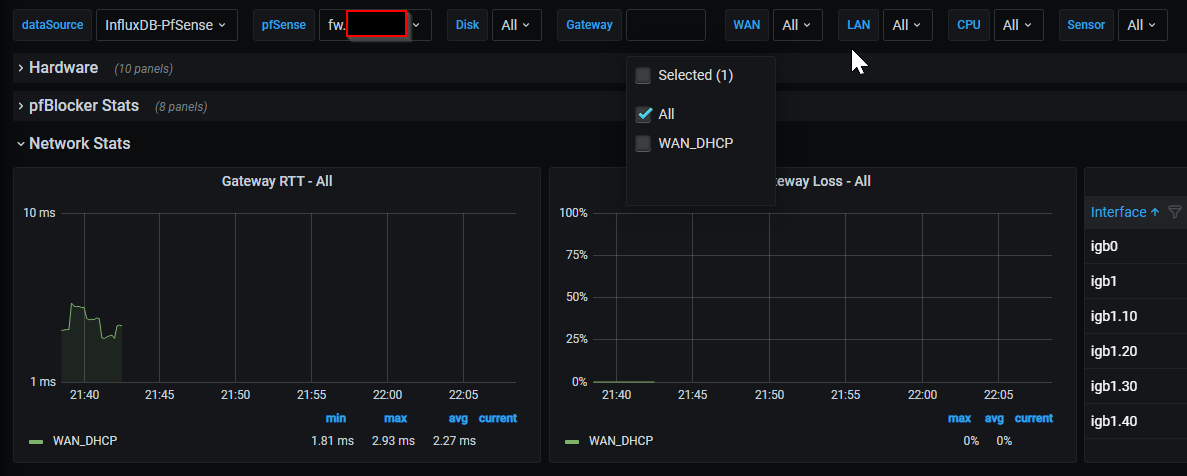
This is the new dashboard. The gateway names have changed and RTT chart is no longer working. Does it work for you?
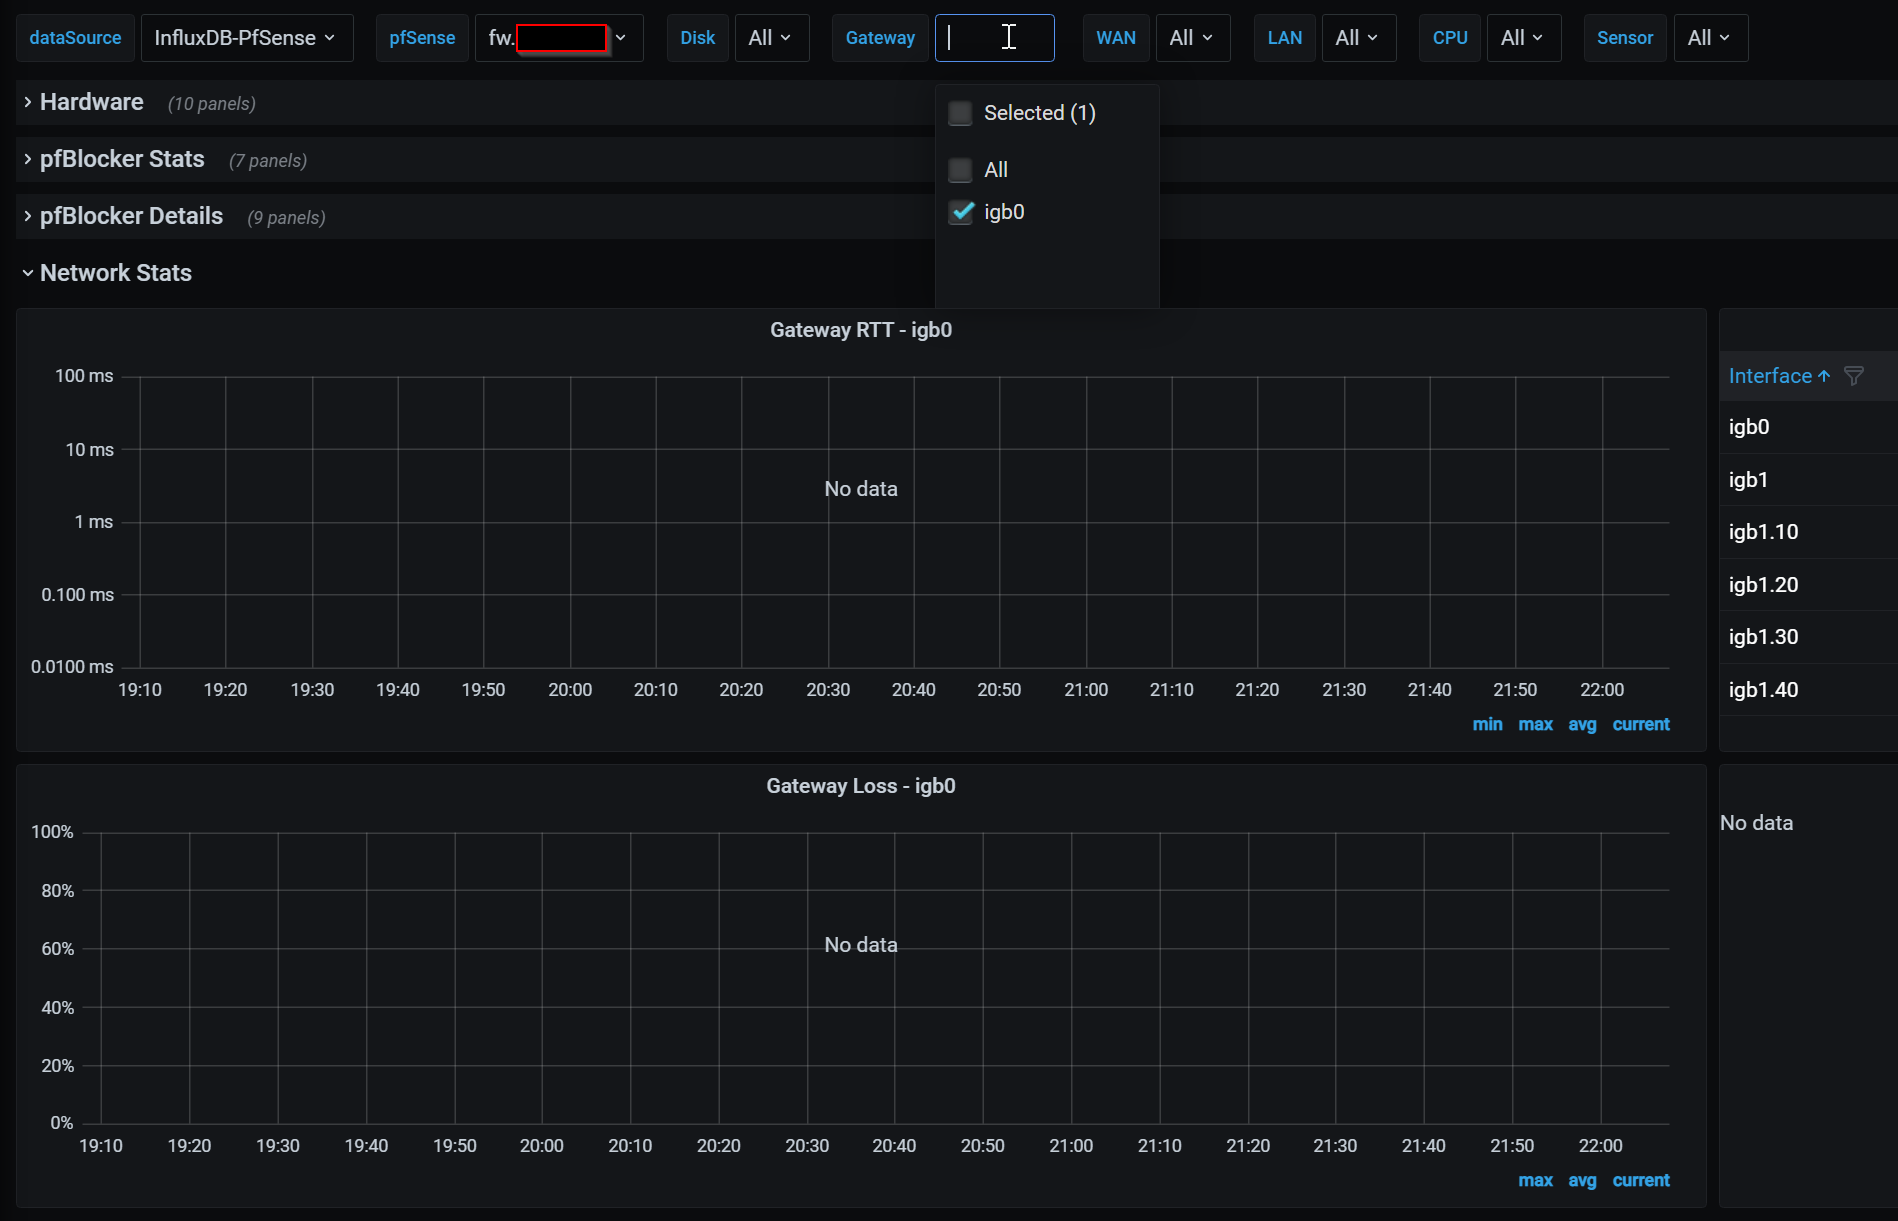
When running telegraf --test I think this is the relevant snippet after changing the dashboard and plugins to the new version:
> gateways,host=fw,interface=igb0 defaultgw=1,delay=2.117,gwdescr="Interface WAN_DHCP Gateway",loss=0,monitor="192.168.0.1",source="192.168.0.30",status="online",stddev=3.885,substatus="none" 1619643426000000000 > gateways,host=fw,interface=igb0 defaultgw=0,delay=0,gwdescr="Interface WAN_DHCP6 Gateway",loss=0,monitor="",source="",status="",stddev=0,substatus="" 1619643426000000000 > gateways,host=fw,interface=igb0 defaultgw=1,delay=2.117,gwdescr="Interface WAN_DHCP Gateway",loss=0,monitor="192.168.0.1",source="192.168.0.30",status="online",stddev=3.885,substatus="none" 1619643426000000000 > gateways,host=fw,interface=igb0 defaultgw=0,delay=0,gwdescr="Interface WAN_DHCP6 Gateway",loss=0,monitor="",source="",status="",stddev=0,substatus="N/A" 1619643426000000000 -
@wrightsonm
Did you drop your gateways measurement? I eliminated unused tags in the influx data. I added a blurb in the Readme about things not rendering properly. -
Great looking dashboard!
Wondering if there are step by step instructions on how to go about installing and configuring, as I'm finding the github instructions rather lacking.
-
Ok so steps i've performed so far. I think there are bugs in the latest git repository.
docker exec -it influxdb /bin/sh

influx delete --bucket pfsense --start '1970-01-01T00:00:00Z' --stop $(date +"%Y-%m-%dT%H:%M:%SZ")  --predicate '_measurement="tail_dnsbl_log"'

influx delete --bucket pfsense --start '1970-01-01T00:00:00Z' --stop $(date +"%Y-%m-%dT%H:%M:%SZ")  --predicate '_measurement="tail_ip_block_log"'

influx delete --bucket pfsense --start '1970-01-01T00:00:00Z' --stop $(date +"%Y-%m-%dT%H:%M:%SZ")  --predicate '_measurement="gateways"' --org-id [id]

influx delete --bucket pfsense --start '1970-01-01T00:00:00Z' --stop $(date +"%Y-%m-%dT%H:%M:%SZ")  --predicate '_measurement="interface"' --org-id [id]
If your WAN config looks like mine with ipv4 and ipv6 enabled, then you end up with a problem with the gateways telegraf lines as igb0 exists twice. Gateways used to use gateway_name probably for this reason. It means that the tag grouping won't work if you have ivp4 and ipv6 enabled.
So i've had to change telegraph_gateways.php to include gateway_name and then adjust the grafana dashboard to use gateway_name instead of interface. (basically reverting it back to how it worked on the previous revision.
Next issue is telegraf is nolonger exporting the interface measurement.
Looks like this changeset replaced "interface" with "gateways". Looks like a copy paste issue to me.
github diffAs a result of this problem, none of the interfaces show up correctly on the dashboards.
The interface summaries work with the old version of telegraf_pfinterface.phpFinal note, is this dashboard now requires a 1440p monitor to view everything without horizontal scrolling. Would be nice if it would display on 1080p monitors
-
@wrightsonm
This is the dashboard working once again for me: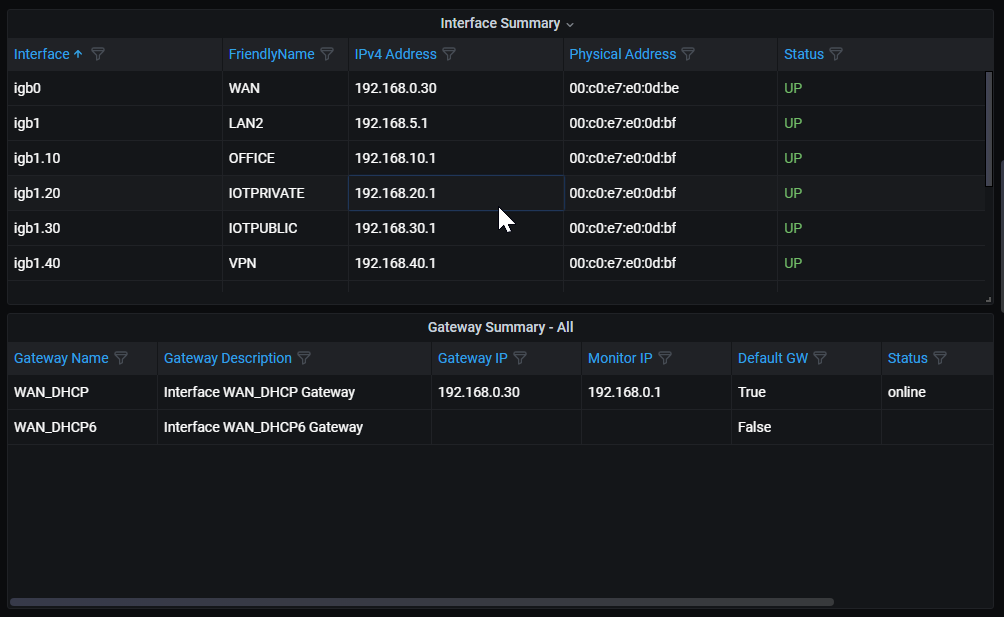
telegraf --test --config /usr/local/etc/telegraf.conf
Grafana Gateway Variable changed back to:
SHOW TAG VALUES FROM "gateways" WITH KEY = "gateway_name" WHERE "host" =~ /^$Host$/Modified plugins:
telegraf_gateways.php.txtReverted plugin:
telegraf_pfinterface.php.txtModified dashboard:
grafana.json.txt -
@wrightsonm said in Grafana Dashboard using Telegraf with additional plugins:
with ipv4 and ipv6 enabled, then you end up with a problem with the gateways telegraf lines as igb0 exists twice
Does this happen for the interface table? If you are willing to troubleshoot this with me, please open a github issue so we don't flood this thread with troubleshooting.
-
@jpetovello This is a pet project I built for use with my homelab and documented to help others. The main prereqs are that you have influx and grafana already set up. I didn't document that since everyone is going to have their systems set up differently. Luckily, there's no shortage of tutorials available online. My recommendation is to get your influxdb and grafana setup, read the github readme, read through this thread, and search the closed issues in the github project.
-
@victorrobellini yeah sure. I've not got any time until Tuesday now. The solution is in the attachments and pictures above. I can raise a Pull Request with the fixes on Tuesday if you like?
-
@wrightsonm I just reread what you wrote. I have no idea how that happened. Thanks for the heads up. I may just merge the 2 scripts since they are doing very similar stuff. I'll take a look this weekend.
Update: I merged the scripts and updated the repo. Everything should be working now.
-
@wrightsonm said in Grafana Dashboard using Telegraf with additional plugins:
Final note, is this dashboard now requires a 1440p monitor to view everything without horizontal scrolling.
Sorry, I run this on either a 4k or an ultrawide 1080p display. If you have it reformatted for 1080p just add the json with a new name and submit a PR.
-
I copied the new scripts for plugin and configured permissions on them (755), imported new dashboard but now I'm not getting any temperatures reading, IP or DNSBL lists, no network interface summary, no Gateway RTT or loss. Any hint what I missed in the upgrade process?
-
@von-papst Got temperatures working (CRLF from M$ messed up script). Still missing lists from pfblocker-ng and interface summary.
-
@von-papst check the CRLF on all the plugins. Then use the telegraf test command to check that there are no errors. Failing that add the debug logging option to telegraf and check the log file. Instructions for the above are on the GitHub readme.
-
@wrightsonm Got pfblocker working, changed queries and added some info. But Gateway RTT and loss still not working.
-
@wrightsonm Got everything working now. I needed to modify some queries in the dashboard and added gateways.py script.
-
I'm a bit confused, where do the plugins need to be placed? Am I supposed to upload them to my pfSense install?