Playing with fq_codel in 2.4
-
note: I have $dayjob and sailing tomorrow. don't expect replies.I sure hope the icmp issue is nailed....
Happy debloating!
-
Here is the Atom C2758 doing 500mbit.
Here are the customized sysctl values:
net.inet.tcp.tso="0"
net.inet.tcp.lro="0"
dev.igb.0.fc="0"
dev.igb.1.fc="0"
dev.igb.2.fc="0"
dev.igb.3.fc="0"
dev.igb.0.eee_disabled="1"
dev.igb.1.eee_disabled="1"
dev.igb.2.eee_disabled="1"
dev.igb.3.eee_disabled="1"
hw.igb.rxd="4096"
hw.igb.txd="4096"
hw.igb.rx_process_limit="-1"
hw.igb.tx_process_limit="-1"
hw.igb.num_queues="8"
hw.igb.max_interrupt_rate="128000"
net.inet.tcp.hostcache.cachelimit="0"
net.inet.tcp.syncache.bucketlimit="100"
net.inet.tcp.syncache.hashsize="1024"
Here is 500mbit without ECN.
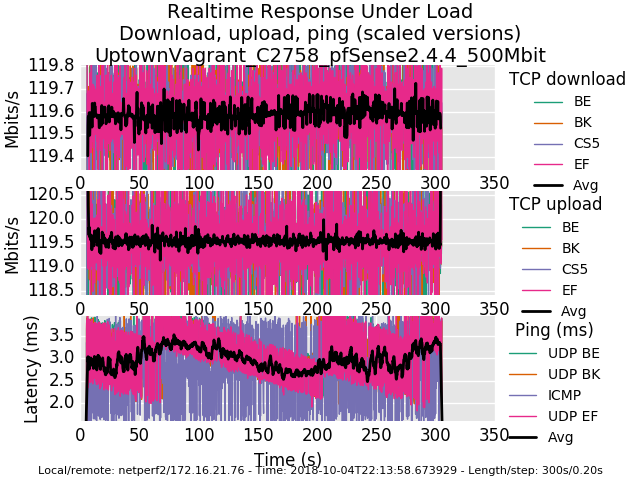
0_1538717701396_rrul-2018-10-04T221358.673929.UptownVagrant_C2758_pfSense2_4_4_500Mbit.flent.gzHere is 500mbit with end-to-end ECN enabled.
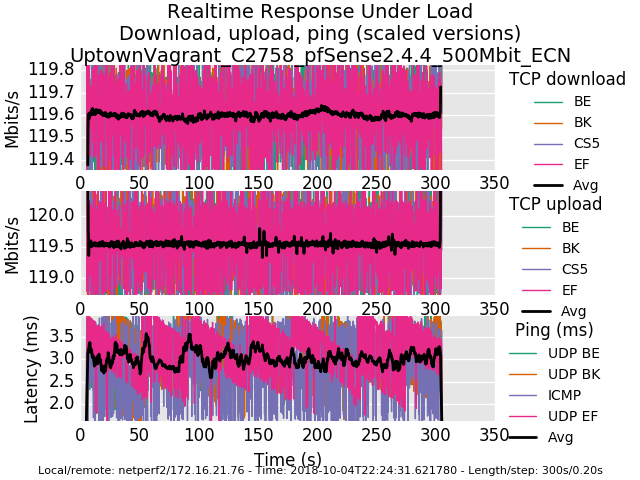
0_1538717713043_rrul-2018-10-04T222431.621780.UptownVagrant_C2758_pfSense2_4_4_500Mbit_ECN.flent.gzI have confirmed that disabling NAT removes the dropped icmp behaviour, traceroute loops, when limiters are used on an interface with NAT.
-
I switched to a server closer and upped the computing power :D
This is shaped to 800Mbps
1_1538719369675_rrul-2018-10-05T075404.739377.zwck-shaper_on_800Mbit.flent.gz
-
@uptownvagrant awesome. Is there a path for y'all to report this problem back to netgate and the freebsd devs? I'm totally over my head there. With nat you are using more cpu of course and there may be more variables worth tuning for more resources, the gc interval, and so on.
Your .5ms of smoothish jitter is a little puzzling but I can live with it. freebsd does not have sub 1ms timestamp resolution so perhaps that's it. What's 500usec between friends? :)
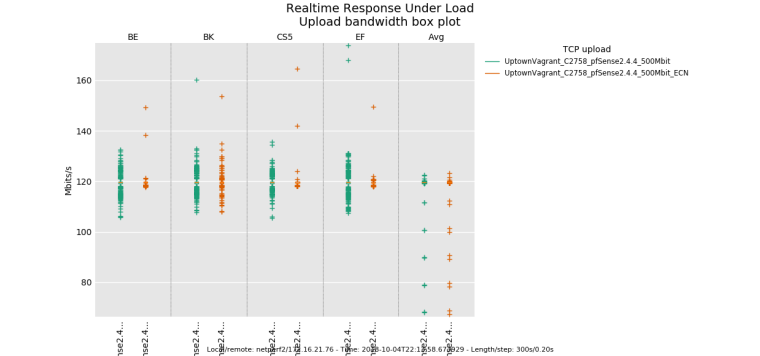
another nice flent thing is the ability to do comparison plots. The ecn result has smoother throughput.
-
@zwck you sure you shaped the dl to 800mbits? 'cause that's 28mbit. could also be your server or client has a fifo on it too, fq_codel or sch_fq on linux help with bidir tests a lot, also. or it could be flent-london... (flent's tcp_download test? the rrul test is extreme you can drill down with simpler tests)
(I thought you might be near england! It's really weird that I have such a grasp of worldwide rtts)
-
Hi and goodmoring. (for me at least)
Also i included @uptownVagrant 's tuning as we have more or less the same pfsense setup :D
Sorry that such a newbie, such as i, is posting here too, sadly the topic is far from my expertise.ipfw sched show 10000: 500.000 Mbit/s 0 ms burst 0 q75536 50 sl. 0 flows (1 buckets) sched 10000 weight 0 lmax 0 pri 0 droptail sched 10000 type FQ_CODEL flags 0x0 512 buckets 1 active FQ_CODEL target 5ms interval 60ms quantum 1514 limit 10240 flows 1024 ECN Children flowsets: 10000 BKT Prot ___Source IP/port____ ____Dest. IP/port____ Tot_pkt/bytes Pkt/Byte Drp 0 ip 0.0.0.0/0 0.0.0.0/0 3 144 0 0 0 10001: 500.000 Mbit/s 0 ms burst 0 q75537 50 sl. 0 flows (1 buckets) sched 10001 weight 0 lmax 0 pri 0 droptail sched 10001 type FQ_CODEL flags 0x0 512 buckets 1 active FQ_CODEL target 5ms interval 60ms quantum 1514 limit 10240 flows 1024 ECN Children flowsets: 10001 0 ip 0.0.0.0/0 0.0.0.0/0 6 540 0 0 0and rrd
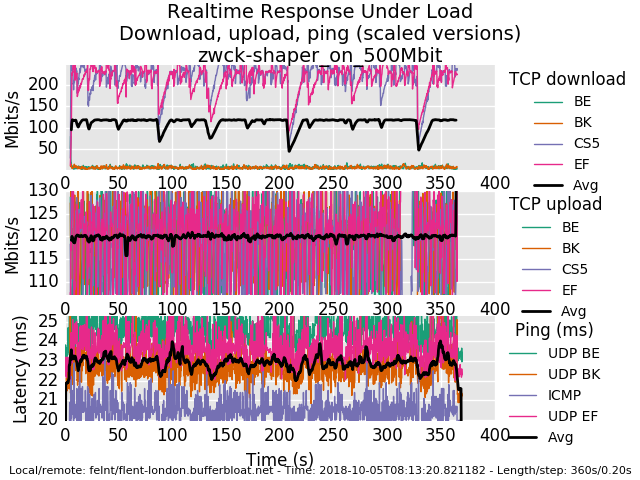
0_1538720733109_rrul-2018-10-05T081320.821182.zwck-shaper_on_500Mbit.flent.gz
-
It;s awesome to have more folk doing bidir network stress testing with flent. nobody in product marketing wants you to do that.
@zwck ok, I rebooted the box in london (it had a tcp tweak i didn't like), It should be back up in a minute. It looks to me though you just peak out at 1gbit total, though, on this hw...)
-
@zwck said in Playing with fq_codel in 2.4:
burst 0
Is there a way to tune the "burst" value in the limiter above? It's nice to see the dscp values actually being respected e2e here also. that never happens.
-
btw, the rrul test does not account for tcp ack traffic. When i see ~480Mbit of perfect fq_codeled bandwidth at 500mbit, it's a good assumption the remaining ~20mbit was acks as there's about a 20x1 ratio there
-
-

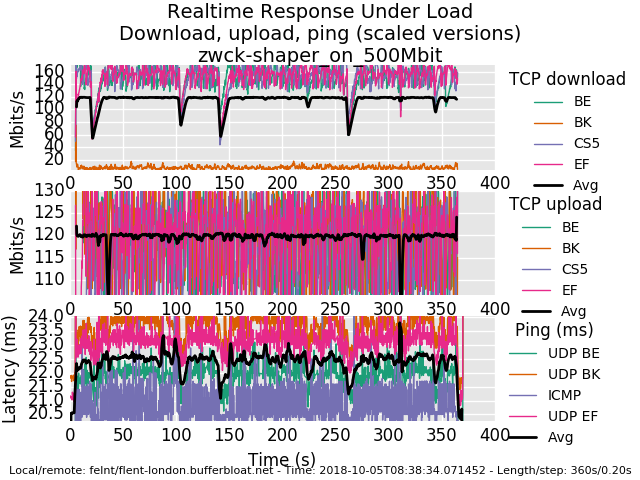
aftre london rebooted :D
1_1538721917996_rrul-2018-10-05T083834.071452.zwck-shaper_on_500Mbit.flent.gz
admin@pfsense:~ # ipfw sched show 10000: 500.000 Mbit/s 0 ms burst 0 q75536 50 sl. 0 flows (1 buckets) sched 10000 weight 0 lmax 0 pri 0 droptail sched 10000 type FQ_CODEL flags 0x0 512 buckets 1 active FQ_CODEL target 5ms interval 60ms quantum 1514 limit 10240 flows 1024 ECN Children flowsets: 10000 BKT Prot ___Source IP/port____ ____Dest. IP/port____ Tot_pkt/bytes Pkt/Byte Drp 0 ip 0.0.0.0/0 0.0.0.0/0 2357 2546546 0 0 0 10001: 500.000 Mbit/s 0 ms burst 0 q75537 50 sl. 0 flows (1 buckets) sched 10001 weight 0 lmax 0 pri 0 droptail sched 10001 type FQ_CODEL flags 0x0 512 buckets 1 active FQ_CODEL target 5ms interval 60ms quantum 1514 limit 10240 flows 1024 ECN Children flowsets: 10001 0 ip 0.0.0.0/0 0.0.0.0/0 306719 434714257 106 154656 7 admin@pfsense:~ # ipfw sched show 10000: 500.000 Mbit/s 0 ms burst 0 q75536 50 sl. 0 flows (1 buckets) sched 10000 weight 0 lmax 0 pri 0 droptail sched 10000 type FQ_CODEL flags 0x0 512 buckets 1 active FQ_CODEL target 5ms interval 60ms quantum 1514 limit 10240 flows 1024 ECN Children flowsets: 10000 BKT Prot ___Source IP/port____ ____Dest. IP/port____ Tot_pkt/bytes Pkt/Byte Drp 0 ip 0.0.0.0/0 0.0.0.0/0 4507 5174782 8 6208 0 10001: 500.000 Mbit/s 0 ms burst 0 q75537 50 sl. 0 flows (1 buckets) sched 10001 weight 0 lmax 0 pri 0 droptail sched 10001 type FQ_CODEL flags 0x0 512 buckets 1 active FQ_CODEL target 5ms interval 60ms quantum 1514 limit 10240 flows 1024 ECN Children flowsets: 10001 0 ip 0.0.0.0/0 0.0.0.0/0 362125 513262875 133 199500 7 admin@pfsense:~ # ipfw sched show 10000: 500.000 Mbit/s 0 ms burst 0 q75536 50 sl. 0 flows (1 buckets) sched 10000 weight 0 lmax 0 pri 0 droptail sched 10000 type FQ_CODEL flags 0x0 512 buckets 1 active FQ_CODEL target 5ms interval 60ms quantum 1514 limit 10240 flows 1024 ECN Children flowsets: 10000 BKT Prot ___Source IP/port____ ____Dest. IP/port____ Tot_pkt/bytes Pkt/Byte Drp 0 ip 0.0.0.0/0 0.0.0.0/0 46 61760 0 0 0 10001: 500.000 Mbit/s 0 ms burst 0 q75537 50 sl. 0 flows (1 buckets) sched 10001 weight 0 lmax 0 pri 0 droptail sched 10001 type FQ_CODEL flags 0x0 512 buckets 1 active FQ_CODEL target 5ms interval 60ms quantum 1514 limit 10240 flows 1024 ECN Children flowsets: 10001 0 ip 0.0.0.0/0 0.0.0.0/0 5427 7667181 0 0 0 admin@pfsense:~ # ipfw sched show 10000: 500.000 Mbit/s 0 ms burst 0 q75536 50 sl. 0 flows (1 buckets) sched 10000 weight 0 lmax 0 pri 0 droptail sched 10000 type FQ_CODEL flags 0x0 512 buckets 1 active FQ_CODEL target 5ms interval 60ms quantum 1514 limit 10240 flows 1024 ECN Children flowsets: 10000 BKT Prot ___Source IP/port____ ____Dest. IP/port____ Tot_pkt/bytes Pkt/Byte Drp 0 ip 0.0.0.0/0 0.0.0.0/0 3294 3669449 14 10864 0 10001: 500.000 Mbit/s 0 ms burst 0 q75537 50 sl. 0 flows (1 buckets) sched 10001 weight 0 lmax 0 pri 0 droptail sched 10001 type FQ_CODEL flags 0x0 512 buckets 1 active FQ_CODEL target 5ms interval 60ms quantum 1514 limit 10240 flows 1024 ECN Children flowsets: 10001 0 ip 0.0.0.0/0 0.0.0.0/0 90572 128064966 100 147104 1 -
well, the 500mbit results are awesome. there's 4 bursty drop episodes on the download that could be coming from anywhere for any cause - my box, yours, linode's shapers, the path, cosmic radiation.
try a rrul_be test to see if you get that big bursy drop. It's midnight here. I'm fading
-
@dtaht Thanks for the awesome help. It's in am's over here and i need to get to work. I have to read your flent documentation properly, enjoy your sailing trip.
-
I don't have much insight into that drop but the recovery pattern looks normal
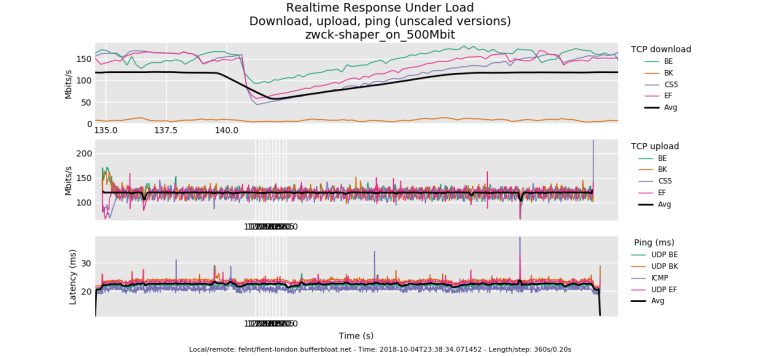
I dont have bbr on that box so can't try that, and is not the miracle of the juniper bushes enough? 800mbit still weird, though?
this also show's diffserv cs1 being respected.
.... you normally shouldn't see all 3 flows dropping a packet at the same time, just one (and you'd see, as in earlier in the test the flows trading bandwidth back and forth in the tcp sawtooth pattern). with 3 simultaneous drops they all cut their bandwidth in half and utilization is lowered while they recover.
-
This post is deleted! -
have a song: https://plus.google.com/u/0/107942175615993706558/posts/UtcLY2W9NXy
-
@dtaht have fun
10000: 800.000 Mbit/s    0 ms burst 0
q75536  50 sl. 0 flows (1 buckets) sched 10000 weight 0 lmax 0 pri 0 droptail
 sched 10000 type FQ_CODEL flags 0x0 512 buckets 1 active
 FQ_CODEL target 5ms interval 60ms quantum 1514 limit 10240 flows 1024 ECN
   Children flowsets: 10000
BKT Prot ___Source IP/port____ ____Dest. IP/port____ Tot_pkt/bytes Pkt/Byte Drp
  0 ip           0.0.0.0/0             0.0.0.0/0     3780  4324863  0    0   0
10001: 800.000 Mbit/s    0 ms burst 0
q75537  50 sl. 0 flows (1 buckets) sched 10001 weight 0 lmax 0 pri 0 droptail
 sched 10001 type FQ_CODEL flags 0x0 512 buckets 1 active
 FQ_CODEL target 5ms interval 60ms quantum 1514 limit 10240 flows 1024 ECN
   Children flowsets: 10001
  0 ip           0.0.0.0/0             0.0.0.0/0     107473 153093543 201 297156   1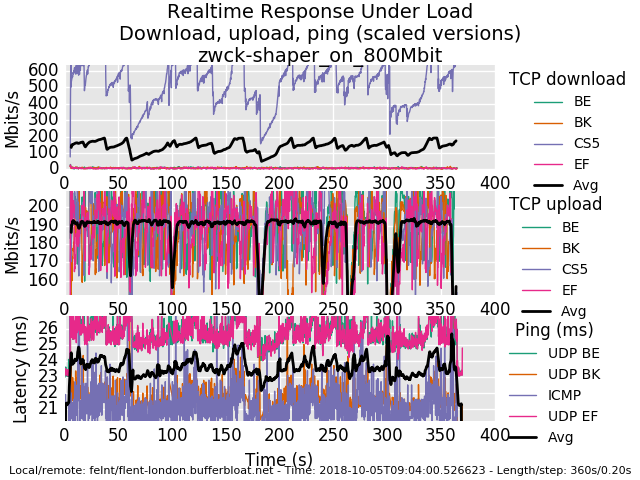
0_1538723446599_rrul-2018-10-05T090400.526623.zwck-shaper_on_800Mbit.flent.gz
-
I do gotta say I think these major drops are significant... but I'm tired! need to fire up a different netperf server in a different cloud to see if it's on my end. Got a fav cloud provider? this is linode....
or @uptownvagrant can weigh in
-
It's probably on my end, I have beefier hardware that I can try plus I can maybe set it up similar to what vagrant is doing.
-
do you have any major daemons running out of cron or elsewhere? this is happening ever ~40 sec it looks like... or a gc interval in the kernel?
bed, calling