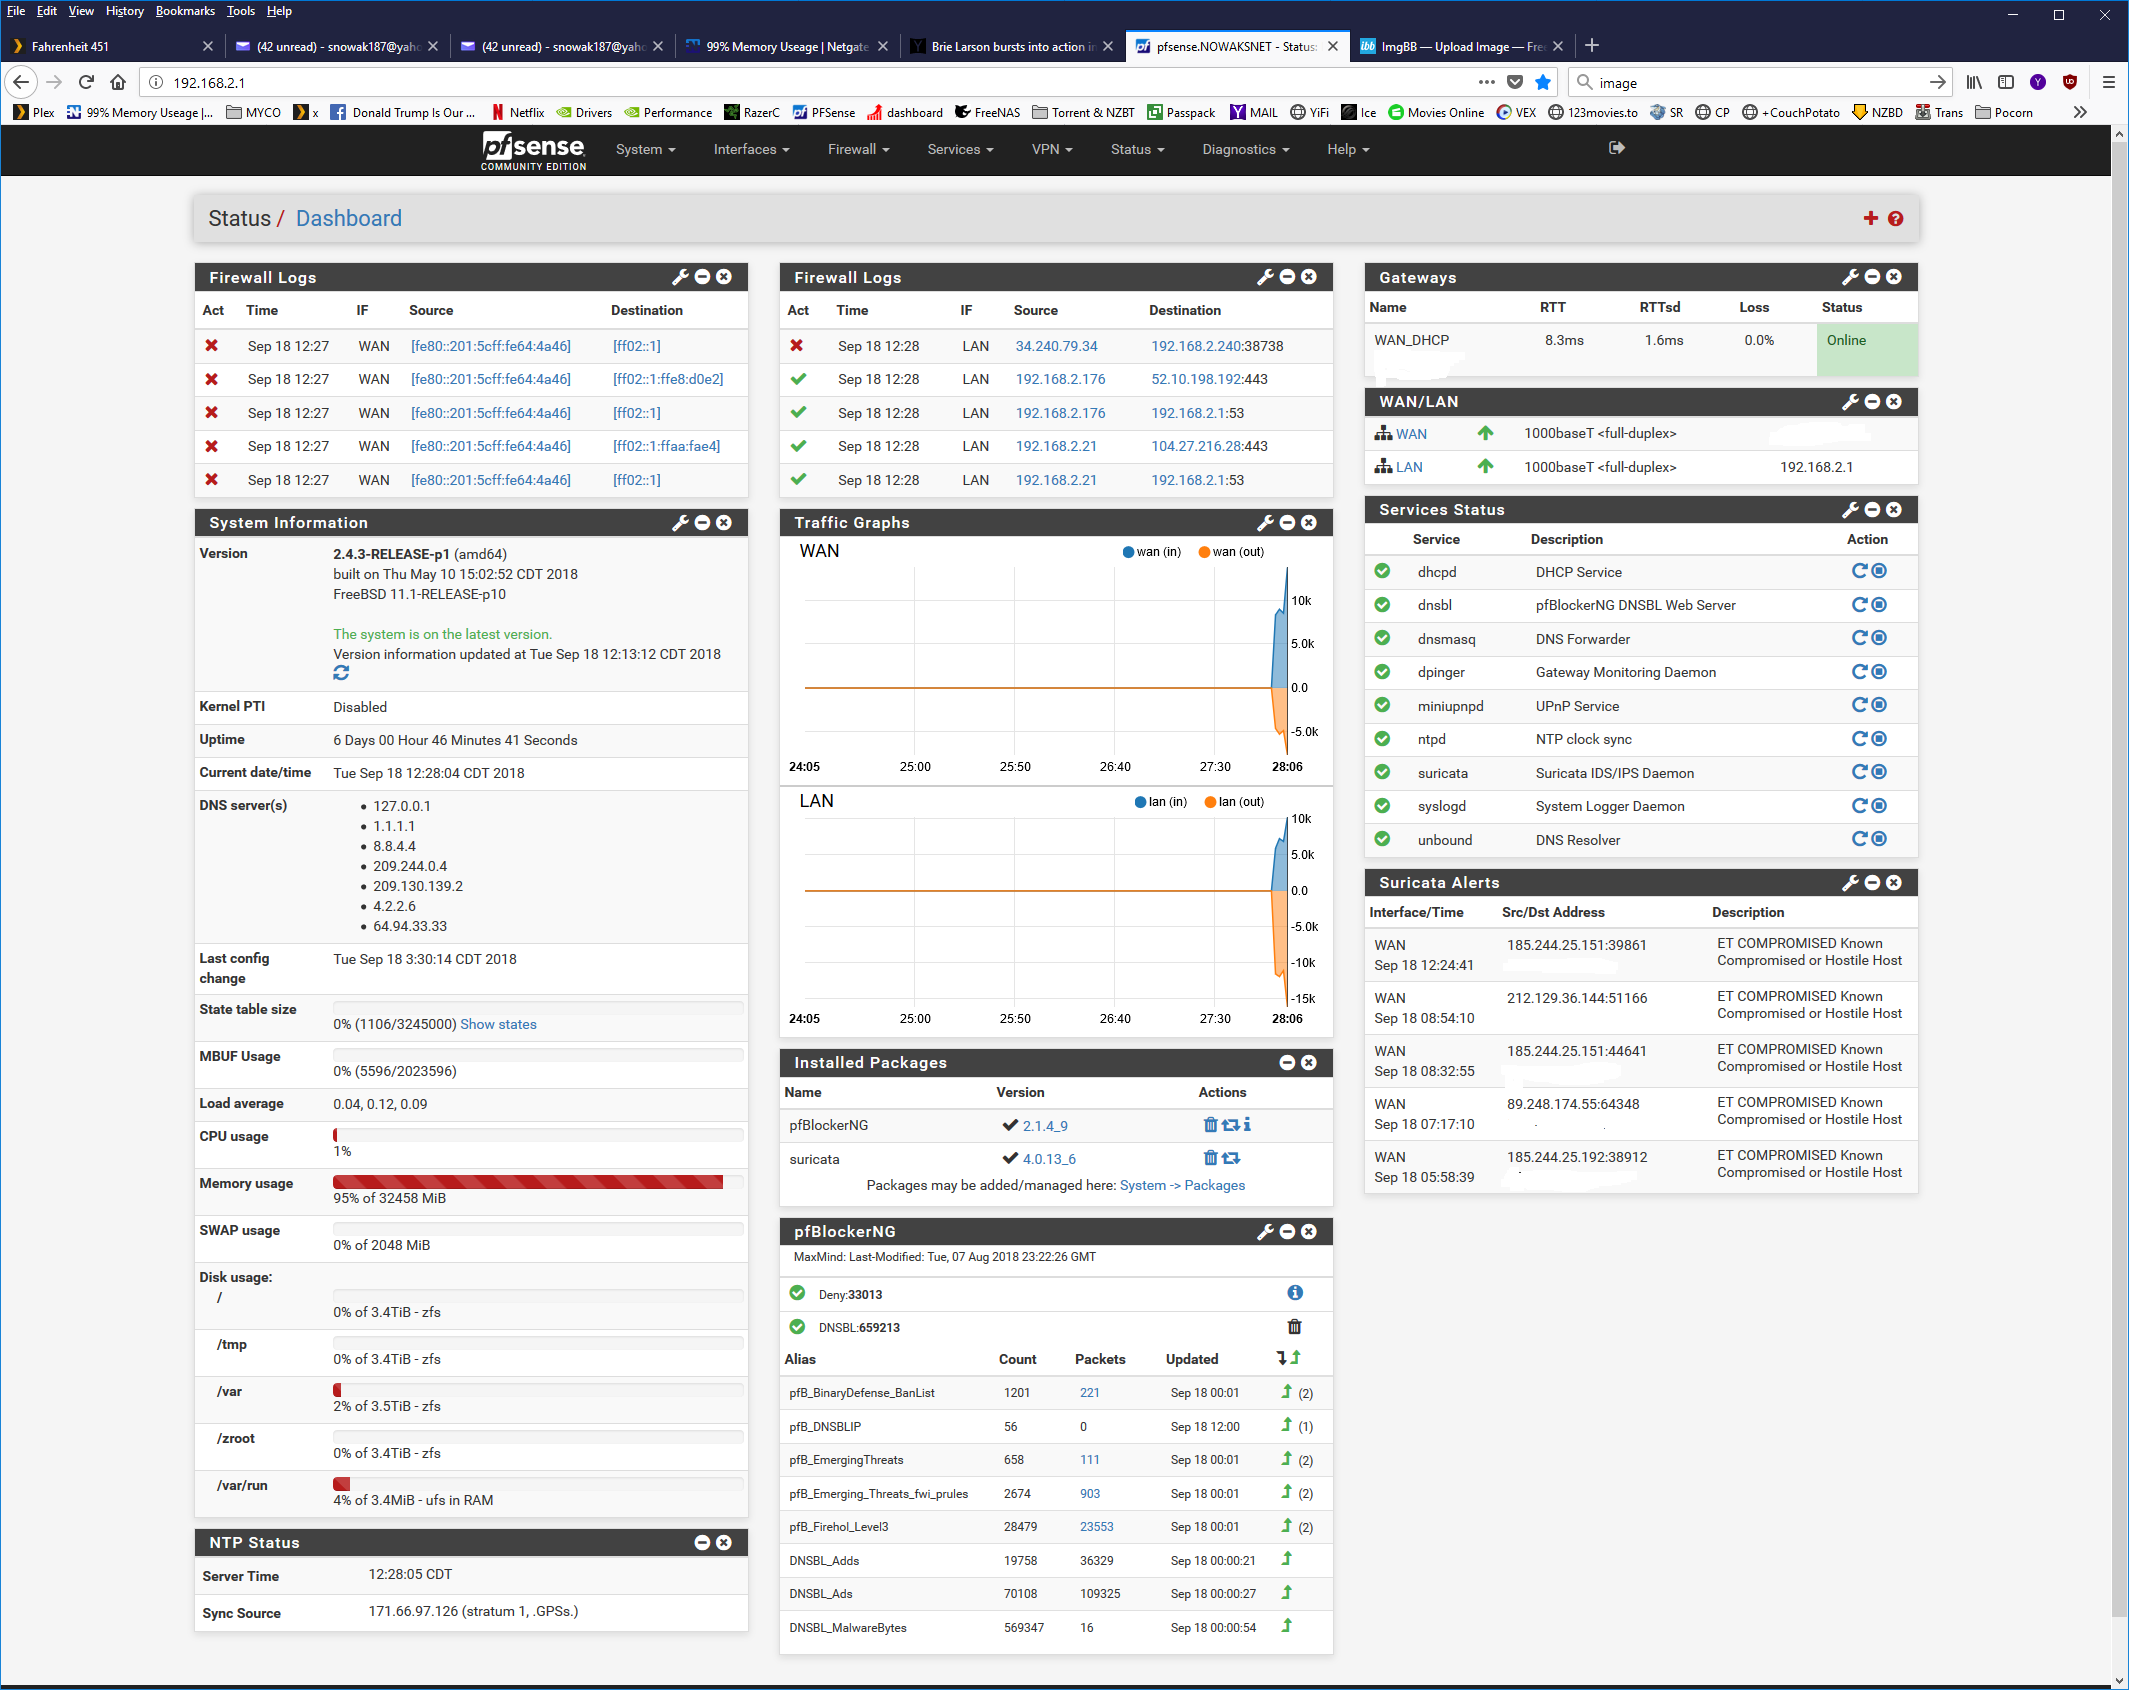
99% Memory Useage
-
I've had this happen to me too. It was something between pfblocker and unbound. Try updating pfblocker to lates "development" version. I can vouch it works great. That interacts much better with unbound.
-
Well do thanks will update if it fix's it just did this Going to have to do a Power Button reset as it produced this error. Fatal error: Call to undefined function pfb_alerts_default_page() in /usr/local/www/pfblockerng/pfblockerng_general.php on line 96 PHP ERROR: Type: 1, File: /usr/local/www/pfblockerng/pfblockerng_general.php, Line: 96, Message: Call to undefined function pfb_alerts_default_page() And the Remote Client Is frozen.
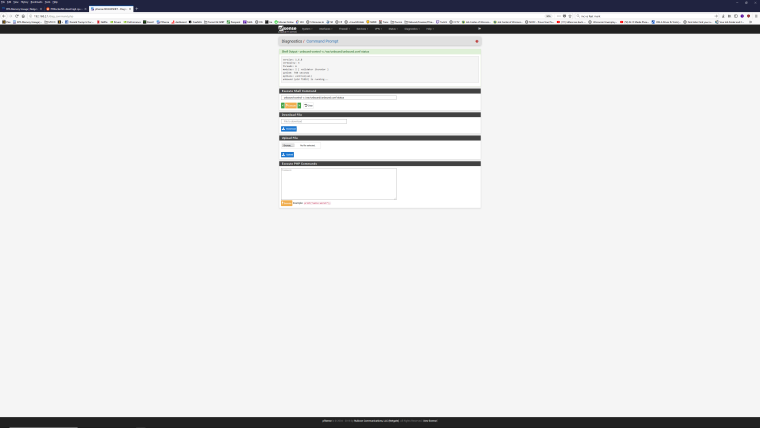
Crash report:
Crash report begins. Anonymous machine information:
amd64
11.1-RELEASE-p10
FreeBSD 11.1-RELEASE-p10 #13 r313908+293707af843(RELENG_2_4): Thu May 10 15:09:24 CDT 2018 root@buildbot2.netgate.com:/builder/ce-243/tmp/obj/builder/ce-243/tmp/FreeBSD-src/sys/pfSense
Crash report details:
PHP Errors:
[18-Sep-2018 13:41:28 America/Chicago] PHP Fatal error: Call to undefined function pfb_alerts_default_page() in /usr/local/www/pfblockerng/pfblockerng_general.php on line 96
No FreeBSD crash data found.Error after reboot but memory is at 10%.
0_1537296839475_PHP_errors.log.gz
other then the error it seems like this is the fix.
-
Well update after about 1h and siting around 38% memory used but will see to night when my power user's log on and start to hit the network hard.
Still Having the crashing problem but it is not freezing the Remote UI like it was doing at the start of the PfblockerNG update.
Also I had a question is it useful to run var as a ram disk? Or do you only see this being usefully in heavy network utilization environments? -
@snowaks You first post looks much better, thanks, I'm sorry I hope I didn't come across as rude.
The only reason to run var as a RAM disk is if you're worried about disk writes on a SDCard or similar. If you're running this on a decent SSD/hard disk then I wouldn't bother doing it, keep the RAM for something useful.
-
ok update seem's to have level off at 80% witch is ok Will update after 2 day's.
Still getting a Crash report but none of my system & network seem to not be affected.
Remote UI still works, All packages are up and ruining I may have to do some tuning to
get squid up and ruining. So I can see what amount of ram I will have left over to be used with squid.
-
I think it's still broken. Under no condition should unbound use this much memory. Try running it with pfblocker disabled. If memory stays low, post an issues in the pfblocker section.
-
@snowaks said in 99% Memory Useage:
So where to start well I have been running Pfsense for about 8 years now. the Problem I Am running in to is after a reset I get to about 99% memory Usage
and the network become's unstable a restart or setting Ram dsik fix's this. I can set up a Ram Disk but it gets used up. If i set up a ram disk does not use all my memory. This was a fresh install then backup applied . What happend was I did a hardware swap and then had a bad disk.
The hardware I came from was a Dell 2900v3 2x Xeon 4 cores Also due to to much power usage.
That's when this Problem start the old system did have 58Gb ECC of Ram.Check out the following reddit thread and see if that helps:
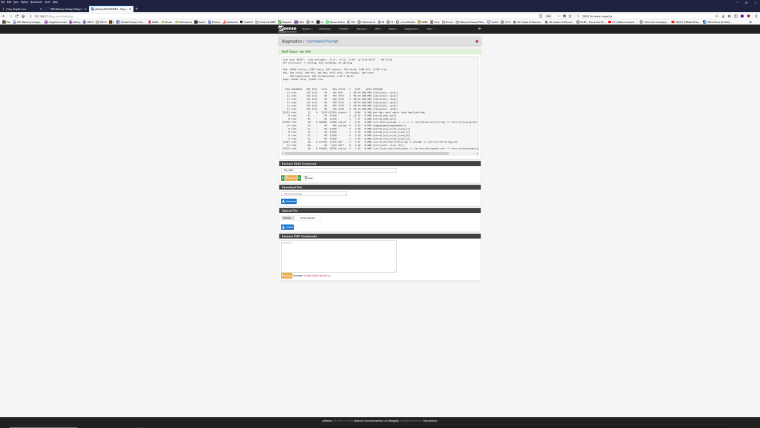
https://www.reddit.com/r/PFSENSE/comments/9g9csi/pfblockerngdevel_high_cpu_usage/Also try running the following top command:
top -aSH -
Should I Do a restart after disable of Pf blocker ? Will take a look at the reddit post thanks guys!
Do you think the Cpu problem is just like the Ram one ? Hey I will try any thing with in reason.
My best fix yet is to set var/ to as a ram disk and it does not allow it to go over the set parameter.
Will Disable and update my post It takes around 2-3 day's to for the memory to hit 99%.
I change Cron to 4h set logging on unbound to level 3 as it was on level 2.
unbound-control -c /var/unbound/unbound.conf status (Edit2)
-
PFblockerNG Off for 1 day still showing 90% Plus
-
-
Are Your sure it's not Surricata eating all the RAM?
P.S. - You could install htop with "pkg install htop". Might need a reboot to work(for me at least). There you can check in real time what's going on.
-
@xciter327 said in 99% Memory Useage:
Are Your sure it's not Surricata eating all the RAM?
Yes its definately Suricata .. you can see several PIDs for the same interface...
If you are using the package "Service Watchguard", do not add Snort/Suricata as it will try to restart the package when cron is updating the rules leading to phantom processes.
-
I have used it in the past have not reinstalled it. Do to the memory problem and read some where about cron and problems with it
I can disable Suricata and will still get 99% I mean I may Be mistaken and end up with my foot in my mouth.
I will also do a reboot to clear the used Ram as this is the only way I have found to get it to back to normal.
If so I think it would be a good idea to add in a memory setting in general to only control the packages amount of Max used Ram?
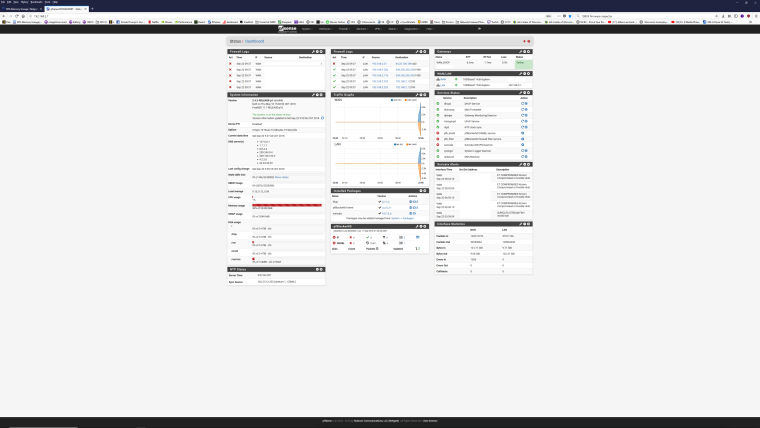
I will Disable Suricata and add screen shots.PS Is there a way to set per a package max used Ram in tunables?
-
-
With Suricata disabled, do a reboot to make sure it's all clean.
P.S. - this is not related, but why run both unbound and dns forwarder?
-
I was Under the understanding that Unbound was for internal traffic Lan and forward was for Wan side incoming.
I had some problems get stuff to see some stuff from the outside the network
Did not matter what firewall rule/port forwarding I added. I read some where that you should enable
forwarder I did and the traffic worked. So I prayed to the Pfsense gods and walked a way with it up and happy.
Plex was the problem Program. -
@snowaks said in 99% Memory Useage:
I was Under the understanding that Unbound was for internal traffic Lan and forward was for Wan side incoming.
I had some problems get stuff to see some stuff from the outside the network
Did not matter what firewall rule/port forwarding I added. I read some where that you should enable
forwarder I did and the traffic worked. So I prayed to the Pfsense gods and walked a way with it up and happy.
Plex was the problem Program.Hi,
Have you tried a clean install, without using your backup config?
Then just change your settings manually and add one package at the time. -
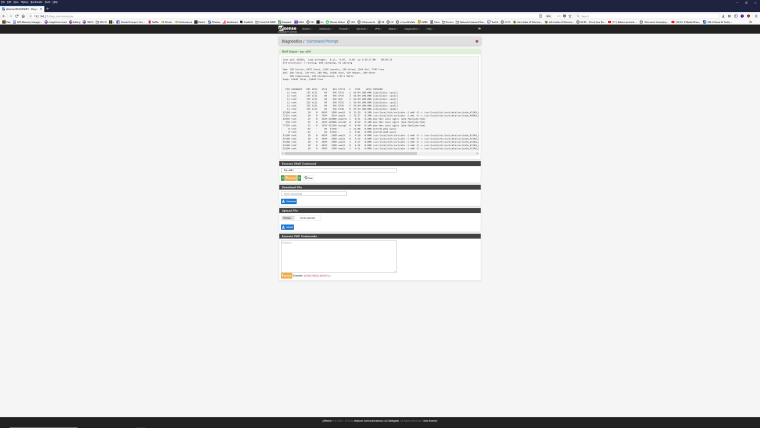
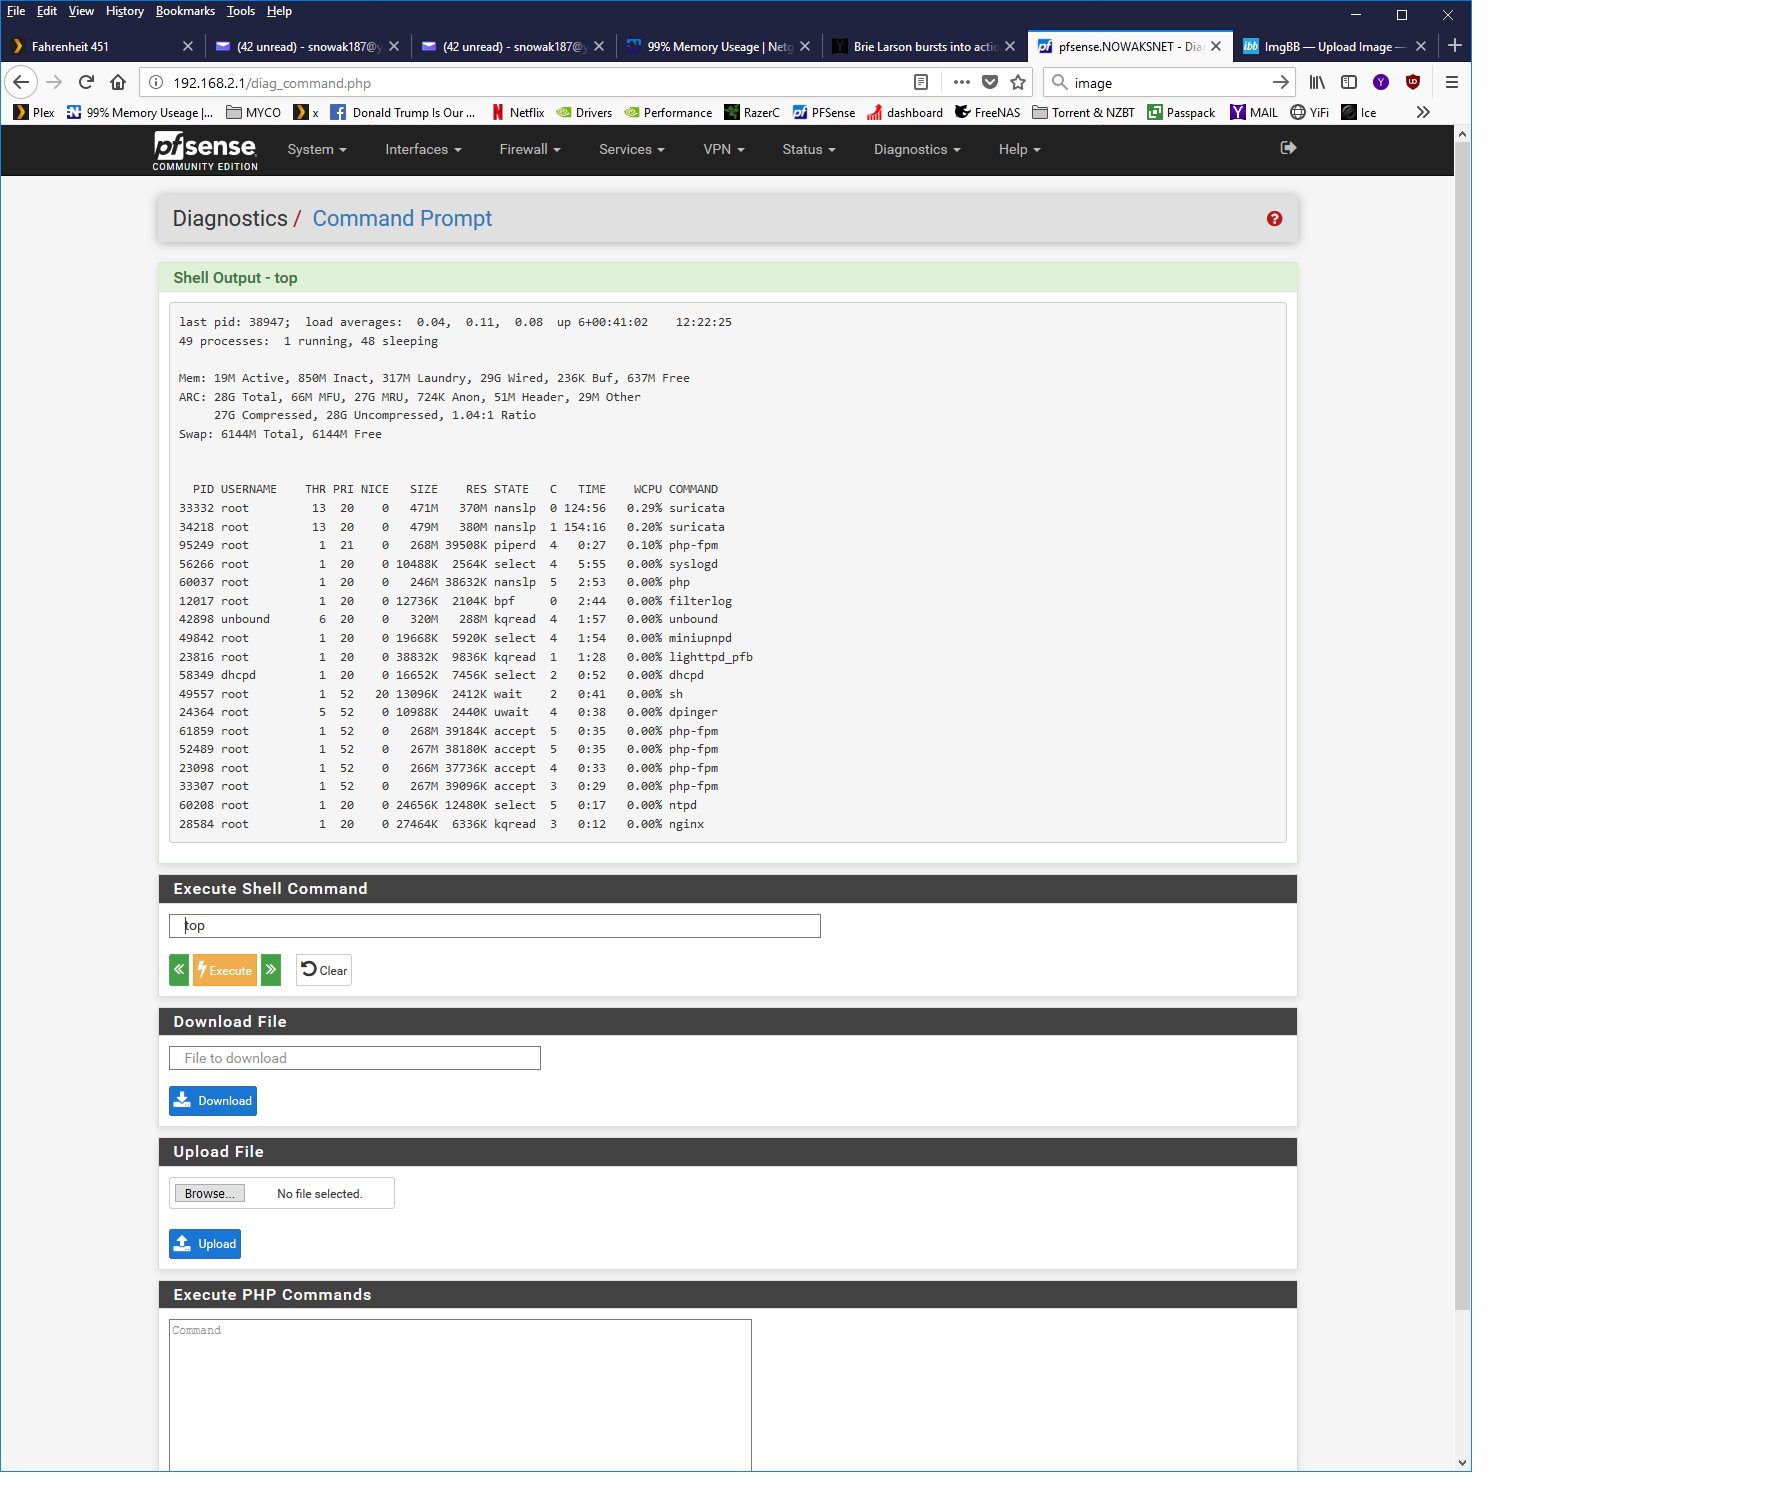
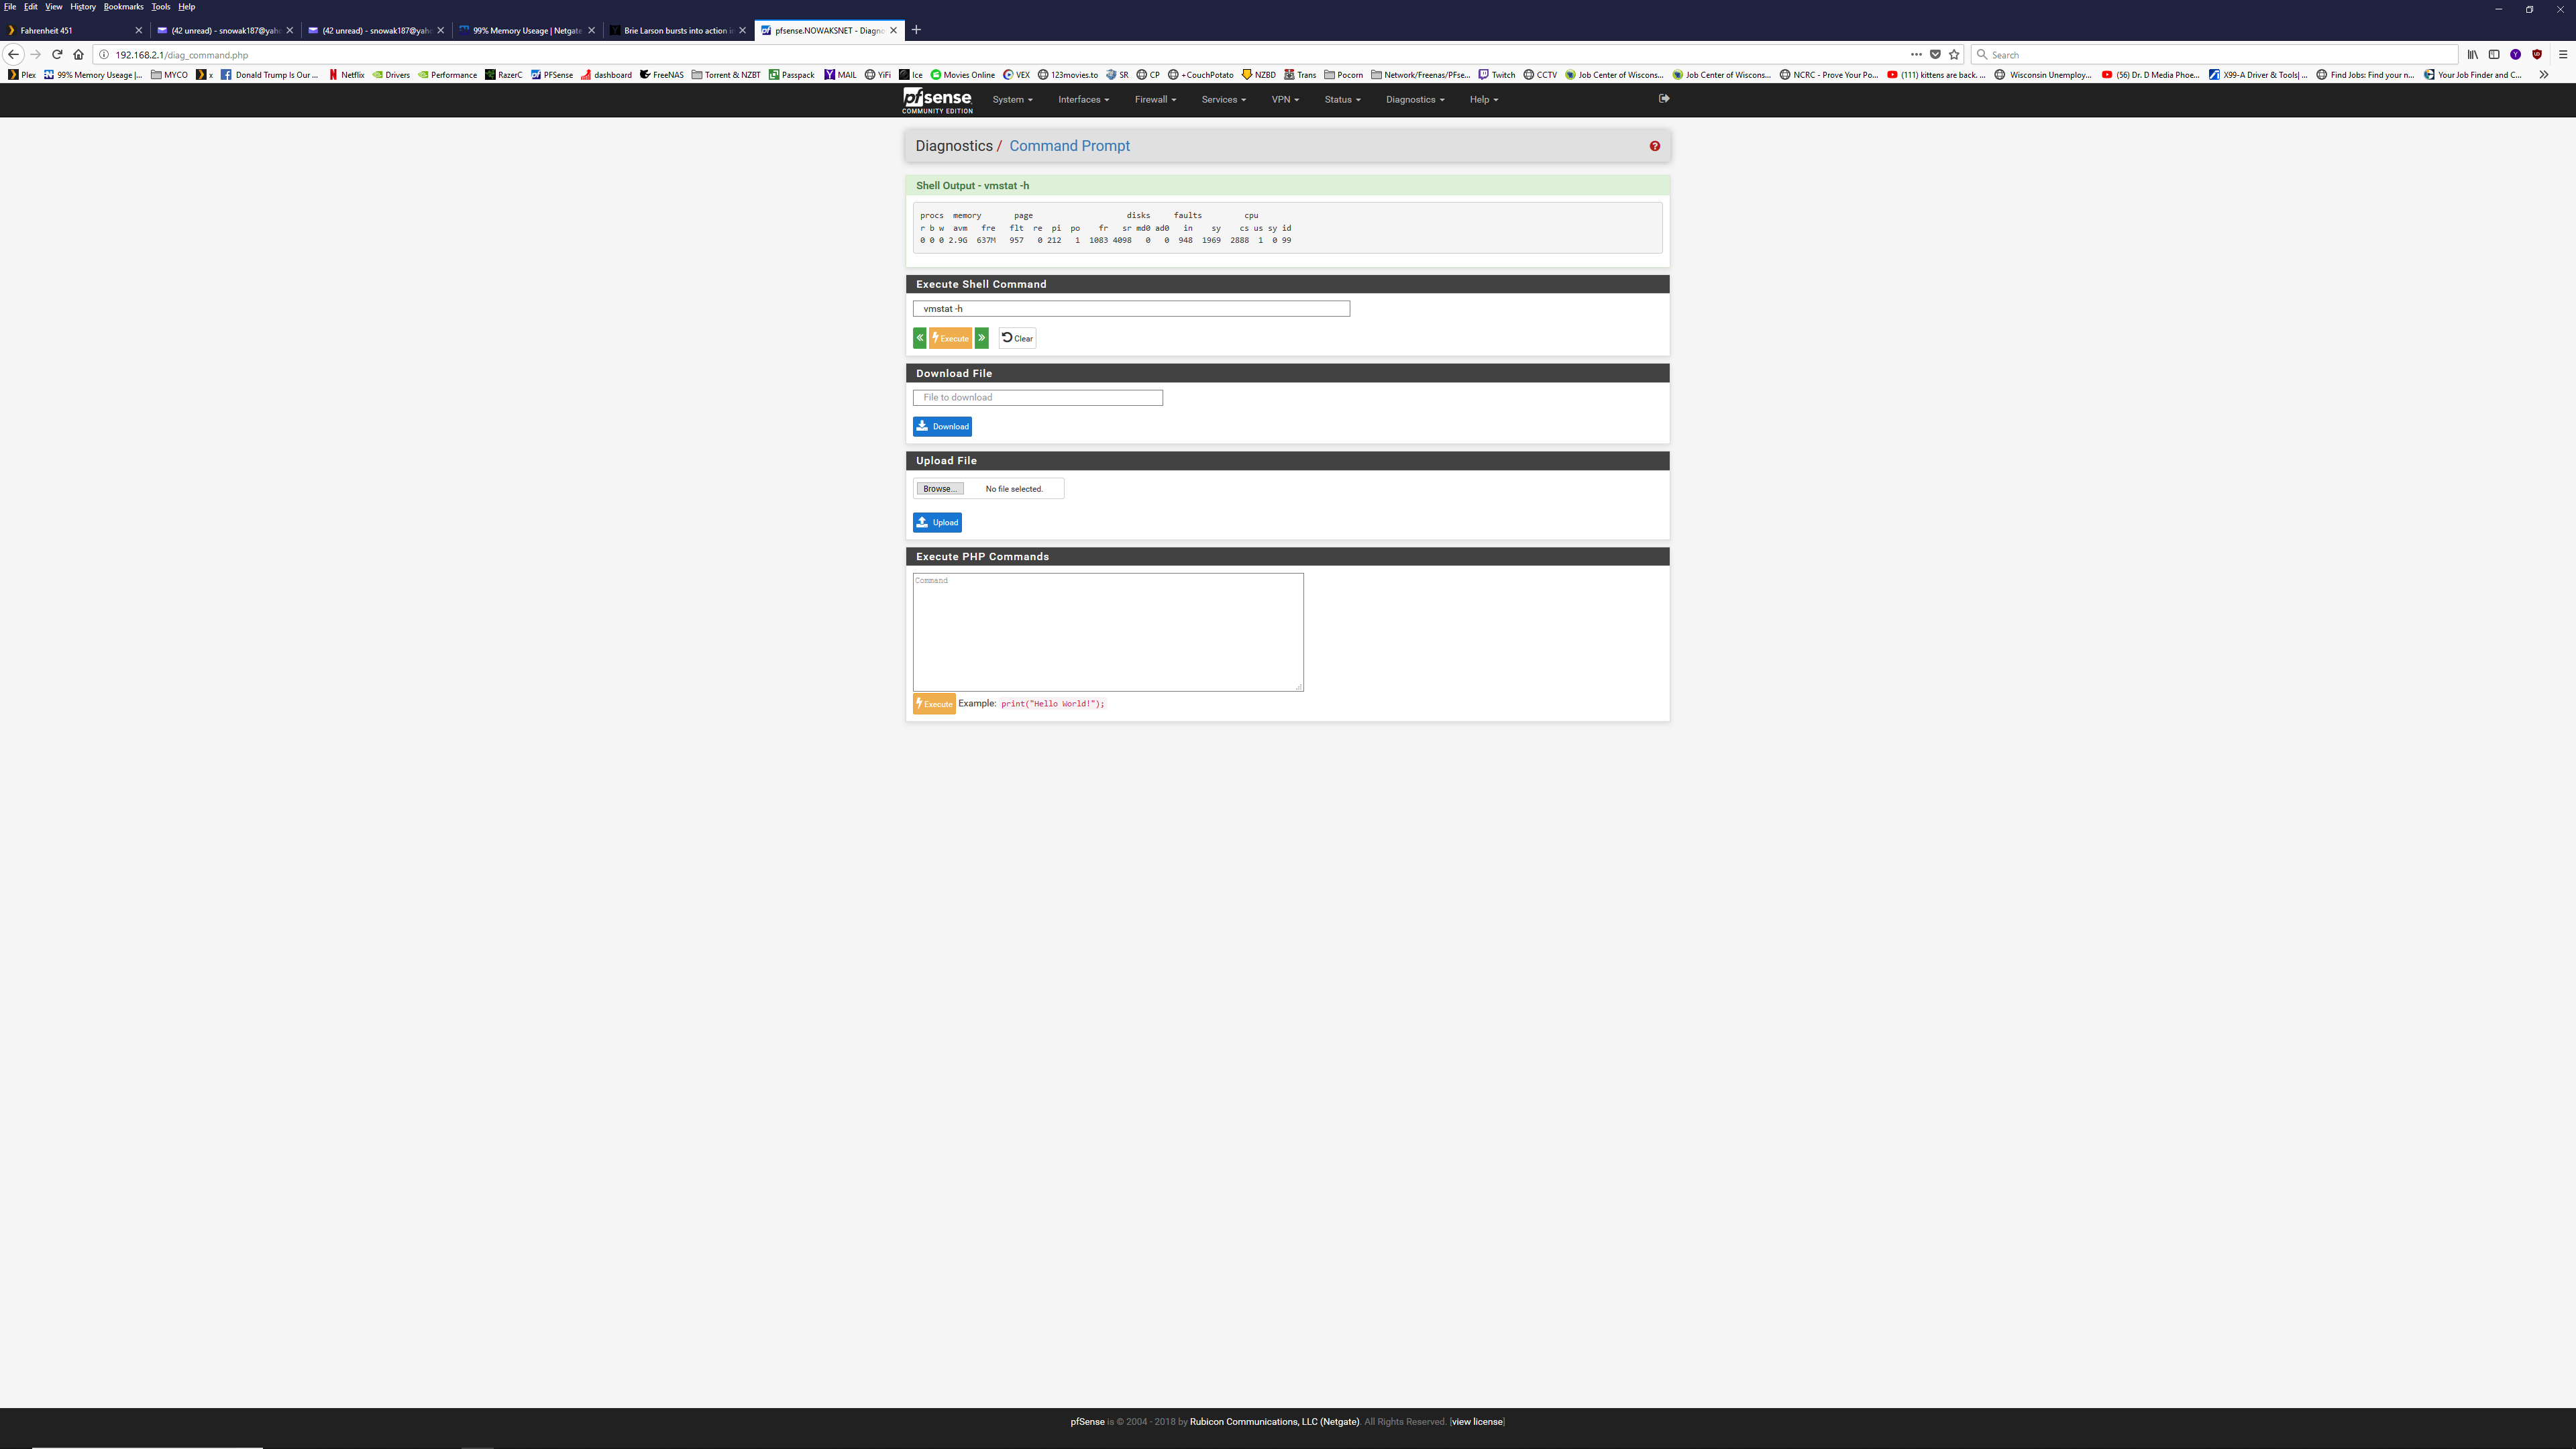
Mmm, something is very wrong there. Try this. Run
top -aSHat the command line, so probably via SSH.Then when it's running hit
oto change the sort order and then typesizeto sort by size. Hit q to quit. Copy paste that here.Steve
-
Yes Cisco I have did not change. I've some how fixed the problem I have suricata on even higher setting.
Then I had be for when they where stock. Ive also install Squid proxy. like 12 more Pf blockers Lists so thing On pfsense side cause a memory leak.
I've been stable at 10-20% memory now With Lan/Wan with Suricata on high, Max pending packets on 10k.
Also Set Pattern Matcher Algorithm off auto to hyper scan. I did this to try and see if it Suricata Or to see if I
could get what was happening in 2-3day to happen in 1. Pf blocker was change to Dlev.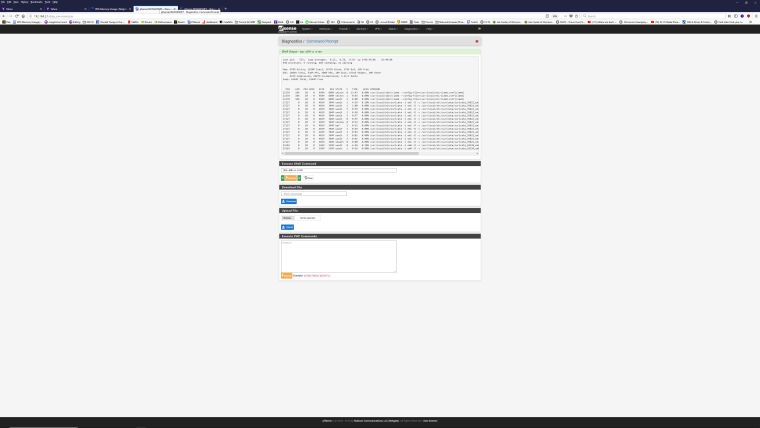
-
If you guys still want to see if I can reproduce the problem I can go back to bone stock suricata setup.
I also disable DNS Forwarder and just set unbound to do every thing it was split be for.
So maybe this was the cause and not the packages I can re enable DNS forwarder and see if my memory goes back to what was seen.