Grafana Dashboard using Telegraf with additional plugins
-
@von-papst This is just a single panel, add it to the dashboard being developed in this thread.
-
This post is deleted! -
I think I am late to the party but I am trying to figure some things out. I am running pfsense in a vm on esxi 6.7. I was able to figure out enough to get most of the panels working but I think the scripts arent working. I am not super familiar with FreeBSD so I am finding it difficult to determine how to test run the scripts so that I can remediate. I am pretty sure the scripts arent running because all of the panels aren't populated with data and when I do a show measurements on the DB I get only the entries listed below. Any advice would be appreciated.
cpu
disk
diskio
mem
net
pf
processes
swap
system -
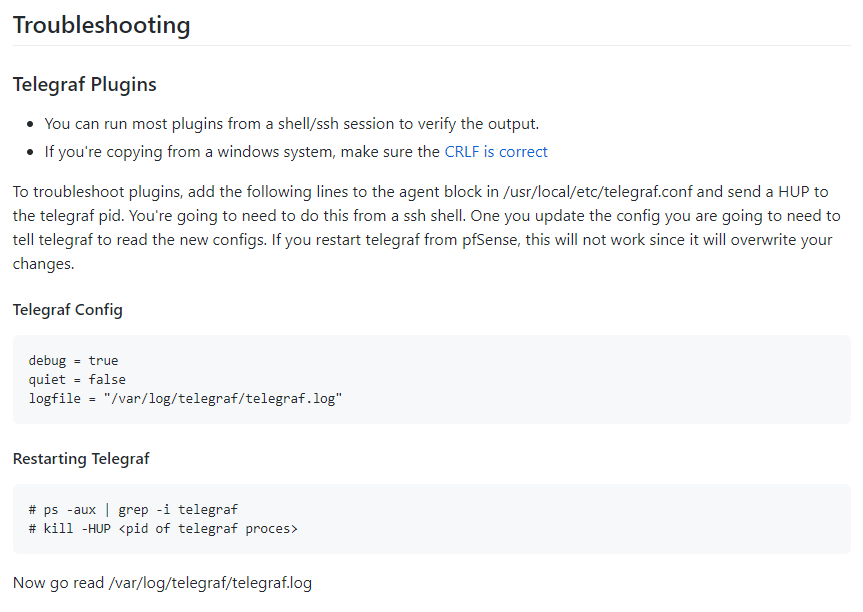
@jpcapone This is the best way to troubleshoot the plugins
Taken from https://github.com/VictorRobellini/pfSense-Dashboard
-
This post is deleted! -
@bigjohns97
Thanks for that. I was able to figure out the issues with the plugins. Now I am just left with what I have pasted below. Can you please advise?2021-02-23T19:01:58Z I! Loaded inputs: cpu disk diskio exec kernel logparser (2x) mem net pf processes swap system
2021-02-23T19:01:58Z I! Loaded aggregators:
2021-02-23T19:01:58Z I! Loaded processors:
2021-02-23T19:01:58Z I! Loaded outputs: influxdb
2021-02-23T19:01:58Z I! Tags enabled: host=xxxxpfSense.xxxxolutions.co
2021-02-23T19:01:58Z I! [agent] Config: Interval:10s, Quiet:false, Hostname:"xxxxpfSense.xxxxolutions.co", Flush Interval:10s
2021-02-23T19:01:58Z D! [agent] Initializing plugins
2021-02-23T19:01:58Z W! [inputs.logparser] The logparser plugin is deprecated; please use the 'tail' input with the 'grok' data_format
2021-02-23T19:01:58Z W! [inputs.logparser] The logparser plugin is deprecated; please use the 'tail' input with the 'grok' data_format
2021-02-23T19:01:58Z D! [agent] Connecting outputs
2021-02-23T19:01:58Z D! [agent] Attempting connection to [outputs.influxdb]
2021-02-23T19:01:58Z D! [agent] Successfully connected to outputs.influxdb
2021-02-23T19:01:58Z D! [agent] Starting service inputs
2021-02-23T19:01:58Z E! [inputs.logparser] Error in plugin: open /var/log/pfblockerng/dnsbl.log: no such file or directory
2021-02-23T19:01:58Z E! [inputs.logparser] Error in plugin: open /var/log/pfblockerng/ip_block.log: no such file or directory
2021-02-23T19:02:00Z E! [inputs.logparser] Error in plugin: open /var/log/pfblockerng/dnsbl.log: no such file or directory
2021-02-23T19:02:00Z E! [inputs.logparser] Error in plugin: open /var/log/pfblockerng/ip_block.log: no such file or directory -
@jpcapone said in Grafana Dashboard using Telegraf with additional plugins:
@bigjohns97
Thanks for that. I was able to figure out the issues with the plugins. Now I am just left with what I have pasted below. Can you please advise?2021-02-23T19:01:58Z I! Loaded inputs: cpu disk diskio exec kernel logparser (2x) mem net pf processes swap system
2021-02-23T19:01:58Z I! Loaded aggregators:
2021-02-23T19:01:58Z I! Loaded processors:
2021-02-23T19:01:58Z I! Loaded outputs: influxdb
2021-02-23T19:01:58Z I! Tags enabled: host=xxxxpfSense.xxxxolutions.co
2021-02-23T19:01:58Z I! [agent] Config: Interval:10s, Quiet:false, Hostname:"xxxxpfSense.xxxxolutions.co", Flush Interval:10s
2021-02-23T19:01:58Z D! [agent] Initializing plugins
2021-02-23T19:01:58Z W! [inputs.logparser] The logparser plugin is deprecated; please use the 'tail' input with the 'grok' data_format
2021-02-23T19:01:58Z W! [inputs.logparser] The logparser plugin is deprecated; please use the 'tail' input with the 'grok' data_format
2021-02-23T19:01:58Z D! [agent] Connecting outputs
2021-02-23T19:01:58Z D! [agent] Attempting connection to [outputs.influxdb]
2021-02-23T19:01:58Z D! [agent] Successfully connected to outputs.influxdb
2021-02-23T19:01:58Z D! [agent] Starting service inputs
2021-02-23T19:01:58Z E! [inputs.logparser] Error in plugin: open /var/log/pfblockerng/dnsbl.log: no such file or directory
2021-02-23T19:01:58Z E! [inputs.logparser] Error in plugin: open /var/log/pfblockerng/ip_block.log: no such file or directory
2021-02-23T19:02:00Z E! [inputs.logparser] Error in plugin: open /var/log/pfblockerng/dnsbl.log: no such file or directory
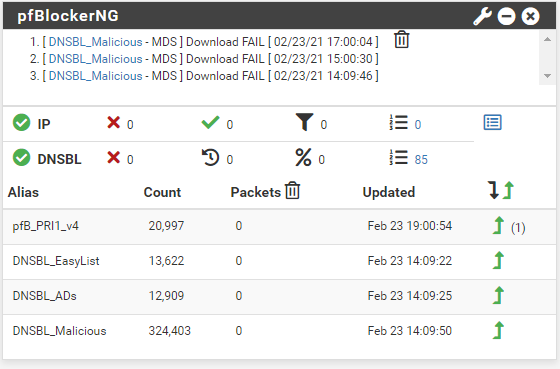
2021-02-23T19:02:00Z E! [inputs.logparser] Error in plugin: open /var/log/pfblockerng/ip_block.log: no such file or directoryLooks like you aren't using pfblockerng is that the case?
Are you now getting data on the influxdb side and in turn on your dashboard?
-
@bigjohns97
yup, I am getting data but I am still not seeing the same measurements in my DB that you see in the in the troubleshooting section. Also, I had to turn on pfblockerng and now but I am still not getting any data from it in grafana. Any suggestions?
-
@bigjohns97 I think I got it. No data was being generated because I wasn't surfing after I set up pfblockerng. I am very new to this as you can tell. Thanks for your help!!!!
-
I've made some updates to the dashboard. I would love feedback.
https://github.com/VictorRobellini/pfSense-Dashboard/commit/520eea4f49b5107cb79e887ec94951c015d52a6e
-
@victorrobellini said in Grafana Dashboard using Telegraf with additional plugins:
I've made some updates to the dashboard. I would love feedback.
https://github.com/VictorRobellini/pfSense-Dashboard/commit/520eea4f49b5107cb79e887ec94951c015d52a6e
You didn't like my unbound cache hit panel above?
-
More updates and bugfixes
telegraf config update required! Please read this in the Readme or things won't work
I updated the parser for the pfBlocker logs. It now uses the non-deprecated tails plugin and also fixes parsing errors that prevented data from being inserted into the influxdb.
-
@bigjohns97 said in Grafana Dashboard using Telegraf with additional plugins:
The extra panels are great, but it's not something I use and since I don't know how to properly partition and rollup influx data, I haven't implemented the unbound data. If influx had an automatic rollup like RRD, I would absolutely include it. I'm just being mindful of database growth.
-
I went back to poke around the unbound plugin, it seems to be working fine without the wrapper. I read through the plugin docs to find a use case for collecting the data and showing metrics, but there's just soo much data and I can't think of a use that would justify the additional collection and overhead. Here's your panel in template format and additional telegraf config:
Telegraf config
[[inputs.unbound]]
    server = "127.0.0.1:953"
    binary = "/usr/local/sbin/unbound-control"
    config_file = "/var/unbound/unbound.conf"
    timeout = "1s"
    thread_as_tag = true
Grafana 7 graph
{ "aliasColors": { "Hits": "#629e51", "Misses": "#bf1b00" }, "breakPoint": "50%", "cacheTimeout": null, "combine": { "label": "Others", "threshold": 0 }, "decimals": null, "fieldConfig": { "defaults": { "custom": {} }, "overrides": [] }, "fontSize": "100%", "format": "short", "gridPos": { "h": 5, "w": 5, "x": 0, "y": 1 }, "hideTimeOverride": false, "id": 23763571993, "interval": null, "legend": { "header": "", "percentage": true, "percentageDecimals": 0, "show": true, "sortDesc": true, "values": false }, "legendType": "On graph", "links": [], "maxDataPoints": 3, "nullPointMode": "connected", "pieType": "donut", "pluginVersion": "6.3.3", "strokeWidth": "2", "targets": [ { "alias": "Hits", "groupBy": [], "measurement": "unbound", "orderByTime": "ASC", "policy": "default", "refId": "A", "resultFormat": "time_series", "select": [ [ { "params": [ "total_num_cachehits" ], "type": "field" } ] ], "tags": [ { "key": "host", "operator": "=~", "value": "/^$Host$/" } ] }, { "alias": "Misses", "groupBy": [], "measurement": "unbound", "orderByTime": "ASC", "policy": "default", "refId": "B", "resultFormat": "time_series", "select": [ [ { "params": [ "total_num_cachemiss" ], "type": "field" } ] ], "tags": [ { "key": "host", "operator": "=~", "value": "/^$Host$/" } ] } ], "thresholds": [], "timeFrom": null, "timeShift": null, "title": "DNS Cache Hit/Miss Ratio", "type": "grafana-piechart-panel", "valueName": "current", "datasource": null } -
Here's a plugin - telegraf_unbound_lite.sh - that pulls in just the metrics associated with your graph. It uses the same structure as the unbound plugin but the names use "." rather than "_", other than that, it's a drop-in replacement.
Just add it to the telegraf config under the telegraf_temperature.sh entry.
-
This post is deleted! -
@victorrobellini Any idea why I still have this error when trying to execute the gateways script from the telegraf conf file?
[inputs.exec] Error in plugin: exec: fork/exec /usr/local/bin/gateways.py: no such file or directory for command '/usr/local/bin/gateways.py':
I have checked the permissions on the script file and it's set to 0555, no weird characters in the script and when I run the file from CLI I get proper behavior.
[2.4.5-RELEASE][admin@******]/root: /usr/local/bin/python3.7 /usr/local/bin/gateways.py
gateways,gateway_name=WAN_DHCP rtt=769.0,rttsd=562.0,loss=0i
I'm on pfsense 2.4.5 and latest telegraf, rest of settings in telegraf working fine.
-
@doboy So turns out I had to use the full path + script in telegraf conf file
commands = [ "/usr/local/bin/python3.7 /usr/local/bin/gateways.py" ] -
Thank you, you have created a great addition to pfsense and grafana.
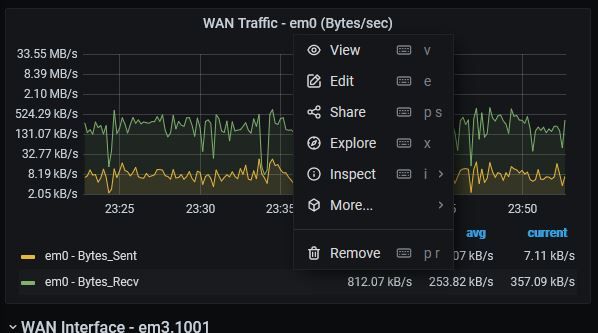
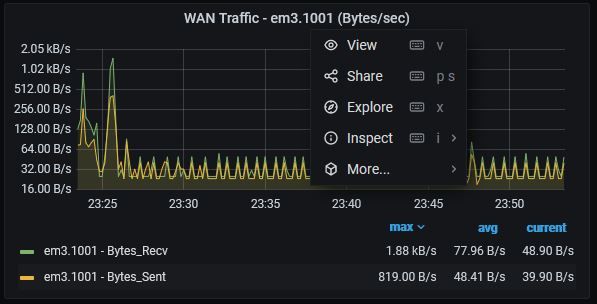
I am trying to create an alert using your dashboard but I cannot find any way to edit a WAN2 panel. Is there a way to copy a panel so I can modify it to add an alert? The specific alert is to notify me if WAN_LTE throughput exceeds some threshold. The other grafana panels (WAN) have an edit and duplicate options but I can't find the option on the second WAN option. Weird right?
Thank you,
Devan
-
@ddbnj said in Grafana Dashboard using Telegraf with additional plugins:
The other grafana panels (WAN) have an edit and duplicate options
My guess is that you are going to have to disable duplicate for the WAN panel. Then make a copy of it and hard code it to "WAN2". An easier option may be to copy it to a new custom dashboard that has only the alerting metrics, otherwise you are going to have to update things in the future if/when I make more changes.