• Categories
  • Recent
  • Tags
  • Popular
  • Users
  • Search
  • Register
  • Login
Netgate Discussion Forum
  • Categories
  • Recent
  • Tags
  • Popular
  • Users
  • Search
  • Register
  • Login

Grafana Dashboard using Telegraf with additional plugins

Scheduled Pinned Locked Moved pfSense Packages
173 Posts 28 Posters 70.7k Views
Loading More Posts
  • Oldest to Newest
  • Newest to Oldest
  • Most Votes
Reply
  • Reply as topic
Log in to reply
This topic has been deleted. Only users with topic management privileges can see it.
  • W
    wrightsonm @wrightsonm
    last edited by wrightsonm Jul 8, 2023, 12:05 PM Apr 30, 2021, 6:37 PM

    @wrightsonm
    This is the dashboard working once again for me:
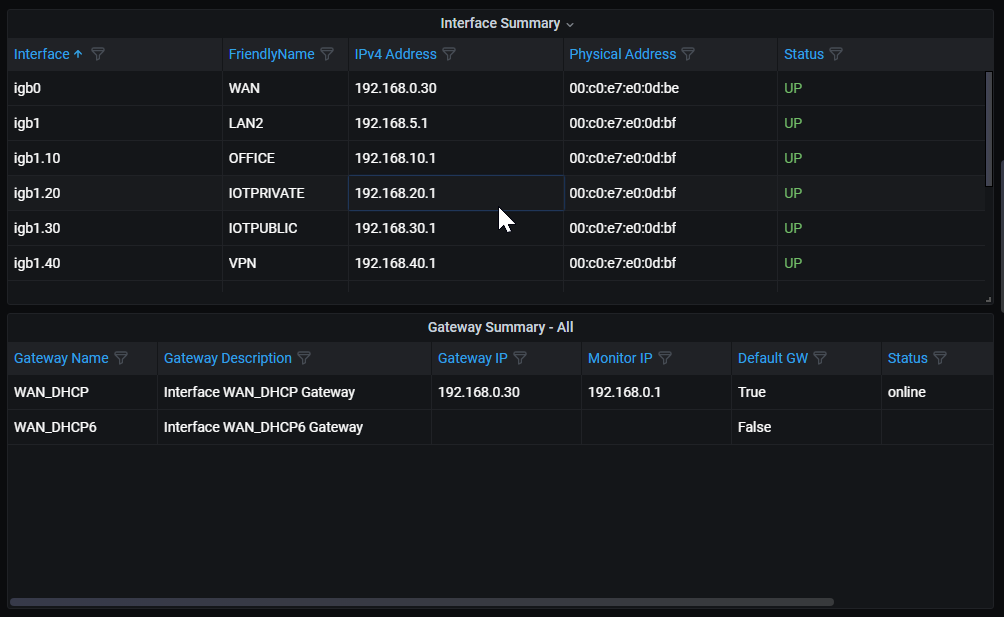
    30209c7e-4ed6-405a-8d7f-f3db254d2e0c-image.png

    telegraf --test --config /usr/local/etc/telegraf.conf

    Grafana Gateway Variable changed back to:

    SHOW TAG VALUES FROM "gateways" WITH KEY = "gateway_name" WHERE "host" =~ /^$Host$/
    

    Modified plugins:
    telegraf_gateways.php.txt

    Reverted plugin:
    telegraf_pfinterface.php.txt

    Modified dashboard:
    grafana.json.txt

    1 Reply Last reply Reply Quote 0
    • V
      VictorRobellini
      last edited by Apr 30, 2021, 9:56 PM

      @wrightsonm said in Grafana Dashboard using Telegraf with additional plugins:

      with ipv4 and ipv6 enabled, then you end up with a problem with the gateways telegraf lines as igb0 exists twice

      Does this happen for the interface table? If you are willing to troubleshoot this with me, please open a github issue so we don't flood this thread with troubleshooting.

      W 1 Reply Last reply May 1, 2021, 9:12 AM Reply Quote 0
      • V
        VictorRobellini @jpetovello
        last edited by Apr 30, 2021, 10:03 PM

        @jpetovello This is a pet project I built for use with my homelab and documented to help others. The main prereqs are that you have influx and grafana already set up. I didn't document that since everyone is going to have their systems set up differently. Luckily, there's no shortage of tutorials available online. My recommendation is to get your influxdb and grafana setup, read the github readme, read through this thread, and search the closed issues in the github project.

        1 Reply Last reply Reply Quote 0
        • W
          wrightsonm @VictorRobellini
          last edited by May 1, 2021, 9:12 AM

          @victorrobellini yeah sure. I've not got any time until Tuesday now. The solution is in the attachments and pictures above. I can raise a Pull Request with the fixes on Tuesday if you like?

          V 1 Reply Last reply May 1, 2021, 4:43 PM Reply Quote 0
          • V
            VictorRobellini @wrightsonm
            last edited by VictorRobellini May 1, 2021, 5:31 PM May 1, 2021, 4:43 PM

            @wrightsonm I just reread what you wrote. I have no idea how that happened. Thanks for the heads up. I may just merge the 2 scripts since they are doing very similar stuff. I'll take a look this weekend.

            Update: I merged the scripts and updated the repo. Everything should be working now.

            1 Reply Last reply Reply Quote 0
            • V
              VictorRobellini @wrightsonm
              last edited by May 1, 2021, 5:42 PM

              @wrightsonm said in Grafana Dashboard using Telegraf with additional plugins:

              Final note, is this dashboard now requires a 1440p monitor to view everything without horizontal scrolling.

              Sorry, I run this on either a 4k or an ultrawide 1080p display. If you have it reformatted for 1080p just add the json with a new name and submit a PR.

              1 Reply Last reply Reply Quote 0
              • V
                von Papst
                last edited by May 2, 2021, 4:59 AM

                I copied the new scripts for plugin and configured permissions on them (755), imported new dashboard but now I'm not getting any temperatures reading, IP or DNSBL lists, no network interface summary, no Gateway RTT or loss. Any hint what I missed in the upgrade process?

                V 1 Reply Last reply May 2, 2021, 7:07 AM Reply Quote 0
                • V
                  von Papst @von Papst
                  last edited by May 2, 2021, 7:07 AM

                  @von-papst Got temperatures working (CRLF from M$ messed up script). Still missing lists from pfblocker-ng and interface summary.

                  W 1 Reply Last reply May 2, 2021, 7:24 AM Reply Quote 0
                  • W
                    wrightsonm @von Papst
                    last edited by May 2, 2021, 7:24 AM

                    @von-papst check the CRLF on all the plugins. Then use the telegraf test command to check that there are no errors. Failing that add the debug logging option to telegraf and check the log file. Instructions for the above are on the GitHub readme.

                    V 2 Replies Last reply May 2, 2021, 8:19 AM Reply Quote 1
                    • V
                      von Papst @wrightsonm
                      last edited by May 2, 2021, 8:19 AM

                      @wrightsonm Got pfblocker working, changed queries and added some info. But Gateway RTT and loss still not working.
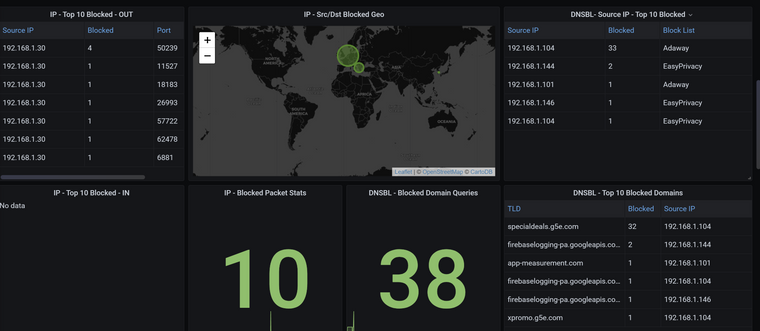
                      d20b125c-5fea-40f2-95f8-38287ff646dd-image.png

                      1 Reply Last reply Reply Quote 0
                      • V
                        von Papst @wrightsonm
                        last edited by May 2, 2021, 12:51 PM

                        @wrightsonm Got everything working now. I needed to modify some queries in the dashboard and added gateways.py script.

                        V 1 Reply Last reply May 2, 2021, 6:09 PM Reply Quote 0
                        • J
                          jpetovello
                          last edited by May 2, 2021, 4:02 PM

                          I'm a bit confused, where do the plugins need to be placed? Am I supposed to upload them to my pfSense install?

                          V 1 Reply Last reply May 2, 2021, 5:36 PM Reply Quote 0
                          • V
                            von Papst @jpetovello
                            last edited by May 2, 2021, 5:36 PM

                            @jpetovello you should upload them to you pfsense.

                            1 Reply Last reply Reply Quote 0
                            • V
                              VictorRobellini @von Papst
                              last edited by May 2, 2021, 6:09 PM

                              @von-papst @wrightsonm

                              I think there was some drift between my local system and my repo. I've updated the dashboard JSON. It should work with the updated gateways/interface plugin.

                              W 1 Reply Last reply May 14, 2021, 1:11 PM Reply Quote 0
                              • W
                                wrightsonm @VictorRobellini
                                last edited by May 14, 2021, 1:11 PM

                                @victorrobellini What is your influxdb ram utilisation looking like with the latest set of changes? With the grafana dashboard, my influxdb ram has increased to 12GB. I had to increase the RAM allocation on my docker VM (now at 20GB). I'm going to keep an eye on it.

                                I think high series cardinality might be related. Will do some investigations. Unfortunately InfluxDB OSS v2 doesn't currently implement the cardinality command (only Cloud version at the moment).
                                https://docs.influxdata.com/influxdb/v2.0/reference/flux/stdlib/influxdb/cardinality/

                                I also think the logged data shows something port scanning me yesterday which may be related to the big increase in cardinality of the data.

                                V 1 Reply Last reply Jun 18, 2021, 4:36 PM Reply Quote 0
                                • B
                                  bigjohns97
                                  last edited by Jun 10, 2021, 2:40 PM

                                  I found this neat little command playing around with PowerD options and it seems to be really light and work well for tracking CPU frequency changes.

                                  sysctl dev.cpu.0.freq

                                  Was thinking it would make a nice graph for those are also using PowerD which I would think would be most people but I could be wrong.

                                  I would write this myself but it would just end up getting done better by others in this thread :)

                                  @VictorRobellini what do you think about this, good add?

                                  V 1 Reply Last reply Jun 10, 2021, 5:22 PM Reply Quote 0
                                  • V
                                    VictorRobellini @bigjohns97
                                    last edited by Jun 10, 2021, 5:22 PM

                                    @bigjohns97

                                    Interesting, I never messed with that, I just turned it on. This is an easy fit and can use the same script as the telegraf_temperature.sh script.

                                    All you need to do is add the following line to the end of the script and build some graphs.

                                    sysctl dev.cpu | fgrep "freq:" | tr -d '[:blank:]' | awk -v HOST="$HOSTNAME" -F '[.:]' '{print "temperature,sensor="$2$3",host="HOST" "$4"="$5""substr($7, 1, length($7)-1)}'
                                    

                                    The better way to implement it (which I don't have the time for right now) is to completely rename the telegraf_temperature.sh script to be something like telegraf_sysctl.sh and update all of the commands to output with a similar format and then update the queries and graphs. If you just want to poke around and see what you can get, use the above recommendation.

                                    sysctl dev.cpu | fgrep -e "freq:" -e temperature | tr -d '[:blank:]' | awk -v HOST="$HOSTNAME" -F '[.:]' '{print "sysctl,sensor="$2$3",host="HOST" "$4"="$5""substr($7, 1, length($6)-1)}'
                                    sysctl hw.acpi.thermal | fgrep temperature | tr -d '[:blank:]' | awk -v HOST="$HOSTNAME" -F '[.:]' '{print "sysctl,sensor="$4",host="HOST" "$5"="$6"." substr($7, 1, length($7)-1)}'
                                    

                                    Something like this:

                                    sysctl,sensor=cpu0,host=pfSense.home freq=1900
                                    sysctl,sensor=cpu3,host=pfSense.home temperature=47.0
                                    sysctl,sensor=cpu2,host=pfSense.home temperature=47.0
                                    sysctl,sensor=cpu1,host=pfSense.home temperature=49.0
                                    sysctl,sensor=cpu0,host=pfSense.home temperature=49.0
                                    sysctl,sensor=tz1,host=pfSense.home temperature=29.9
                                    sysctl,sensor=tz0,host=pfSense.home temperature=27.9
                                    
                                    B 1 Reply Last reply Jun 12, 2021, 4:50 PM Reply Quote 1
                                    • B
                                      bigjohns97 @VictorRobellini
                                      last edited by Jun 12, 2021, 4:50 PM

                                      @victorrobellini said in Grafana Dashboard using Telegraf with additional plugins:

                                      sysctl dev.cpu | fgrep "freq:" | tr -d '[:blank:]' | awk -v HOST="$HOSTNAME" -F '[.:]' '{print "temperature,sensor="$2$3",host="HOST" "$4"="$5""substr($7, 1, length($7)-1)}'

                                      That worked like a charm, thank you so much.

                                      1 Reply Last reply Reply Quote 1
                                      • J
                                        jpetovello
                                        last edited by Jun 18, 2021, 4:13 PM

                                        Anyone else having problems with Uptime displaying?

                                        Mine just shows N/A

                                        B V 2 Replies Last reply Jun 18, 2021, 4:24 PM Reply Quote 0
                                        • B
                                          bigjohns97 @jpetovello
                                          last edited by Jun 18, 2021, 4:24 PM

                                          @jpetovello This is what I have for my query

                                          SELECT "uptime_format" FROM "system"
                                          
                                          1 Reply Last reply Reply Quote 1
                                          • First post
                                            Last post
                                          Copyright 2025 Rubicon Communications LLC (Netgate). All rights reserved.
                                            This community forum collects and processes your personal information.
                                            consent.not_received