PfBlockerNG high CPU
-
There's only two machines running windows, one is my primary desktop, and the problem happens while it is completely powered down. It gets regular scans and I'm cautious online so I'm pretty confident it's clean. The other is a work laptop that goes through corporate VPN before I even login, and these events happen while it is offline too.
Everything else runs Linux and I'm pretty confident they are not compromised.
There's a lot of IoT on the network, the two Nvidia Shield's are pretty chatty and were top of my pihole block counts in my previous setup, but if those cause this problem it would kinda defeat the purpose. Stopping devices like that from phoning home is part of why I'm sinkholing dns to begin with.
I did not realize I could directly monitor the states table, I see it in the diagnostics menu so I will watch it during these events.
-
Interesting images.
The states are not created by pfBlockerNG. These are created by network devices that start to do their thing, like nightly backups.
Just a theory :
I've seen iPhones/iPad's, that, while they hey are Wifi connected and being charged and stand-by and have the Apple's iCloud's storage activated, really hitting hard the network. That is, I've seen it on this forum. Never with on my own networks although I've the same equipment / configuration.
Also : one would be using a feed that have listed the Apple's cloud services as a DNSBL (you see the upcoming issue ??) and unbound / pfBlockerNG start to do what they are asked for. This can be seen as a huge miss configuration.
Remember what really happened to HAL - in 2001 movie ? Feed a system with information that is in contradiction,and you brings it down.Apple has many iCloud servers pre defines in it's OS, and if one is unreachable, it will try another one. Leaving a state aborted. This will add up quickly.
This is a Apple example, it could be any device type / service.You have the exact moment when its happens, this should help to determine which device is doing what at that moment.
If pfBlockerNG is not active, do you see the same state table bursts ? -
When DNSBL is disabled, the state table bursts do not happen. They only happen when it is enabled and when the correlating CPU bursts happen.
No Apple devices at all on my network, but there are several Amazon Echos.
-
@lunaticfringe80 said in PfBlockerNG high CPU:
When DNSBL is disabled, the state table bursts do not happen. They only happen when it is enabled and when the correlating CPU bursts happen.
No Apple devices at all on my network, but there are several Amazon Echos.
Around 24hrs between the bursts?? Ends at 2100hrs and begins again at 2100hrs. Then it runs for quite some time and happen 24hrs later again??
Is that about correct?
and can you disable ANYTHING other than pc's on the network?? And then turn on IoT one by one??
-
Almost exactly 1 hour between bursts. Not always exactly on the hour, sometimes a few minutes after. Looking at the previous test over the past 5 days those were starting at about 36mins after the hour. At first I thought it was the default hourly feed updates, but I have since made a point to change the updates to daily to rule that out.
-
@lunaticfringe80 said in PfBlockerNG high CPU:
Almost exactly 1 hour between bursts. Not always exactly on the hour, sometimes a few minutes after. Looking at the previous test over the past 5 days those were starting at about 36mins after the hour. At first I thought it was the default hourly feed updates, but I have since made a point to change the updates to daily to rule that out.
Its a 24hr timespan on the graph.... and states skyrocket at exactly 2200hrs.
Pretty suspicious to the point where there is definately a backup running....
-
@Cool_Corona said in PfBlockerNG high CPU:
Its a 24hr timespan on the graph.... and states skyrocket at exactly 2200hrs.
Pretty suspicious to the point where there is definately a backup running....
The first graph image is a 6 hour timespan. The blue mark on the top graph marks when I did the complete reinstall of pfblockerng-devel.
The second graph image is a 5 day timespan of the same metrics, where pfblockerng was disabled where the previous streak of bursts ended, up to the second mark on the cpu graph which matches up to the mark on the above graph image indicating where pfblockerng was enabled again.
The first mark on that second graph image was just me marking when I turned on all my systems to begin work that morning just so it could be seen when regular activity begins.
-
Here's a fresh capture to show you the trend is repeating like it did before:

The baby spike in between the first two is actually a small download over openvpn and is unrelated to the issue.
Just before I captured this I completely stopped all docker containers on my network to rule out any running services causing this. No backups were running. I even rebooted my Home Assistant RPi3 with no effect as you can see on the graph.
Only thing left to rule out on the network are the IoT devices and Nvidia Shields. I'll have to do that tomorrow.
-
@lunaticfringe80 said in PfBlockerNG high CPU:
Here's a fresh capture to show you the trend is repeating like it did before:
The baby spike in between the first two is actually a small download over openvpn and is unrelated to the issue.
Just before I captured this I completely stopped all docker containers on my network to rule out any running services causing this. No backups were running. I even rebooted my Home Assistant RPi3 with no effect as you can see on the graph.
Only thing left to rule out on the network are the IoT devices and Nvidia Shields. I'll have to do that tomorrow.
There is a spike in CPU at 1800hrs every day.
Again the state table spikes comes every hour starting at 2200hrs.
Shutdown everything on the LAN and start with 1 thing at a time....
-
@lunaticfringe80 said in PfBlockerNG high CPU:
but there are several Amazon Echos.
I'm pretty confident now that you have devices that "do their thing" at certain times.
And
You activated a feed (on, or more) in pfBlockerNG-devel that block these devices - that is : it blocks the addresses / IP's these devices are trying to access.Easy solution : stop using these devices. stop using pfBlockerNG-devel.
Or continue, and correct things. You've got all the tools at your disposal.
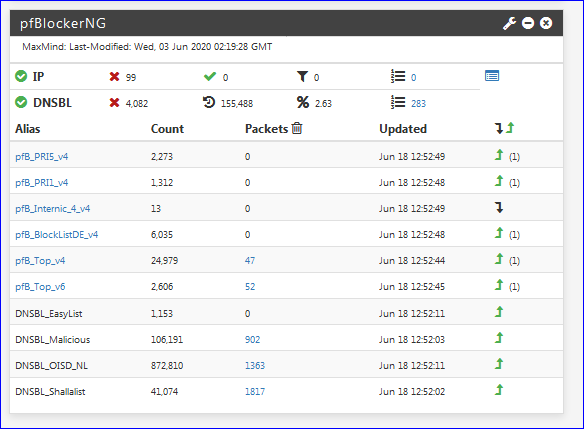
When the issue happens, go to the pfBlockerNG-devel page. The most recent IP's / DNSBL listed now are the ones your device(s) are tying to use to do what they have to do .... and they have a whole list of addresses to use / test, because hosts like "amazon" do not have one host or IP, but thousands of them. Your device(s) are testing them all. They all get blocked. Your state table, processor usage explodes.At the same moment you instructed (who else is choosing the feeds ??) with pfBlockerNG-devel that these addresses / IP's are 'forbidden'. Because they are on a (or more) list(s).
The issue can now be solved in a couple of seconds.
-
@Cool_Corona said in PfBlockerNG high CPU:
There is a spike in CPU at 1800hrs every day.
Again the state table spikes comes every hour starting at 2200hrs.
Shutdown everything on the LAN and start with 1 thing at a time....
There are no spikes at 1800 in the previous days. They also do not start at 2200. Here are closer views of those days. Keep in mind pfblockerng was not running the entire time. The spikes start and stop only because I am enabling and disabling pfblockerng. I end up disabling pfblockerng because name resolution eventually fails completely until it is disabled or restarted.


-
@Gertjan said in PfBlockerNG high CPU:
@lunaticfringe80 said in PfBlockerNG high CPU:
but there are several Amazon Echos.
I'm pretty confident now that you have devices that "do their thing" at certain times.
And
You activated a feed (on, or more) in pfBlockerNG-devel that block these devices - that is : it blocks the addresses / IP's these devices are trying to access.Easy solution : stop using these devices. stop using pfBlockerNG-devel.
Or continue, and correct things. You've got all the tools at your disposal.
When the issue happens, go to the pfBlockerNG-devel page. The most recent IP's / DNSBL listed now are the ones your device(s) are tying to use to do what they have to do .... and they have a whole list of addresses to use / test, because hosts like "amazon" do not have one host or IP, but thousands of them. Your device(s) are testing them all. They all get blocked. Your state table, processor usage explodes.At the same moment you instructed (who else is choosing the feeds ??) with pfBlockerNG-devel that these addresses / IP's are 'forbidden'. Because they are on a (or more) list(s).
The issue can now be solved in a couple of seconds.
This would be incredibly disappointing if it's the case. I was previously running Pihole on a Raspberry Pi Zero and it was blocking these devices from phoning home while keeping load at around 0.25 on that weak device. It had 990,000 domains in its blocklist and did not struggle at all.
Replacing pihole was my primary motivation for putting pfsense, rather than other available firewall distros, on this Odyssey X86 to begin with because I was told by many that pfblockerng was the superior solution. If it really can't even keep up with a few IoT devices without eventually causing an outage, then it's back to the drawing board for me.
I'll flip some breakers tomorrow to confirm this is the case before giving up completely. I appreciate everyone's help.
-
@lunaticfringe80 said in PfBlockerNG high CPU:
@Gertjan said in PfBlockerNG high CPU:
@lunaticfringe80 said in PfBlockerNG high CPU:
but there are several Amazon Echos.
I'm pretty confident now that you have devices that "do their thing" at certain times.
And
You activated a feed (on, or more) in pfBlockerNG-devel that block these devices - that is : it blocks the addresses / IP's these devices are trying to access.Easy solution : stop using these devices. stop using pfBlockerNG-devel.
Or continue, and correct things. You've got all the tools at your disposal.
When the issue happens, go to the pfBlockerNG-devel page. The most recent IP's / DNSBL listed now are the ones your device(s) are tying to use to do what they have to do .... and they have a whole list of addresses to use / test, because hosts like "amazon" do not have one host or IP, but thousands of them. Your device(s) are testing them all. They all get blocked. Your state table, processor usage explodes.At the same moment you instructed (who else is choosing the feeds ??) with pfBlockerNG-devel that these addresses / IP's are 'forbidden'. Because they are on a (or more) list(s).
The issue can now be solved in a couple of seconds.
This would be incredibly disappointing if it's the case. I was previously running Pihole on a Raspberry Pi Zero and it was blocking these devices from phoning home while keeping load at around 0.25 on that weak device. It had 990,000 domains in its blocklist and did not struggle at all.
Replacing pihole was my primary motivation for putting pfsense, rather than other available firewall distros, on this Odyssey X86 to begin with because I was told by many that pfblockerng was the superior solution. If it really can't even keep up with a few IoT devices without eventually causing an outage, then it's back to the drawing board for me.
I'll flip some breakers tomorrow to confirm this is the case before giving up completely. I appreciate everyone's help.
Have you configured "kill states" in the rules??
-
I know I did enable kill states previously, along with floating rules, but this with this current test I did not. I've just checked and confirmed that neither of those are enabled right now.
-
@lunaticfringe80 said in PfBlockerNG high CPU:
The spikes start and stop only because I am enabling and disabling pfblockerng. I end up disabling pfblockerng because name resolution eventually fails completely until it is disabled or restarted.
Ass I mentioned earlier : pfBlockerNG-devel does nothing** when it runs.
pfBlockerNG-devel prepares files that are used by unbound, the Resolver.Try it yourself : leave pfBlockerNG-devel activated, but remove all feeds.
I bet : No more issues ^^** it actually does collect statistics info in the back ground all the time.
@lunaticfringe80 said in PfBlockerNG high CPU:
This would be incredibly disappointing if it's the case
Wait ....
You are aware of the fact that most of these feeds are created by automated tools, and are free of use ?
To create them, big resources are need that do cost $$.
And imagine this one :
Me being a smart-ass, I managed to introduce an host name like : *.windowsupdate.microsoft.com on one of the feeds that you are using.
What do you thing will happens ? Except the serious huge Internet buz just I created because thousands of PC"'s can't update any more.
Because I managed to get an URL on a list.
And you are "disappointing" ? Don't be. Do what should always be done. After each setting change, be patient. Check what the results are. What do you expect to see ? What do you see ? This process goes over entire days, even weeks. humans :) -
@Gertjan said in PfBlockerNG high CPU:
Ass I mentioned earlier : pfBlockerNG-devel does nothing** when it runs.
pfBlockerNG-devel prepares files that are used by unbound, the Resolver.Try it yourself : leave pfBlockerNG-devel activated, but remove all feeds.
I bet : No more issues ^^** it actually does collect statistics info in the back ground all the time.
Obviously, feeds were enabled. I didn't think it was necessary to spell that out.
@Gertjan said in PfBlockerNG high CPU:
Wait ....
You are aware of the fact that most of these feeds are created by automated tools, and are free of use ?
To create them, big resources are need that do cost $$.
And imagine this one :
Me being a smart-ass, I managed to introduce an host name like : *.windowsupdate.microsoft.com on one of the feeds that you are using.
What do you thing will happens ? Except the serious huge Internet buz just I created because thousands of PC"'s can't update any more.
Because I managed to get an URL on a list.
And you are "disappointing" ? Don't be. Do what should always be done. After each setting change, be patient. Check what the results are. What do you expect to see ? What do you see ? This process goes over entire days, even weeks. humans :)You've completely lost me here. My point is that Pihole was able to handle the exact same DNS sinkholing workload I'm currently putting on pfblockerng without such a significant performance impact. I'm struggling to see how any of what is quoted above relates to that.
-
@lunaticfringe80 said in PfBlockerNG high CPU:
My point is that Pihole was able to handle the exact same DNS sinkholing workload I'm currently putting on pfblockerng without such a significant performance impact.
Then show something ?!
Like :
What do you have ?
Were the pi-hole "list" identical ?
How many host names ? IP adresses ?On of your feeds (= Alais, in the image above) contains a domain name (or IP) that is blocking your devices.
These devcies don't like that, and have an entire list build in - so they try them all. They get blocked.
That's what I things is happening.Step one : remove all feeds (aliases).
The problem is still there ? (answer : no ..... of course not) but please, test this yourself.
Then add one ( 1 ! ) Alais.
re test.
Ok, add another alias / feed.
And loop.
Finally, things start to go bad. You found your alias feed that block your devices.
Cross check this with the Reports DNSBL page. You should find the domain name / host name.
White list it.
Done.Don't understand something ?
Say so.
Believe it, or not, my goal is that you understand what happens.
Nice side effect : your issue will be gone.Btw : pi-hole could be "all machine language". pfBlockerNG is all PHP.
That's interpreted language - or a thousand or more times slower. (speaking in general here).
My unbound resolver has to plough through more then 900 thousand host/domain names and IP's for every DNS request.
Using pure intel machine language (compiled C code).
These are arrays in memory that weight more then 20 Mbytes. All this many times a second...
I'm using a 12 year old "Intel(R) Pentium(R) 4 CPU 3.20GHz" .... and it works - I'm amazed. -
@lunaticfringe80 said in PfBlockerNG high CPU:
What I did was uncheck the box to keep settings, completely uninstalled pfblockerng-devel, reinstalled pfblockerng-devel. I ran the wizard, and then went in to the feeds and disabled all but just one feed per group, leaving the top one in each. I set the update frequency to once a day and then entered my maxmind key. Then I ensured pfblockerng and dnsbl were both enabled. It was fine for about 5 hours and then it begins again. There's correlating state table usage as well:
I explained what I did in the post above. I apologize for the lack of specifics, I figured it was sufficient for the purpose of reproduction. The goal was to use fewer blocklists than what the wizard sets up by default to ensure my settings weren't out of line with what I'd expect the average user to have.
I was able to test the theory that pfblockerng is simply not up to the task by whitelisting what has always been the #1 blocked domain on my network in pihole by far, api.amplitude.com which my 2015 Shield TV hits like crazy. I whitelisted that domain just before bed last night while it was between spikes. There were zero spikes after that when I checked this morning. To rule out a coincidence I've removed that from the whitelist and I'm now waiting for the Shield to start hitting that domain again to confirm. I figure if if the spikes begin again, and if I can try whitelisting it in the middle of a spike and witness the spike end instantly then that's sufficient proof for me to give up and look elsewhere for my dns sinkholing needs.
-
@lunaticfringe80 said in PfBlockerNG high CPU:
The goal was to use fewer blocklists than what the wizard sets up by default to ensure my settings weren't out of line with what I'd expect the average user to have.
What are the default blocklists that you keep referring to? I've used pfBlockerNG for years and have never seen any default blocklists. In the -Devel version of pfBlockerNG, he added some lists so new folks wouldn't have to search the internet for lists to use, but I wouldn't call them default lists and they are not part of any setup wizard.
I'm not sure what you're issue is. PfBlockerNG works for me and the majority of other seasoned users.
-
@jdeloach https://i.imgur.com/T9Cz239.png
Anything with a check mark was enabled by the wizard during the initial setup. As you can see, I've turned off most of them.
It's nice to know that most users do not have this issue. It's never fun being an edge case, but clearly I'm not the only one with the issue.
I'd be interested to know if @Frosch1482 also has an Nvidia Shield TV, perhaps even a 2015 model, on their network.