Netstat connections X Maximum Concurrent Connections
-
I want to know if the value of the line "connections established (including accepts)" when executing the command "netstat -s" in pfsense has the same relation as the values presented in the datasheets of commercial firewalls, specifically in the line "Concurrent Sessions" in the datasheet (https://www.fortinet.com/content/dam/fortinet/assets/data-sheets/fortigate-100f-series.pdf) or "Max sessions" in the datasheet (https://www.paloaltonetworks.com/resources/datasheets/pa-800-series-datasheet).
Below is a part of the output of the netstat -s command in pfsense:
tcp: 59514595 packets sent 18774549 data packets (24820362633 bytes) 221228 data packets (250499605 bytes) retransmitted 2799 data packets unnecessarily retransmitted 0 resends initiated by MTU discovery 38601364 ack-only packets (0 delayed) 0 URG only packets 19921 window probe packets 483474 window update packets 1418604 control packets 47044738 packets received 9273022 acks (for 24578327701 bytes) 16780173 duplicate acks 0 acks for unsent data 20418882 packets (23629655697 bytes) received in-sequence 16512527 completely duplicate packets (22243693 bytes) 499 old duplicate packets 54 packets with some dup. data (12630 bytes duped) 46255 out-of-order packets (62091535 bytes) 0 packets (0 bytes) of data after window 0 window probes 127367 window update packets 1886 packets received after close 7 discarded for bad checksums 0 discarded for bad header offset fields 0 discarded because packet too short 0 discarded due to memory problems 36710 connection requests 1412997 connection accepts 16 bad connection attempts 0 listen queue overflows 18453 ignored RSTs in the windows **1449706 connections established (including accepts)** 746319 times used RTT from hostcache 746319 times used RTT variance from hostcache 156778 times used slow-start threshold from hostcache 1449699 connections closed (including 69247 drops) 216298 connections updated cached RTT on close 216526 connections updated cached RTT variance on close 73071 connections updated cached ssthresh on close -
No that looks like a total connections counter not a concurrent connections value.
You can reset it usingnetstat -s -zThe firewall states are probably what you want there. Something from pfinfo perhaps.
Steve
-
Hi,
I ran the netstat -sz command and in fact the counters were reset.
In your opinion, the value that is related to the "Maximum Concurrent" values in the datasheets is in Diagnostics -> Pfinfo.
My Pfsense has more than 26 interfaces, when executing pfinfo, it seems that it only gives me the states of the vtnet0 interface or are these values from the entire firewall, from all interfaces?
Interface Stats for vtnet0 IPv4 IPv6
Bytes In 1846426 29366
Bytes Out 8445375 0
Packets In
Passed 17088 107
Blocked 222 187
Packets Out
Passed 20651 0
Blocked 0 0State Table Total Rate
current entries 27215
searches 175239122230 54447.8/s
inserts 789906460 245.4/s
removals 789879243 245.4/s
Source Tracking Table
current entries 0
searches 0 0.0/s
inserts 0 0.0/s
removals 0 0.0/s
Counters
match 1057943655 328.7/s
bad-offset 0 0.0/s
fragment 1 0.0/s
short 36 0.0/s
normalize 519 0.0/s
memory 0 0.0/s
bad-timestamp 0 0.0/s
congestion 0 0.0/s
ip-option 505093 0.2/s
proto-cksum 0 0.0/s
state-mismatch 329672 0.1/s
state-insert 76 0.0/s
state-limit 0 0.0/s
src-limit 0 0.0/s
synproxy 0 0.0/s
map-failed 0 0.0/s
Limit Counters
max states per rule 0 0.0/s
max-src-states 0 0.0/s
max-src-nodes 0 0.0/s
max-src-conn 0 0.0/s
max-src-conn-rate 0 0.0/s
overload table insertion 0 0.0/s
overload flush states 0 0.0/sstates hard limit 814000
src-nodes hard limit 814000
frags hard limit 25000
table-entries hard limit 400000tcp.first 120s
tcp.opening 30s
tcp.established 86400s
tcp.closing 900s
tcp.finwait 45s
tcp.closed 90s
tcp.tsdiff 30s
udp.first 60s
udp.single 30s
udp.multiple 60s
icmp.first 20s
icmp.error 10s
other.first 60s
other.single 30s
other.multiple 60s
frag 30s
interval 10s
adaptive.start 488400 states
adaptive.end 976800 states
src.track 0s -
That is the total pf state entries. So that includes all protocols and it's also usually about double the connection count since each connection through the firewall opens a state on both interfaces it goes through.
I was trying to find a direct command that can show only TCP state counts but so far I nothing.Also that's the current count not a limit so it's not comparable with any sort of 'max' value on other firewalls.
https://docs.netgate.com/pfsense/en/latest/firewall/increasing-the-state-table-size.htmlSteve
-
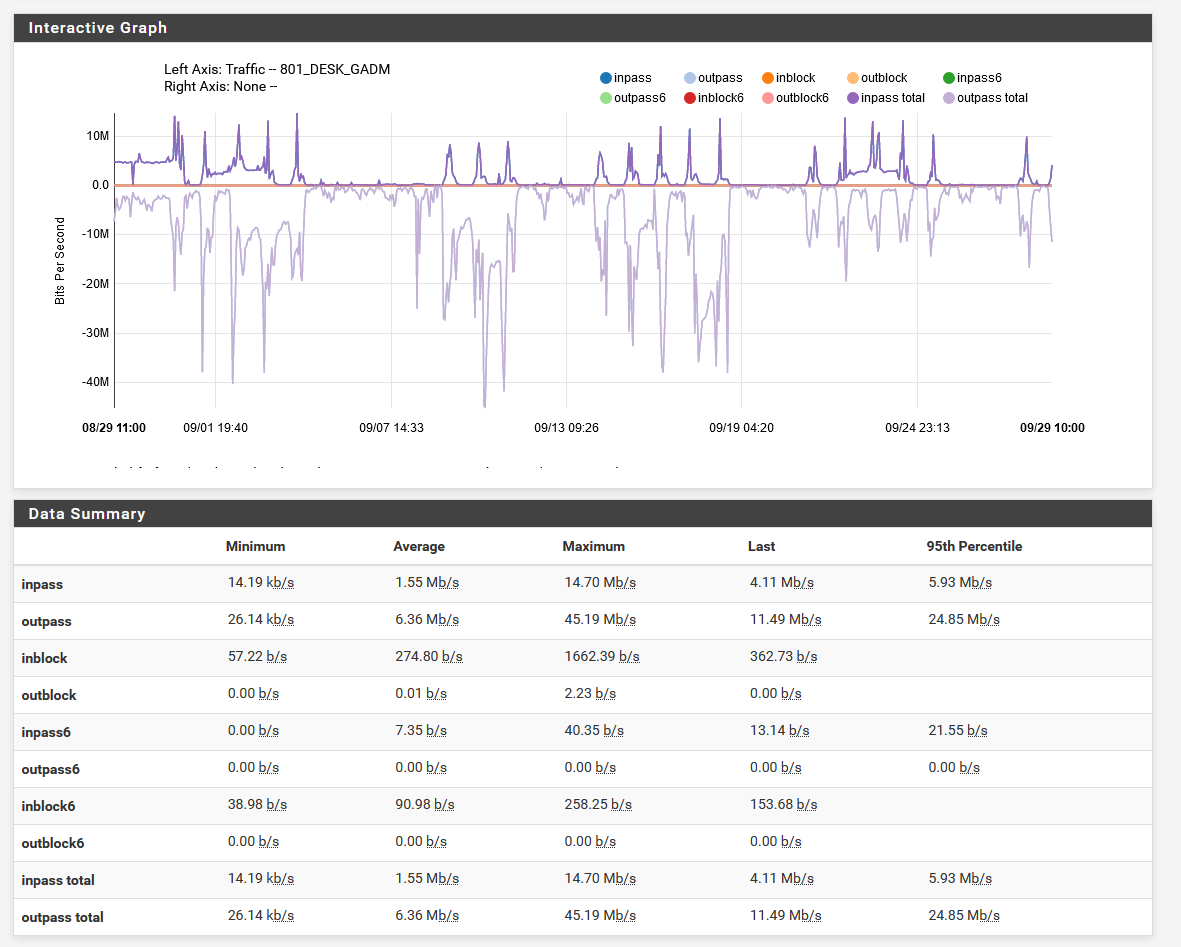
The resources available in Status -> Monitoring, configuring Left Axis as Traffic, Grafh with one of the VLANs I own and the period in the last 30 days, returned the data below. Would the sum of the data in the Maxmium column, in the lines "inpass", "outpass", "outblock" and "inblock" be the maximum value processed by the firewall reached in that period for this VLAN?
Is this something like the maximum throughput achieved for this VLAN in that period?
-
No because they were not necessarily reached at the same time. You can see the peak outpass value was not at the same point as peak inpass.
Also because the resolution is low at a 1 month scale in RRD so there may well have been peaks higher than what is shown there.Steve
-
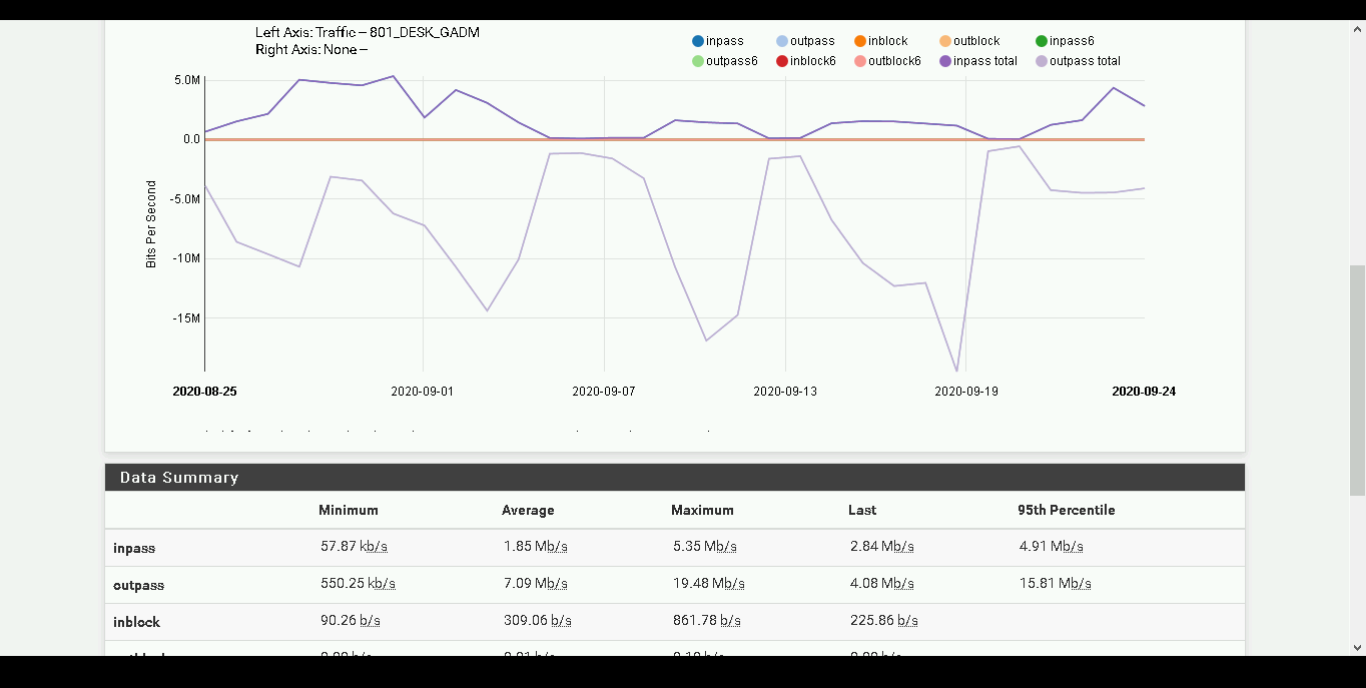
Indeed, when the resolution value for the same period is deepened, the values obtained in the report are different.
Below the last 30 days with 01 hour resolution on the same network.