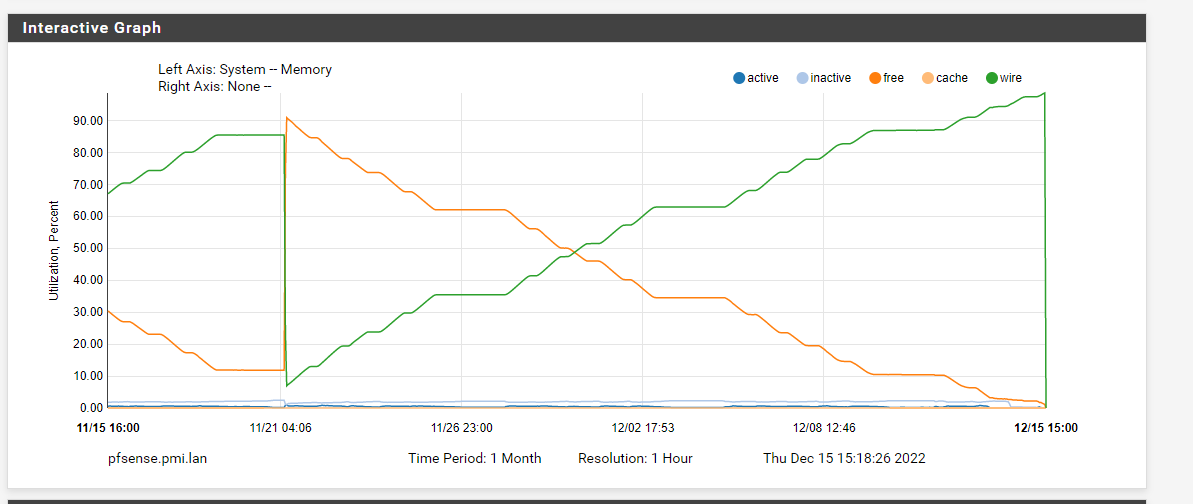
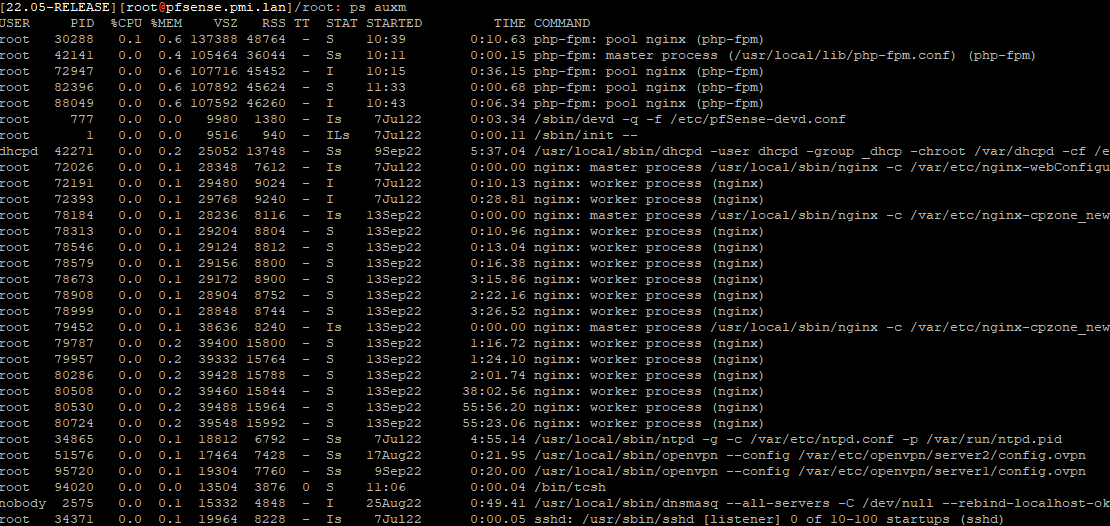
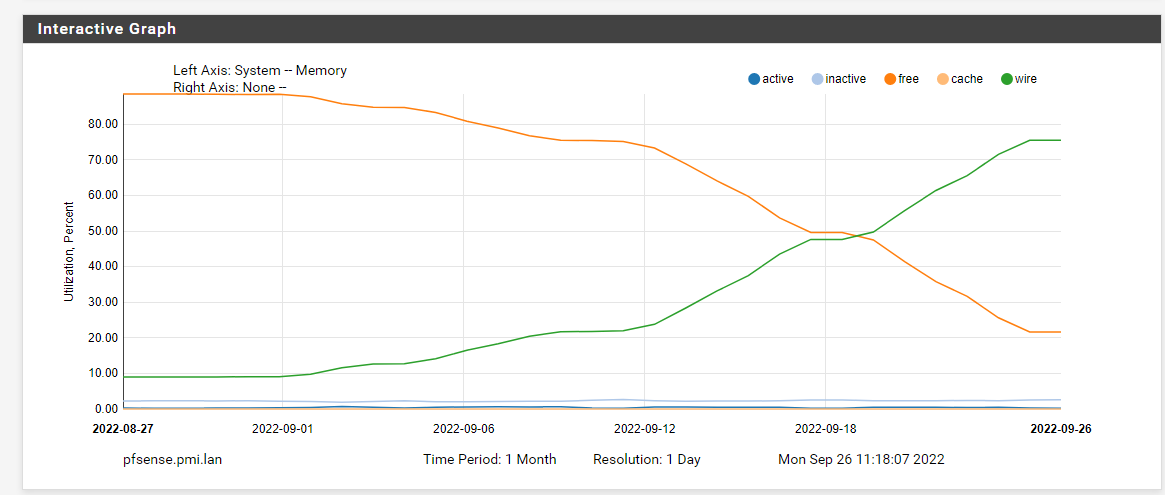
NG6100 MAX - pf+22.05 "wired" memory increasing over time
-
Hmm, OK. Try running
vmstat -zand see if that shows where it's being used. -
[22.05-RELEASE][root@pfsense.pmi.lan]/root: vmstat -z ITEM SIZE LIMIT USED FREE REQ FAIL SLEEP UMA Kegs: 224, 0, 270, 2, 270, 0, 0 UMA Zones: 936, 0, 271, 1, 271, 0, 0 UMA Slabs: 80, 0, 70297, 3, 103422, 0, 0 UMA Hash: 256, 0, 80, 40, 109, 0, 0 4 Bucket: 32, 0, 861, 1764, 9826940, 0, 0 6 Bucket: 48, 0, 102, 1475, 8650997, 0, 0 8 Bucket: 64, 0, 1112, 1430,15664937, 19, 0 12 Bucket: 96, 0, 104, 798, 2526426, 0, 0 16 Bucket: 128, 0, 260, 1538, 822118, 1, 0 32 Bucket: 256, 0, 326, 589, 2676163, 6, 0 64 Bucket: 512, 0, 980, 300,10505661,1050, 0 128 Bucket: 1024, 0, 1050, 214, 5487665,7705, 0 256 Bucket: 2048, 0, 452, 72, 3478612, 19, 0 vmem: 1856, 0, 3, 1, 3, 0, 0 vmem btag: 56, 0, 14554, 569, 14554, 107, 0 VM OBJECT: 256, 0, 8059, 1481,1002886020, 0, 0 RADIX NODE: 144, 0, 14560, 3962,1620543180, 0, 0 MAP: 240, 0, 3, 61, 3, 0, 0 KMAP ENTRY: 120, 0, 20, 508, 29, 0, 0 MAP ENTRY: 120, 0, 6364, 5054,4083143513, 0, 0 VMSPACE: 2560, 0, 78, 50,36051059, 0, 0 fakepg: 104, 0, 0, 0, 0, 0, 0 64 pcpu: 8, 0, 13338, 46310, 1972433, 0, 0 mt_stats_zone: 64, 0, 508, 260, 508, 0, 0 mt_zone: 24, 0, 508, 327, 508, 0, 0 16: 16, 0,23018700, 510,1018355362, 0, 0 32: 32, 0, 15559, 5316,5358991388, 0, 0 64: 64, 0,11526267, 835,1410775321, 0, 0 128: 128, 0,34459501, 409,1895721235, 0, 0 256: 256, 0, 45512, 28573,6298090042, 0, 0 512: 512, 0, 5932, 1420,198321701, 0, 0 1024: 1024, 0, 1319, 361,100535697, 0, 0 2048: 2048, 0, 5145, 5153,1122312103, 0, 0 4096: 4096, 0, 1430, 82,86374703, 0, 0 8192: 8192, 0, 187, 9, 239891, 0, 0 16384: 16384, 0, 142, 74,193635153, 0, 0 32768: 32768, 0, 83, 8, 9338, 0, 0 65536: 65536, 0, 11, 7, 9447425, 0, 0 SLEEPQUEUE: 80, 0, 687, 212, 687, 0, 0 kenv: 258, 0, 4, 116, 18629, 0, 0 Files: 80, 0, 278, 872,729336282, 0, 0 filedesc0: 1104, 0, 112, 92,36051092, 0, 0 rangeset pctrie nodes: 144, 0, 0, 0, 0, 0, 0 TURNSTILE: 136, 0, 687, 113, 687, 0, 0 rl_entry: 40, 0, 186, 914, 186, 0, 0 umtx pi: 96, 0, 0, 0, 0, 0, 0 umtx_shm: 88, 0, 0, 0, 0, 0, 0 PROC: 1328, 0, 111, 69,36051091, 0, 0 PGRP: 88, 0, 47, 718, 379949, 0, 0 THREAD: 1840, 0, 659, 27, 1676, 0, 0 cpuset: 104, 0, 31, 496, 31, 0, 0 domainset: 40, 0, 0, 0, 0, 0, 0 audit_record: 1280, 0, 0, 0, 0, 0, 0 mbuf_packet: 256, 3195510, 3, 1515,19016152, 0, 0 mbuf: 256, 3195510, 25520, 1807,14927036205, 0, 0 mbuf_cluster: 2048, 1000000, 18527, 1025,6649618877, 0, 0 mbuf_jumbo_page: 4096, 524288, 0, 325, 4394879, 0, 0 mbuf_jumbo_9k: 9216, 524288, 0, 0, 0, 0, 0 mbuf_jumbo_16k: 16384, 41608, 0, 0, 0, 0, 0 epoch_record pcpu: 256, 0, 5, 59, 5, 0, 0 NetGraph items: 72, 4123, 0, 527, 999002, 0, 0 NetGraph data items: 72, 4123, 0, 0, 0, 0, 0 DMAR_MAP_ENTRY: 120, 0, 0, 0, 0, 0, 0 ttyinq: 160, 0, 360, 315, 2280, 0, 0 ttyoutq: 256, 0, 188, 307, 1182, 0, 0 FPU_save_area: 1088, 0, 0, 0, 0, 0, 0 g_bio: 376, 0, 0, 530,299158612, 0, 0 linux_dma_pctrie: 144, 0, 0, 0, 0, 0, 0 linux_dma_object: 24, 0, 0, 0, 0, 0, 0 cryptop: 128, 0, 0, 0, 0, 0, 0 cryptodesc: 120, 0, 0, 0, 0, 0, 0 crypto_session: 32, 0, 0, 0, 0, 0, 0 vtnet_tx_hdr: 24, 0, 0, 0, 0, 0, 0 taskq_zone: 48, 0, 0, 1577,20890059, 0, 0 VNODE: 480, 0, 6552, 384, 1027761, 0, 0 VNODEPOLL: 120, 0, 9, 519, 272, 0, 0 BUF TRIE: 144, 0, 0, 52245, 14, 0, 0 NAMEI: 1024, 0, 0, 80,1282301499, 0, 0 rentr: 24, 0, 0, 1169, 88, 0, 0 S VFS Cache: 108, 0, 6447, 938, 9912091, 0, 0 STS VFS Cache: 148, 0, 0, 0, 0, 0, 0 L VFS Cache: 328, 0, 25, 155, 87387, 0, 0 LTS VFS Cache: 368, 0, 0, 0, 0, 0, 0 TMPFS dirent: 64, 0, 42, 1012, 1620, 0, 0 TMPFS node: 232, 0, 44, 211, 1621, 0, 0 NCLNODE: 608, 0, 0, 0, 0, 0, 0 DIRHASH: 1024, 0, 0, 0, 0, 0, 0 Mountpoints: 2744, 0, 15, 6, 27, 0, 0 AIO: 208, 0, 0, 0, 0, 0, 0 AIOP: 32, 0, 0, 0, 0, 0, 0 AIOCB: 752, 0, 0, 0, 0, 0, 0 AIOLIO: 280, 0, 0, 0, 0, 0, 0 pipe: 760, 0, 7, 88,21372927, 0, 0 range_seg_cache: 72, 0, 1422, 1218,80383797, 0, 0 zio_cache: 1064, 0, 8, 994,1305328680, 0, 0 zio_link_cache: 48, 0, 0, 1577,645868575, 0, 0 zio_buf_512: 512, 0, 7232, 424, 8801790, 0, 0 zio_data_buf_512: 512, 0, 145, 175,170305609, 0, 0 zio_buf_1024: 1024, 0, 411, 73, 1280824, 0, 0 zio_data_buf_1024: 1024, 0, 100, 56, 12740, 0, 0 zio_buf_1536: 1536, 0, 129, 51, 36221, 0, 0 zio_data_buf_1536: 1536, 0, 118, 54, 1593, 0, 0 zio_buf_2048: 2048, 0, 147, 33, 9161671, 0, 0 zio_data_buf_2048: 2048, 0, 184, 52, 323465, 0, 0 zio_buf_2560: 2560, 0, 428, 19, 20280, 0, 0 zio_data_buf_2560: 2560, 0, 62, 16, 1413, 0, 0 zio_buf_3072: 3072, 0, 381, 15, 17106, 0, 0 zio_data_buf_3072: 3072, 0, 66, 18, 2232, 0, 0 zio_buf_3584: 3584, 0, 61, 6, 435368, 0, 0 zio_data_buf_3584: 3584, 0, 59, 17, 2248, 0, 0 zio_buf_4096: 4096, 0, 1188, 150,76079367, 0, 0 zio_data_buf_4096: 4096, 0, 370, 193,15785270, 0, 0 zio_buf_5120: 5120, 0, 15, 7, 875, 0, 0 zio_data_buf_5120: 5120, 0, 18, 16, 12710, 0, 0 zio_buf_6144: 6144, 0, 10, 8, 917, 0, 0 zio_data_buf_6144: 6144, 0, 24, 10, 1468, 0, 0 zio_buf_7168: 7168, 0, 5, 5, 863, 0, 0 zio_data_buf_7168: 7168, 0, 24, 14, 1258, 0, 0 zio_buf_8192: 8192, 0, 6, 32,10905413, 0, 0 zio_data_buf_8192: 8192, 0, 20, 19, 2117, 0, 0 zio_buf_10240: 10240, 0, 12, 9, 1677, 0, 0 zio_data_buf_10240: 10240, 0, 21, 38, 11609, 0, 0 zio_buf_12288: 12288, 0, 7, 33, 6352129, 0, 0 zio_data_buf_12288: 12288, 0, 20, 34, 2621, 0, 0 zio_buf_14336: 14336, 0, 6, 8, 3532, 0, 0 zio_data_buf_14336: 14336, 0, 21, 23, 9970, 0, 0 zio_buf_16384: 16384, 0, 852, 73,21130983, 0, 0 zio_data_buf_16384: 16384, 0, 10, 31, 3323, 0, 0 zio_buf_20480: 20480, 0, 3, 25, 2717114, 0, 0 zio_data_buf_20480: 20480, 0, 13, 44, 12255, 0, 0 zio_buf_24576: 24576, 0, 4, 19, 1646077, 0, 0 zio_data_buf_24576: 24576, 0, 9, 36, 12663, 0, 0 zio_buf_28672: 28672, 0, 1, 8, 1132784, 0, 0 zio_data_buf_28672: 28672, 0, 6, 25, 12326, 0, 0 zio_buf_32768: 32768, 0, 0, 8, 897693, 0, 0 zio_data_buf_32768: 32768, 0, 6, 24, 6179, 0, 0 zio_buf_40960: 40960, 0, 5, 8, 1090737, 0, 0 zio_data_buf_40960: 40960, 0, 16, 30, 11284, 0, 0 zio_buf_49152: 49152, 0, 0, 8, 574262, 0, 0 zio_data_buf_49152: 49152, 0, 4, 24, 10816, 0, 0 zio_buf_57344: 57344, 0, 0, 9, 550734, 0, 0 zio_data_buf_57344: 57344, 0, 8, 25, 13173, 0, 0 zio_buf_65536: 65536, 0, 1, 8, 348661, 0, 0 zio_data_buf_65536: 65536, 0, 6, 16, 12700, 0, 0 zio_buf_81920: 81920, 0, 0, 9, 494529, 0, 0 zio_data_buf_81920: 81920, 0, 19, 19, 31792, 0, 0 zio_buf_98304: 98304, 0, 0, 20, 489015, 0, 0 zio_data_buf_98304: 98304, 0, 14, 18, 36140, 0, 0 zio_buf_114688: 114688, 0, 1, 8, 485102, 0, 0 zio_data_buf_114688: 114688, 0, 6, 33, 38011, 0, 0 zio_buf_131072: 131072, 0, 405, 270,38861500, 0, 0 zio_data_buf_131072: 131072, 0, 1339, 190, 682120, 0, 0 zio_buf_163840: 163840, 0, 0, 0, 0, 0, 0 zio_data_buf_163840: 163840, 0, 0, 0, 0, 0, 0 zio_buf_196608: 196608, 0, 0, 0, 0, 0, 0 zio_data_buf_196608: 196608, 0, 0, 0, 0, 0, 0 zio_buf_229376: 229376, 0, 0, 0, 0, 0, 0 zio_data_buf_229376: 229376, 0, 0, 0, 0, 0, 0 zio_buf_262144: 262144, 0, 0, 0, 0, 0, 0 zio_data_buf_262144: 262144, 0, 0, 0, 0, 0, 0 zio_buf_327680: 327680, 0, 0, 0, 0, 0, 0 zio_data_buf_327680: 327680, 0, 0, 0, 0, 0, 0 zio_buf_393216: 393216, 0, 0, 0, 0, 0, 0 zio_data_buf_393216: 393216, 0, 0, 0, 0, 0, 0 zio_buf_458752: 458752, 0, 0, 0, 0, 0, 0 zio_data_buf_458752: 458752, 0, 0, 0, 0, 0, 0 zio_buf_524288: 524288, 0, 0, 0, 0, 0, 0 zio_data_buf_524288: 524288, 0, 0, 0, 0, 0, 0 zio_buf_655360: 655360, 0, 0, 0, 0, 0, 0 zio_data_buf_655360: 655360, 0, 0, 0, 0, 0, 0 zio_buf_786432: 786432, 0, 0, 0, 0, 0, 0 zio_data_buf_786432: 786432, 0, 0, 0, 0, 0, 0 zio_buf_917504: 917504, 0, 0, 0, 0, 0, 0 zio_data_buf_917504: 917504, 0, 0, 0, 0, 0, 0 zio_buf_1048576: 1048576, 0, 0, 0, 0, 0, 0 zio_data_buf_1048576: 1048576, 0, 0, 0, 0, 0, 0 zio_buf_1310720: 1310720, 0, 0, 0, 0, 0, 0 zio_data_buf_1310720: 1310720, 0, 0, 0, 0, 0, 0 zio_buf_1572864: 1572864, 0, 0, 0, 0, 0, 0 zio_data_buf_1572864: 1572864, 0, 0, 0, 0, 0, 0 zio_buf_1835008: 1835008, 0, 0, 0, 0, 0, 0 zio_data_buf_1835008: 1835008, 0, 0, 0, 0, 0, 0 zio_buf_2097152: 2097152, 0, 0, 0, 0, 0, 0 zio_data_buf_2097152: 2097152, 0, 0, 0, 0, 0, 0 zio_buf_2621440: 2621440, 0, 0, 0, 0, 0, 0 zio_data_buf_2621440: 2621440, 0, 0, 0, 0, 0, 0 zio_buf_3145728: 3145728, 0, 0, 0, 0, 0, 0 zio_data_buf_3145728: 3145728, 0, 0, 0, 0, 0, 0 zio_buf_3670016: 3670016, 0, 0, 0, 0, 0, 0 zio_data_buf_3670016: 3670016, 0, 0, 0, 0, 0, 0 zio_buf_4194304: 4194304, 0, 0, 0, 0, 0, 0 zio_data_buf_4194304: 4194304, 0, 0, 0, 0, 0, 0 zio_buf_5242880: 5242880, 0, 0, 0, 0, 0, 0 zio_data_buf_5242880: 5242880, 0, 0, 0, 0, 0, 0 zio_buf_6291456: 6291456, 0, 0, 0, 0, 0, 0 zio_data_buf_6291456: 6291456, 0, 0, 0, 0, 0, 0 zio_buf_7340032: 7340032, 0, 0, 0, 0, 0, 0 zio_data_buf_7340032: 7340032, 0, 0, 0, 0, 0, 0 zio_buf_8388608: 8388608, 0, 0, 0, 0, 0, 0 zio_data_buf_8388608: 8388608, 0, 0, 0, 0, 0, 0 zio_buf_10485760: 10485760, 0, 0, 0, 0, 0, 0 zio_data_buf_10485760: 10485760, 0, 0, 0, 0, 0, 0 zio_buf_12582912: 12582912, 0, 0, 0, 0, 0, 0 zio_data_buf_12582912: 12582912, 0, 0, 0, 0, 0, 0 zio_buf_14680064: 14680064, 0, 0, 0, 0, 0, 0 zio_data_buf_14680064: 14680064, 0, 0, 0, 0, 0, 0 zio_buf_16777216: 16777216, 0, 0, 0, 0, 0, 0 zio_data_buf_16777216: 16777216, 0, 0, 0, 0, 0, 0 lz4_ctx: 16384, 0, 0, 32,74420675, 0, 0 abd_chunk: 4096, 0, 32938, 10497,115559825, 0, 0 sa_cache: 144, 0, 6278, 391, 1025867, 0, 0 dnode_t: 736, 0, 11211, 99, 1062121, 0, 0 arc_buf_hdr_t_full: 256, 0, 6507, 393,91785089, 0, 0 arc_buf_hdr_t_l2only: 96, 0, 0, 0, 0, 0, 0 arc_buf_t: 64, 0, 4276, 1304,91790505, 0, 0 dmu_buf_impl_t: 240, 0, 10706, 590,91827070, 0, 0 zil_lwb_cache: 320, 0, 6, 294, 520966, 0, 0 zil_zcw_cache: 80, 0, 0, 750, 527281, 0, 0 sio_cache: 128, 0, 0, 0, 0, 0, 0 zfs_znode_cache: 288, 0, 6278, 365, 1025851, 0, 0 procdesc: 136, 0, 0, 0, 0, 0, 0 ksiginfo: 112, 0, 161, 889, 7275257, 0, 0 itimer: 352, 0, 0, 0, 0, 0, 0 ng_pipe: 64, 0, 0, 0, 0, 0, 0 KNOTE: 160, 0, 88, 712,54769057, 0, 0 socket: 872, 257832, 120, 816,19790884, 0, 0 unpcb: 256, 257835, 83, 352, 7075414, 0, 0 ipq: 56, 31311, 0, 0, 0, 0, 0 udp_inpcb: 488, 257832, 13, 219, 3766760, 0, 0 udpcb: 32, 257875, 13, 1612, 3766760, 0, 0 tcp_inpcb: 488, 257832, 13, 4835, 6727583, 0, 0 tcpcb: 984, 257832, 13, 807, 6727583, 0, 0 tcptw: 88, 27810, 0, 5040, 3478661, 0, 0 syncache: 168, 15364, 0, 437, 6789583, 0, 0 hostcache: 96, 15375, 1, 778, 9129, 0, 0 sackhole: 32, 0, 0, 1625, 471248, 0, 0 tfo: 4, 0, 2, 751, 12, 0, 0 tfo_ccache_entries: 80, 0, 0, 0, 0, 0, 0 tcpreass: 48, 62582, 0, 1079, 92305, 0, 0 tcp_log: 400, 5000000, 0, 0, 0, 0, 0 tcp_log_bucket: 144, 0, 0, 0, 0, 0, 0 tcp_log_node: 120, 0, 0, 0, 0, 0, 0 sctp_ep: 1280, 257832, 0, 0, 0, 0, 0 sctp_asoc: 2288, 40000, 0, 0, 0, 0, 0 sctp_laddr: 48, 80012, 0, 830, 120, 0, 0 sctp_raddr: 736, 80000, 0, 0, 0, 0, 0 sctp_chunk: 152, 400010, 0, 0, 0, 0, 0 sctp_readq: 152, 400010, 0, 0, 0, 0, 0 sctp_stream_msg_out: 112, 400015, 0, 0, 0, 0, 0 sctp_asconf: 40, 400000, 0, 0, 0, 0, 0 sctp_asconf_ack: 48, 400060, 0, 0, 0, 0, 0 udplite_inpcb: 488, 257832, 0, 0, 0, 0, 0 ripcb: 488, 257832, 7, 201, 1036706, 0, 0 IPsec SA lft_c: 16, 0, 0, 0, 0, 0, 0 rtentry: 208, 0, 72, 175, 216, 0, 0 pf mtags: 192, 0, 391, 969,6758855780, 0, 0 pf tags: 104, 0, 3, 263, 5, 0, 0 pf states: 312, 805008, 10985, 46867,226262291, 0, 0 pf state keys: 88, 0, 15988, 66137,278130757, 0, 0 pf source nodes: 136, 805011, 0, 0, 0, 0, 0 pf table entry counters: 64, 0, 0, 0, 0, 0, 0 pf table entries: 160, 400000, 1432, 1993, 146836, 0, 0 pf frags: 256, 0, 0, 255, 24421, 0, 0 pf frag entries: 40, 5000, 0, 1100, 48817, 0, 0 pf state scrubs: 40, 0, 0, 0, 0, 0, 0 bridge_rtnode: 88, 0, 0, 0, 0, 0, 0 selfd: 64, 0, 212, 1586,459721468, 0, 0 swpctrie: 144, 998622, 0, 0, 0, 0, 0 swblk: 136, 998615, 0, 0, 0, 0, 0 FFS inode: 160, 0, 0, 75, 2, 0, 0 FFS1 dinode: 128, 0, 0, 0, 0, 0, 0 FFS2 dinode: 256, 0, 0, 75, 2, 0, 0 -
@heper said in NG6100 MAX - pf+22.05 "wired" memory increasing over time:
16: 16, 0,23018700, 510,1018355362, 0, 0
32: 32, 0, 15559, 5316,5358991388, 0, 0
64: 64, 0,11526267, 835,1410775321, 0, 0
128: 128, 0,34459501, 409,1895721235, 0, 0
256: 256, 0, 45512, 28573,6298090042, 0, 0
512: 512, 0, 5932, 1420,198321701, 0, 0Hmm, so ~4.4GB in the 128 zone, ~730MB in the 64 zone and ~360MB in 16.
If you run it again after some time are those all increasing at the same rate?
See this post for last time we looked at something similar: https://forum.netgate.com/post/1041601
Steve
-
@stephenw10
will add new timestamps as the day progresses2022/09/27-08:00
6404M Wired
zone16: 376MB
zone32: 0.5MB
zone64: 753MB
zone128: 4,504GB
attached dtrace_script_2022-09-27-0800.log.txt dtrace script output from post2022/09/27-09:00
wired 6453M
zone16: 380,465616mb
zone32: 3.554336mb
zone64: 755.222912mb
zone128: 4,537gb
dtrace attacheddtrace_script_2022-09-27_0911.log.txt2022/09/27-10:07
6475M wired
zone16: 381.96072MB
zone32: 3.560192MB
zone64: 758.20928MB
zone128: 4.55558976GB
dtrace: dtrace_script_2022-09-27-1007.log.txt2022/09/27-15:11
6625M Wired
zone16: 392.087136MB
zone32: 3.549216MB
zone64: 778.44768MB
zone128: 4.677006336GB
dtrace: dtrace_script_2022-09-27-1511.log.txtthat'll be all for me for today. gotta go do "stuff".
tonight i'll reboot the device remotely because i won't return to this school till friday & want to prevent it running out of memory (or start swapping) -
Ah, this is good data. We are reviewing it.
-
@stephenw10
do you need more data?
the dtrace script seems to target zone128. please let me know if you require other zones -
I believe we have found an issue in the code that pulls ethernet rules. It's particularly apparent where captive portal is running which is probably why you're seeing it more than most.
So we shouldn't need any more data but I'll reach out if we do.Yes, this:
https://github.com/freebsd/freebsd-src/commit/0044bd90f2397dfad5f4bbd12c64be86e0b7eb4a -
@stephenw10
Thanks for getting another cp related bug squashed.Will contact you again when I stumble upon the next rodent in the attic ....

-
@stephenw10 is there a redmine to follow up on the status of this bug?
(Didn't find one myself - but didn't look very hard) -
No, Kristof just went straight to the source! But there should be one to track it. I'll add one....
-
@stephenw10 when will a patch be released?
just got called in because school went offline:

tried to ssh remotely to reboot - then it got stuck somewhere
had to drive on site to powercycle the ng6100(yes i forgot to reboot before memory ran out ... )
-
It's patched in 23.01 if you're able to test that?
It's unlikely to be patched in 22.05 at this point because it would require a point release, the fix is in kernel.
Steve
-
@stephenw10 said in NG6100 MAX - pf+22.05 "wired" memory increasing over time:
It's patched in 23.01 if you're able to test that?
Is this Patch also in 2.7.0?
-
-
@stephenw10 test 23.01 on a production system with roughly 1k users ?
also: it's not mentioned in the 23.01 release notes posted alongside the beta announcement
-
Likely because it hadn't been marked as feedback yet. It is in 2.7 and 23.01 though. I've updated the ticket.
Steve
-
We need someone who was hitting this in 22.05 to test it in 23.01 to confirm it is fixed there.
Otherwise if it's not fixed in the current code it may not be before release.
Steve
-
@stephenw10 is netgate willing to verify/test the config of the school that hit this issue on 23.01 before i attempt the upgrade?
i can not afford to upgrade to a non/semi-working system that has bigger issue's then what i currently have.
so the verify / test would have to include the upgrade itself & basic connectivity appears to work in a lab environment. there are no addon packages installed.also: schools in belgium close down for the holidays. So between now & january 9th there will be no clients.
memory seems to increase only when there are "lots" of clients connected to CP. i can not observe memory-leakage during the weekends.also2: i read that the current builds still have some debugging enabled that cause decrease performance. how much % are we talking about on a ng6100?
conclusion: i'm willing to test this from january 9th if netgate can confirm there don't appear to be any issues upgrading from 22.05 to 23.01 with the config i have.
-
Well I can test a config in a 6100 running 23.01 but I obviously can't test it in your network environment.
-
@stephenw10 what's the preferred way to send you that config ?

